Logical vs. Physical Data Flow Diagram
Create a DFD Online Free Free Download Free Download Free Download Free Download1. What is Data Flow Diagram?
A data flow diagram depicts the information flow with each system. It uses specified symbols and arrows to display data inputs and storage points along with the pathways to each destination. The data flow diagrams (DFDs) are either classified as physical or logical. This article will define logical and physical data flow diagrams along with a comparison table.
They may be used to evaluate an existing system or model a new system. A logical DFD relies on the organization and how the organisation functions. In comparison, a physical data flow diagram demonstrates how the system will be implemented.
The physical data flow diagram depicts how the system will be designed. Usually, physical data flow diagrams are much more dynamic than logical data flow diagrams, largely because of the multiple data stores existing in a system. The processes reflect the applications, the components for the software and the manual protocols.

2. Logical vs. Physical Data Flow Diagram
The differences and similarity will be illustrated in the following part.
Developing Logical Data Flow Diagram
Logical data flow diagrams demonstrate how the organization works. The processes depict the business's operations. The data stores reflect the collected data irrespective of how the data is processed.
Logical DFDs focus on the business and the required information for its functioning, not on how the system operates or is being planned.
The use of a logical model has many benefits including:
- Effective communication with users;
- Establishing stable structures;
- Understanding of business and its operations by analysts;
- Maintenance and flexibility;
- Removing redundancies and making the physical model layout simpler.
While interacting with system users, a logical model is easier to follow as it is based on company operations. Thus consumers would be acquainted with the significant tasks and most of the individual information needed for each activity.Systems that are built using a logical data flow diagram are also more robust because they are based on business activities and not complex systems or application procedures.
Developing Physical Data Flow Diagram
Physical data flow diagrams built in EdrawMax often include intermediate stores of data, mostly a transaction document or a provisional table of databases.
A logical data flow diagram can be used to develop a physical data flow diagram. Physical data flow diagrams have several advantages including:
- Detailed description of which (manual) procedures are implemented by human beings and which are automated;
- Definition of processes in better depth than the logical DFDs;
- Sequencing processes which must be implemented in a precise order;
- Recognizing temporary data stores;
- Specify the real file names, database tables, and printouts. Logical data flow diagrams define actual file names as well as reports so that throughout the system development process, programmers can reference those with the data dictionary;
- Add monitoring to ensure that the procedures are performed properly. There are requirements or validations of the data to be met during entry, editing, deleting and other data processing processes.
Comparison of Logical and Physical Data Flow Diagram
There is a table to compare the features of logaical and physical data flow diagrams:
| Features | Logical DFD | Physical DFD |
| Model Depicts | Depicts how business operates | Depicts how the system will be implemented or how the existing system functions |
| Process Represents | Represents business activities and functions | Represents manual processes, programs and program modules |
| Data Stores Represents | Data is collected irrespective of how it is stored | Databases along with physical and manual files |
| Types of Data Stores | Data stores containing a permanent collection of data are depicted | Depicts master and transition files. Any process that happens at two different times must be connected with data stores |
| System Controls | Represents the business controls | System control is depicted for validation of input data, to supervise the completion of a process, and for the security of the system |
3. Examples of Logical vs. Physical DFDs
There is a comparison diagram illustrates the process of customer shopping process. From this, the main differences between logical and physical DFDs are that the payment ways and the action when calculating the final cost of the product showing below.
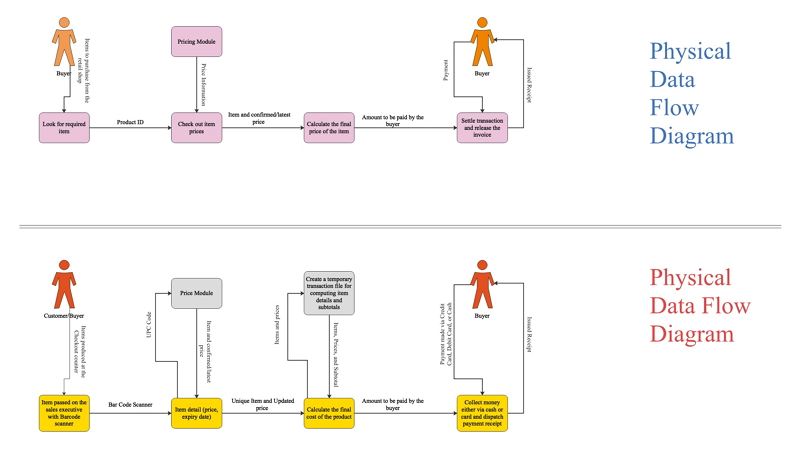
The above example is built in EdrawMax depicts a manual process of a buyer's journey from the beginning (item selection) to the end (issuing of receipt). The diagram illustrates the movements of the item including key manual processes like bar code scanning and unique ID registration.
With EdrawMax, it is easier to create logical and physical data flow diagrams by choosing a built-in template from the templates gallery. Furthermore, since it contains with substantial symbols, icons, shapes and so on, you can customize your data flow diagrams without any efforts.
4. Summary
The hierarchical design concept gained popularity in the software engineering field and the data flow diagram along with it. These data flowcharts can range from basic procedure overviews to multiplier, in-depth data flow diagrams that can further delve deeper into how the data is interpreted. EdrawMax is an effective and user-friendly tool that can be used to create data flow diagrams of all types - logical and physical data flow diagrams.


