What Is a Sequence Chart?
Create a Sequence Chart Online Free Free Download Free Download Free Download Free DownloadWhat Is a Sequence Chart?
A sequence chart is a series of events or actions set in the order in which they take place. It is considered to be a fantastic way to represent the necessary steps taken to reach the outcome.
When Do You Need a Sequence Chart?
- Reading
Reading is an integral part of learning during the initial years of schooling. However, reading a more extended story can be tricky for younger students. This is when a sequence chart can assist you. Before starting a new lesson, you can segregate it in numbers or paragraphs to set a sequence. Take a break between every course to make students understand the story thoroughly.
- Writing
A sequence chart can be of great assistance in writing. Setting up the details one needs in a sequence will help the students to write detailed descriptions without missing out on any point.
- Science and Engineering
Science and engineering is a vast topic. It involves numerous subjects and, thereby, questions. A sequence chart can help in reducing the complications of any item. For instance, in Botany, students need to learn a lot of botanical names of the plants. A labeled sequence chart can help them learn efficiently and save them much time.
- Activities
The academic years of students consist of various co-curricular activities and events. Sometimes, it gets challenging to keep in mind the rules and guidelines of a game or a business. Listing it in a sequence graphic helps in reducing the confusion in such scenarios.
Benefit of Using a Sequence Chart
First of all, the sequence chart helps in representing a smooth flow initiated from one end to another while they are simpler and easier to maintain. Secondly, any changes in the transitional flow can be easily updated in a sequence chart. Thirdly, sequence diagrams can be beneficial in the real applications of any system.
How To Create a Squence Chart in EdrawMax?


- Analyze and identify every step of transition in the event. Understand and examine all the steps that can be included. You can involve the students in the brainstorming session to have a clear idea of every version of the story.
- After exploring every step, arrange them in sequential order. You can use EdrawMax to create a sequence chart to organize them in an aesthetically pleasing way.
- Students can also take part in the activity. You have to use an edit link to let them make changes. Every edit will be applied to the chart in real-time.
- There is also an option to add comments to share your viewpoints on the diagram's particular instance.
- To make a sequence chart visually appealing, there is also an option to add images using an import or built-in image search.
- Export the sequence chart in multiple formats, such as PDF and JPEG. In addition, add these charts to your presentations or can take a print out for further uses.
Sequence Chart Example
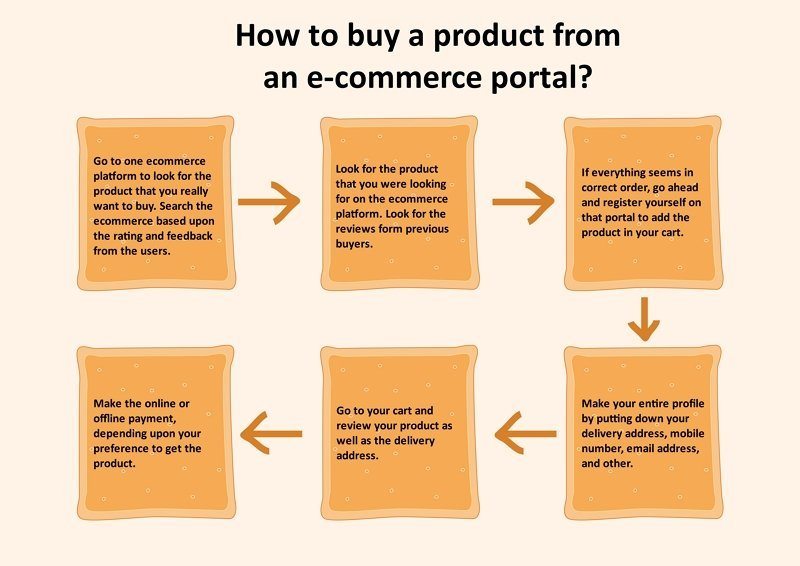
The following table is about how to buy a product from an e-commerce portal:
|
Go to one e-commerce platform to look for the product that you really want to buy. Search the e-commerce based upon the rating and feedback from the users. |
|
Look for the product that you were looking for on the e-commerce platform. Look for the reviews form previous buyers. |
|
If everything seems in correct order, go ahead and register yourself on that portal to add the product in your cart. |
|
Make your entire profile by putting down your delivery address, mobile number, email address, and other. |
|
Go to your cart and review your product as well as the delivery address. |
|
Make the online or offline payment, depending upon your preference to get the product. |
See the difference made by a sequence diagram below.
Why Using Diagram Software Is Better?
A sequence chart is an excellent way to document the complexities of any given topic more simply. Let’s discuss what makes them better if drawn by a diagram software rather than lists the events time order.
- Visually appealing
Enough studies have been conducted that prove how visuals last in the memory for a longer time. And that is why educational institutes have started incorporating a visual representation of various topics to understand the subject better. The whole purpose of a sequence chart is to break a problem in an order that is easy to understand. Using a software diagram to develop a sequence chart will elevate the graphics making it more exciting and visually appealing than any other way.
- Analyzing relationships between events
Using a diagram software to develop a sequence chart visualizes the events and analyzes the possible relationship between events. A software allows students to edit the diagram and put their point of view on the story. This helps teachers to have a good look at the things students have a say about. The software also has a feature to add comments and update changes, which is not possible in the sequence charts that are not developed in diagram software.
- Download and Print
By developing a sequence chart in a diagram software, you can easily export in multiple formats and print numerous copies to distribute among the students.
Key Takeaways
A creatively designed sequence chart with impressive graphics is far more eye-catching and aesthetically pleasing at the same time rather than the other sequence chart that looks more like a detailed list of steps arranged one after the other. Besides, people will find the designed graphical chart easier to observe and understand, whereas, the sequence chart that lists events in time and order might look confusing and consume more time for readers. Try EdrawMax and create your first sequence chart!


