Timing Diagram Explained
Create a Timing Diagram Online Free Free Download Free Download Free Download Free Download1. What is The Timing Diagram?
In Unified Modeling Language (UML), timing diagrams are a form of sequence diagram that use graphs and waveforms to depict the behaviour and interactions of objects and timed events during a certain period of time.

1.1 The Usage of Timing Diagram
- You can tell what changes an object undergoes during its lifeline;
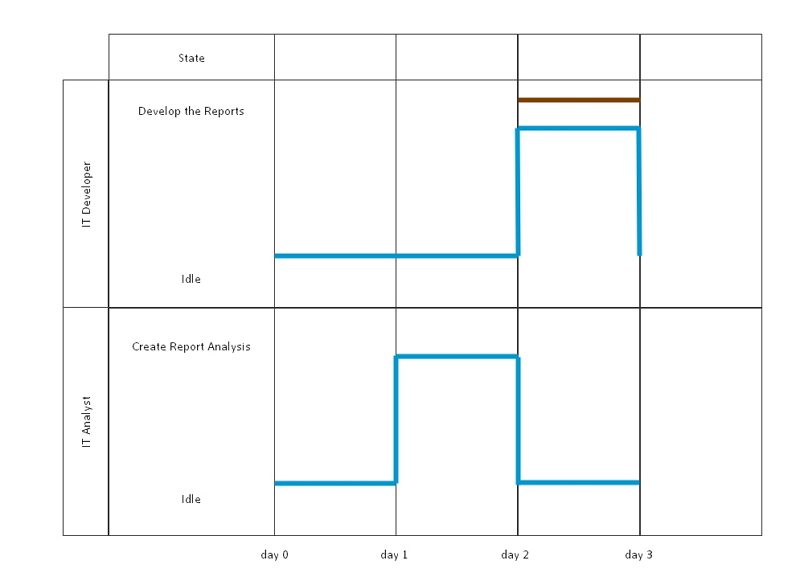
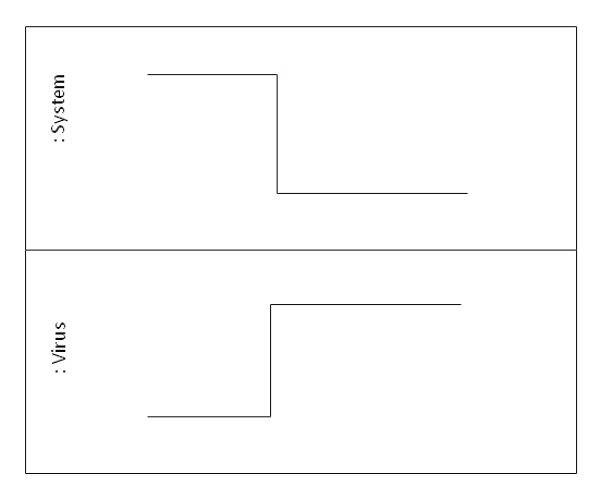
- You can tell how objects interact, and how one the state of one object affects the other (see example below);
- Timing diagrams show how long the certain processes take. From this data, users can know which steps in a process take too much time, and what needs to be streamlined for the system or piece of software to operate more efficiently as a whole.
1.2 Timing Representation
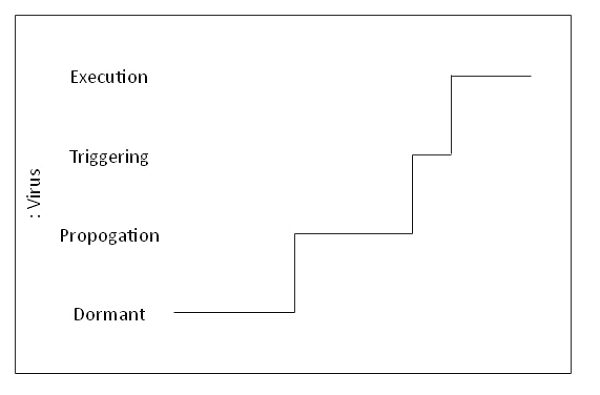
- State timeline representation
- Value lifeline representation
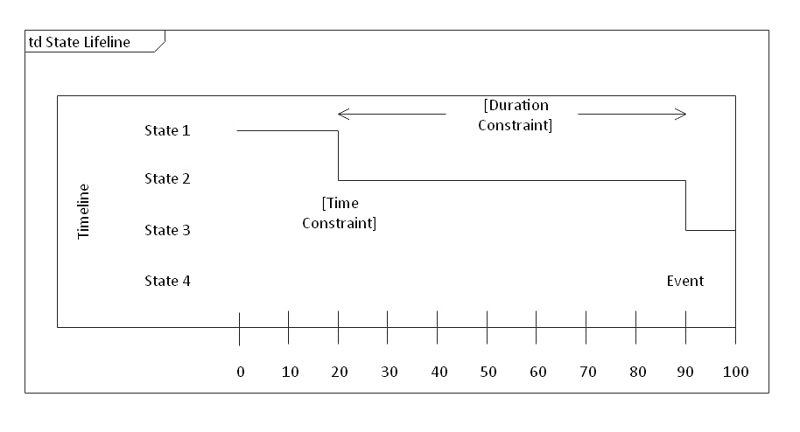
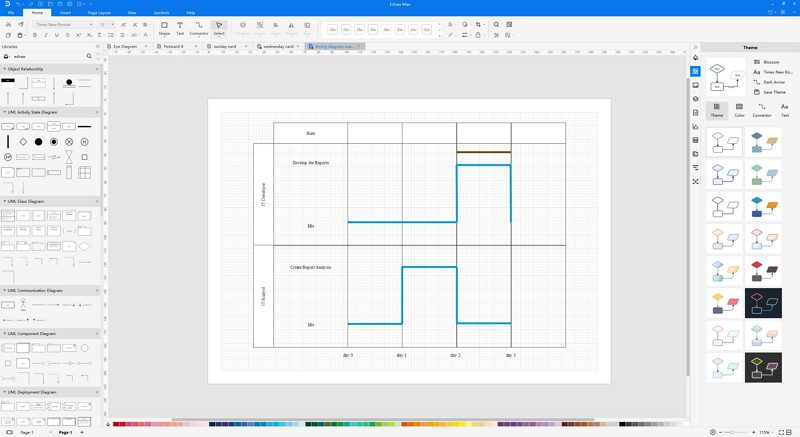
It is used to show the change of state over time, which is represented by a change in levels of the lifeline. Changes in levels can be caused by a variety of factors, including receiving messages, conditions within a system, or a passage of time.
X-axis: time Y-axis: state
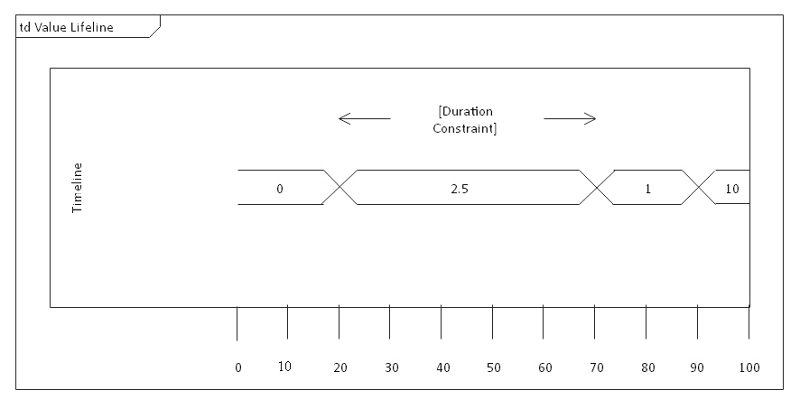
It is used to show the change in value of subject matter over a period of time. This is represented by the crossing over of the two horizontal lines.
X-axis: time
1.3 Basic Concepts
| Lifeline |
Represents an individual part of an interaction. |
| State or condition timeline |
A continuous timeline that represents the state of participating classifiers or testable conditions. |
| Duration constraint |
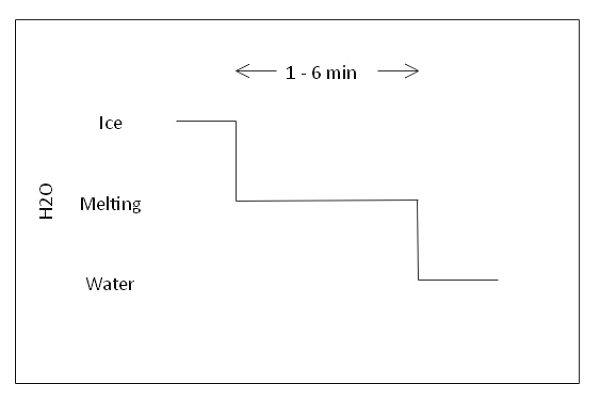
Represents a duration interval, or the period of time a state or value must be in effect for. A failed system is one where a state or value which falls over or under the scope of the constraint. |
| Time constraint |
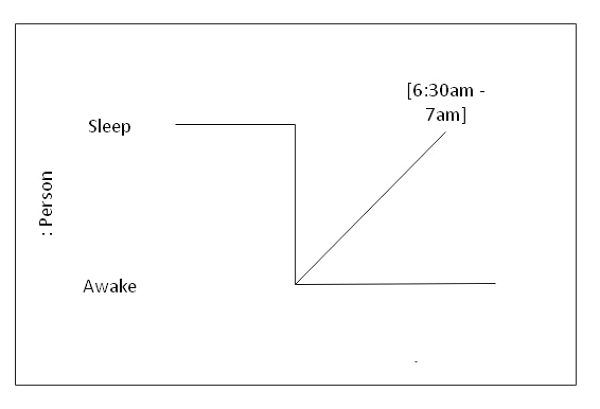
Indicates when an event should occur. If an event fails to occur in said time, the system is considered to have failed. |
| Destruction occurrence |
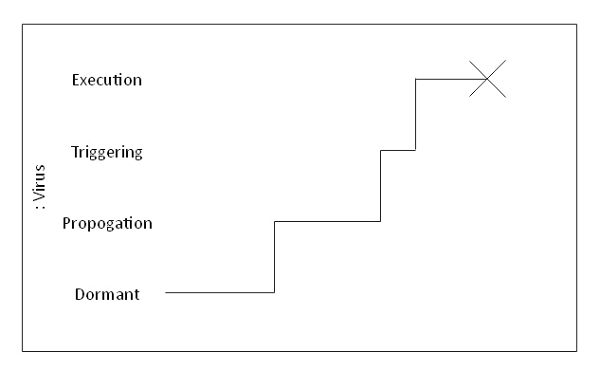
An “X” symbol marks the end of a lifeline. |
1.4 Commonly Used Timing Diagram Graphics
| Square wave |
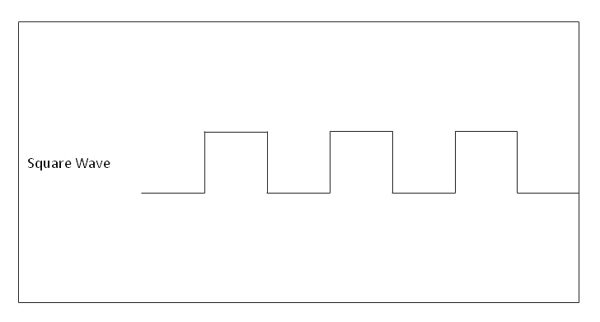
Commonly used as “clock signals”, which represents a constant signal, and is used to provide the user with a time sequence overview. |
| Positive/Negative edge trigger |
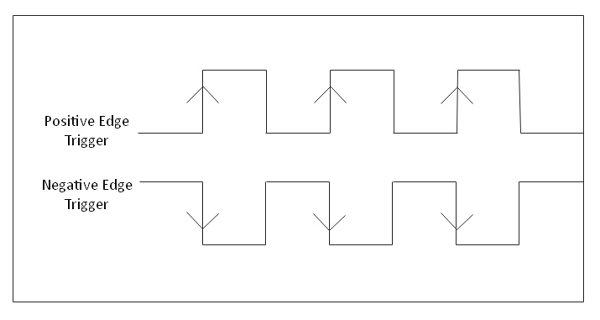
Arrows are used to determine whether the signal is triggered on the positive or negative edge. |
| Ramping signal |
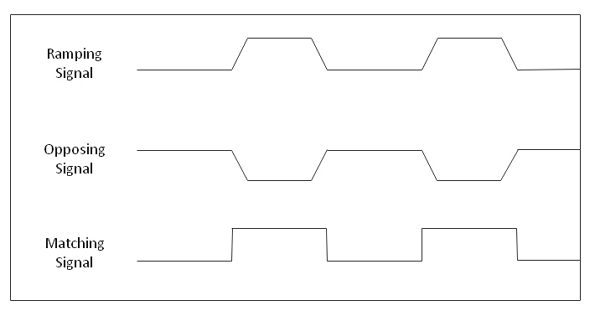
Ramping signals are used to show triggering, or to show that two signals are in direct opposition to each other. |
| Either or |
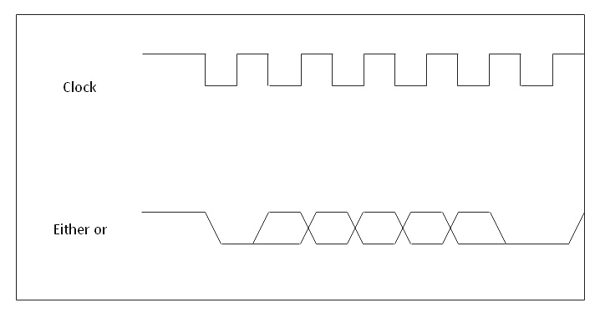
The either or signal, represented by the graph with the overlapping signals, is used to show that the corresponding signal can be high or low. |
| Greyed out |
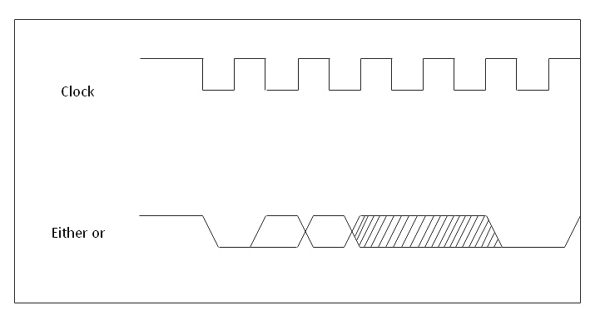
Greying out a section is most commonly used in cases where the system does not care what the signal’s values are. |
| Time pass spacing |
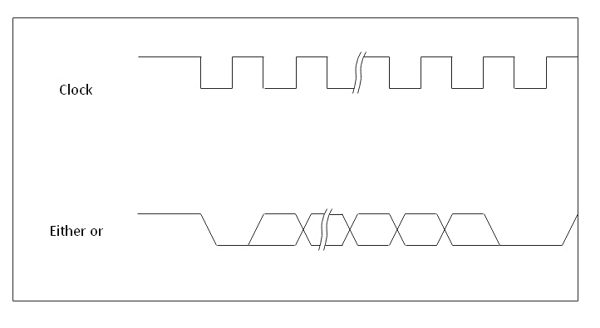
A gap in time, or other measurable value is, represented by a break in the middle of the signal as shown. |
| Bit labeling |
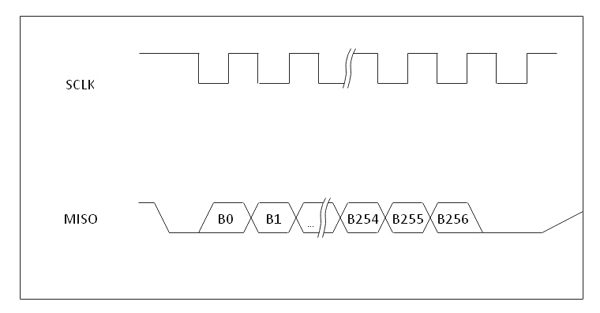
Bit labeling is used to show a larger range of values. The gap indicates a significant chunk of data in the range. |
| Arrows and space demarcation |
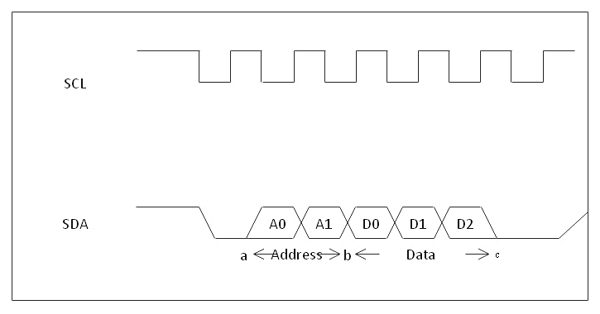
In this example, the arrows and space demarcations indicate that the first two sections are address components, and the next five are data components. |
2. How to Create The Timing Diagram in EdrawMax?
EdrawMax’s intuitive software allows you to create your own timing diagrams. Whether it’s a basic or complex one, follow this outline to create one that fits your needs.
Step 1: In your browser, visit EdrawMax Online Version to access, or download the EdrawMax Desktop Version

Step 2: In the white sidebar, click on Software Development. Then, click on the UML Modelling box that appears near the top of the screen.
Step 3: Choose a template, or click on the UML Modelling box with the “ + ” to open a new document.
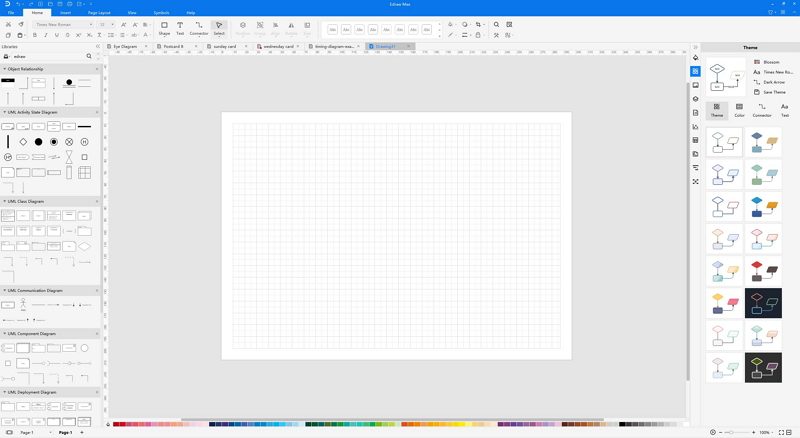
Step 4: The symbol library can be found to the left of the screen. Scroll down further to find more UML-related symbols.
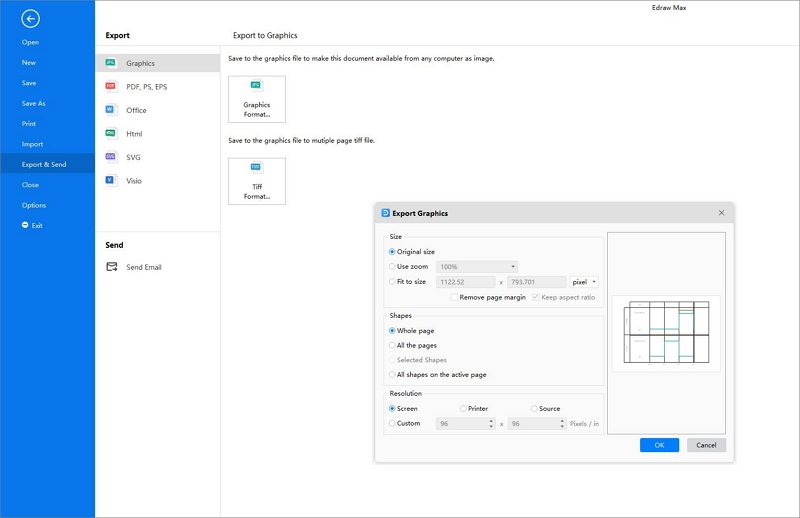
Step 5: Simply drag the components you need from the symbol library onto the blank document to start creating. Each element can be moved, resized, or customized to fit your needs. Once finished, just export it in multiple formats or email it directly.
3. Examples of The Composite Structure Diagrams
Here are some examples of timing diagrams that you may reference.
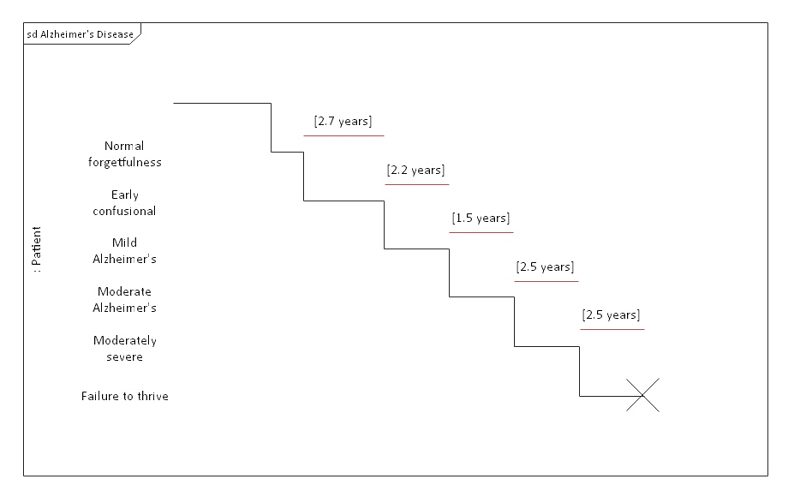
Diagram 1: Timing diagram showing the seven stages of Alzheimer’s Disease.
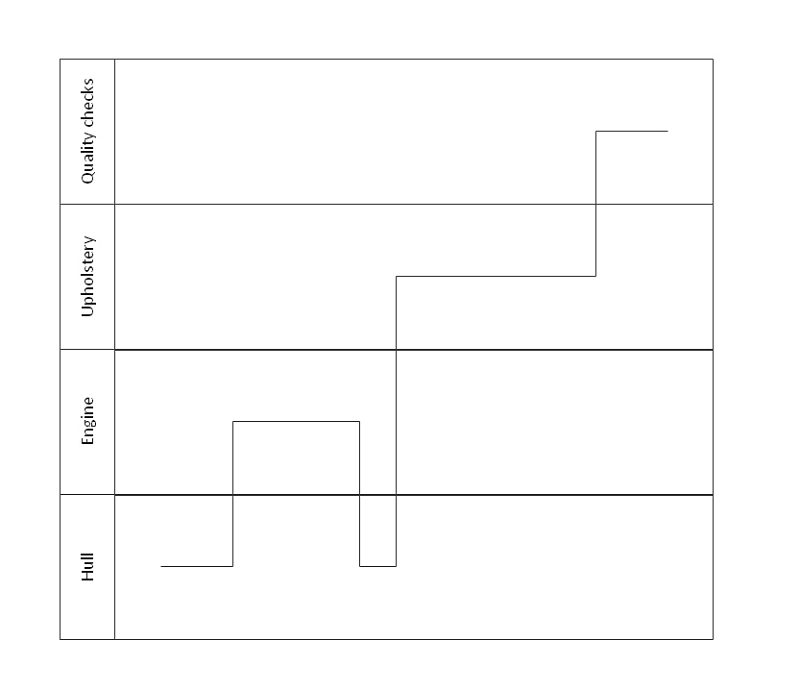
Diagram 2: Boat manufacturing process.
4. Conclusion
One of the key benefits of a UML timing diagram is that it gives users an overview of what goes on in a system or piece of software. More critically, it shows which steps in a system take too much time, and this information can be used by business users and developers alike to improve their processes. Create your own timing diagrams now using EdrawMax’s powerful and comprehensive diagram tool!


