A Guide to Understand Tuning Fork Resonance with Experiment Diagram
The students can learn the tuning fork resonance experiment with the help of scientific diagrams. They can use the EdrawMax Online tool, which can help them in creating a high-quality science diagram for their lessons and projects. It will help them to avoid the difficulty of drawing the diagram by hand.
1. What is Tuning Fork Resonance
The tuning fork resonance is the expriment to measure the vibe of sounds. There are two parts are composed of tuning fork resonance, which are the forced vibration and resonance.
Forced vibration: Most objects, including musical instruments, have their vibration fixed at their natural frequency. When it gets stuck, its particles lose their stability and resonates at its natural frequency. When an object resonates, its particles vibrate and force the surrounding air and other interconnected things to vibrate. This phenomenon of having an adjoining or interconnected object set in vibration by another object is called forced vibration.
Resonance: When an external force or vibrating object forces another system to vibrate in an amplified vibrational pressure at a specific frequency, it is called resonance.
2. Explain Tuning Fork Experiment
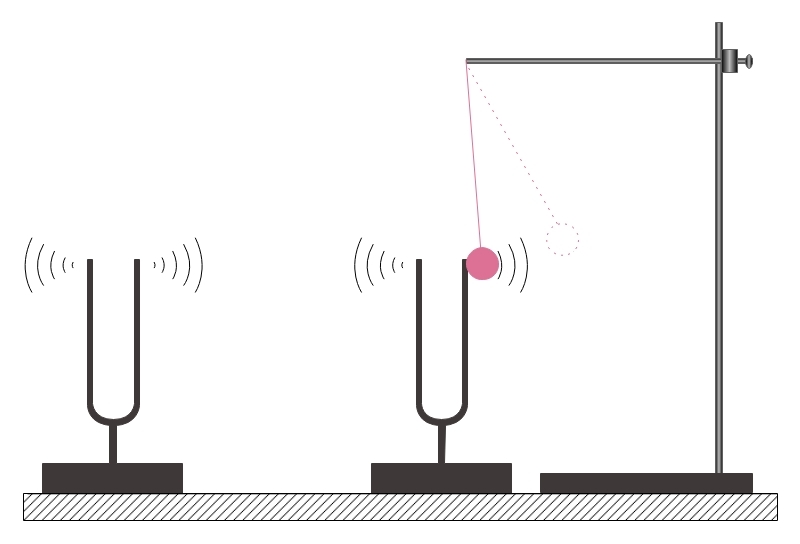
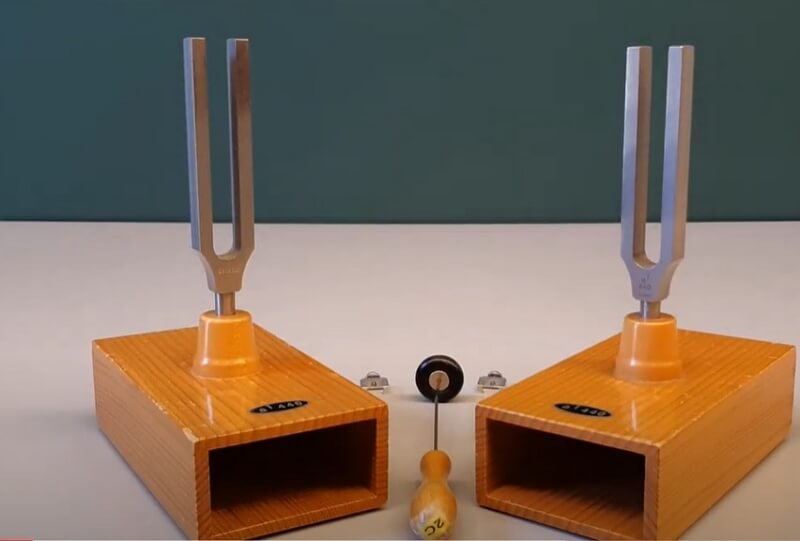
For the tuning fork experiment, students should have two identical wooden boxes with an open end. They need to have similar tuning forks placed at the center of the box. When the students strike tuning fork, the resonance in the box results in the amplification of the sound. If there is a box only a few centimeters away from the open end of another box, a strike on one of the tuning forks initiates a sympathetic vibration in the other one.
It can be observed by lightly touching the sound of the fork with a ping-pong ball tied to a thread. When the fork vibrates, the ball bounces back and forth. Students can carry out the demonstration with the help of a lump of clay. It can show a reduction in the frequency of the fork, and when struck, generate clear beats.
Process: This experiment aims to show how sound increased with resonance. For the study, the boxes must be there to face each other's open ends. Then, the ping-pong ball stand is fixed in such a way that it softly touches the fork. If one of the tuning forks is stuck during the experiment, students observe a back-front movement of the ping-pong ball. When a lump of clay is there at the fork's tine, each striking fork creates beats that the students can hear. With the increase in the size of clay, the frequency decreases.
3. How to Draw Tuning Fork Resonance Diagram
There are two ways to draw the tuning fork resonance experiment diagram, one is by hand, and another is use the easiest online tool.
3.1 How to Draw Tuning Fork Resonance from Sketch
The students can create the scientific diagram of the tuning fork resonance experiment by hand. For that, they need to follow these instructions:
Step 1: First, the students need to draw two hollow boxes which have their openings facing each other.
Step 2: Then they need to place the tuning forks on the top of the boxes, which look like the English alphabet 'U' with a stand at their bottom.
Step 3: Beside one of the tuning forks, there should be a stand with a ping-pong ball attached to a thread.
Step 4: The ball should touch the tuning fork, and there should be a symbol of sound drawn near both the tuning forks.
3.2 How to Draw Tuning Fork Resonance Online
Creating the diagram of scientific experiments by hand can be challenging. The students must use the EdrawMax Online tool. It can save time and help in drawing a high-quality image of a tuning fork resonance experiment. Here are a few simple steps which they can follow:
Step 1: EdrawMax Online is a user-friendly tool. Any inexperienced user can work on it comfortably. To start with their diagram, they need to go to the EdrawMax Online tool and open New. Next, they need to click on Science and Education option. Or the Science Illustration section.
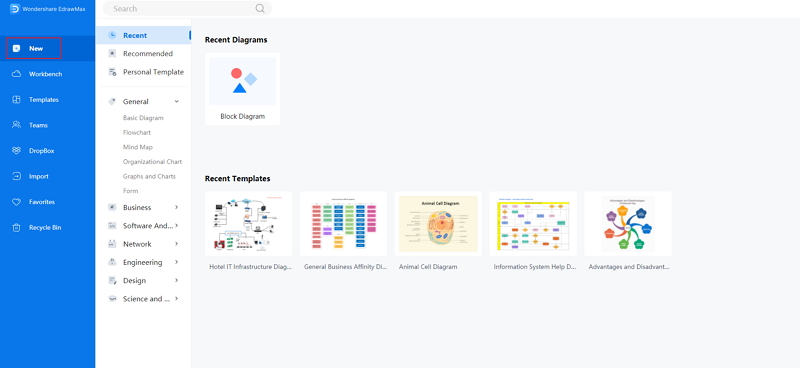 Source:EdrawMax Online
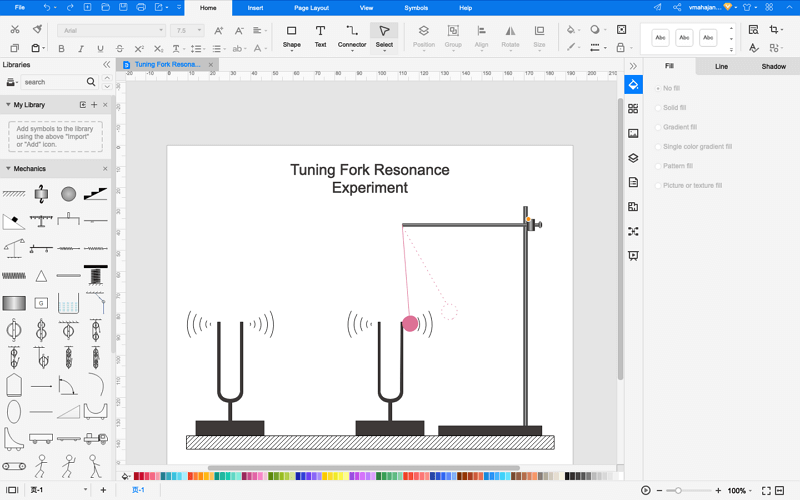
Step 2: The tool is immensely beneficial for creating different educational pictures, which the students can use for their studies and projects. They can find the template in the Mechanics. You can select the diagram they need from here.

Step 3: EdrawMax Online tool allows the users to edit the images to suit their requirements. After selecting the template, you can easily modify it as per their choice.
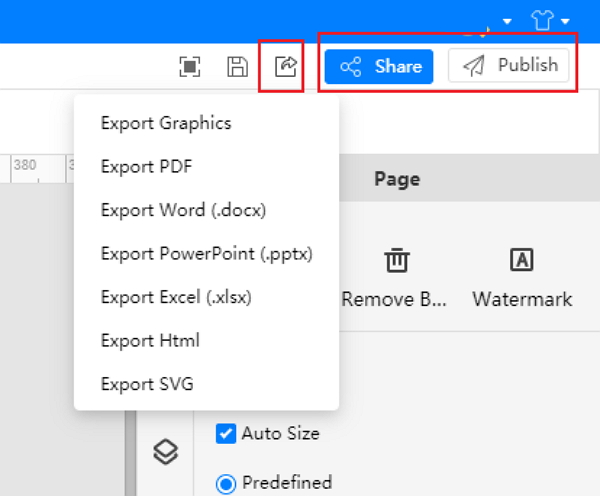
Step 4: Finally, when the student completes their diagram, they can easily save it and Export in different formats for using it in their projects. It supports to export in mulitple formats, such as Microsoft Office, Graphics, PDF, and more. Or, you even can present it in front of others by using the Presentation Mode.
4. The Resonance Examples
Resonance has everyday usage. In daily life, starting from the microwave oven to the gigantic bridge, resonance has something to do with them. Moreover, many famous musicians are grateful for this phenomenon called resonance because many musical instruments work on this principle. Here are a few examples of resonance in everyday life
- Guitar: When the guitarist strikes the guitar strings, there is a vibration. It eventually gets passed on to the hollow wooden box. Thus, creating resonance, and the sound gets amplified.
- Radio: There should be a change in the natural frequency of the receiver to listen to a particular radio station. When the natural frequency of the receiver matches the radio station's transmission frequency, there is a transfer of energy that allows a person to listen to a particular channel.
- Bridge: The soldiers are often not allowed to march on the bridge. The vibration created by the march on the bridge added to the bridge’s natural frequency can cause it to fall apart. In the case of the Tacoma bridge, the frequency of air matched that of the bridge.
- Pendulum: The pendulum shows a regular sidewise movement in a regular time interval. When the pendulum reaches its natural frequency of oscillation without even a push, it maintains the same amplitude.
- Microwave oven: There is a particular wavelength and frequency of the microwave oven radiation while the molecules of water and fat have their resonance. They absorb the wavelength at a specific frequency and vibrate. It causes the food to heat up for cooking.
5. Conclusion
During an experiment of mechanics or physics, it is best to use scientific diagrams. For these subjects, experiments largely depend on the process. A correct setup and procedure can give an accurate result. Therefore, to learn about the tuning fork resonance experiment, the students should use scientific diagrams. However, it may be challenging to create a high-quality tuning fork resonance diagram by hand. The students and researchers must use the EdrawMax Online tool.
In conclusion, EdrawMax Online is a quick-start diagramming tool, which is easier to make artery and vein diagram and any 280 types of diagrams. Also, it contains substantial built-in templates that you can use for free, or share your science diagrams with others in our template community.
Related Articles


