What is Circular Diagram
Create a Circular Diagram Online Free Free Download Free Download Free Download Free DownloadWhat is a Circular Diagram?
The circular diagram shows the data values as percentages of the total. Separate divisions make up categories. The size of each segment will be determined by its respective value. Circular diagrams usually show percentages.
The circular diagram basically illustrates the resource-money relationship between businesses and households. A circular diagram is a graphical representation used in economics to represent the financial transactions in an economy.
The basic circular diagram consists of two segments that dictate revenue, investment, and output: flow of physical things (goods or labour) and flow of money (what pays for physical things). A circle diagram illustrates the internal workings of a financial structure and different parts of the economy making it widely used in a wide variety of presentations.
Benefits of Using a Circular Diagram
If you deal with data using whole percentages, then circle graphs would be good for you. Pie charts are another name for circle graphs. Keep in mind that the sum of the percentages in your circle graphs must be equal to 100%. Other than the key benefit that circle graphs show the total percentages for each category, it's also visually appealing.
The benefit of a circular diagram compared to linear ones lies in its cyclical structure of inputs and outputs, with no dead-end in sub-processes. Perhaps the circle diagram (also called the circle model) is the simplest diagram for understanding economics.
Symbols of Circular Diagrams
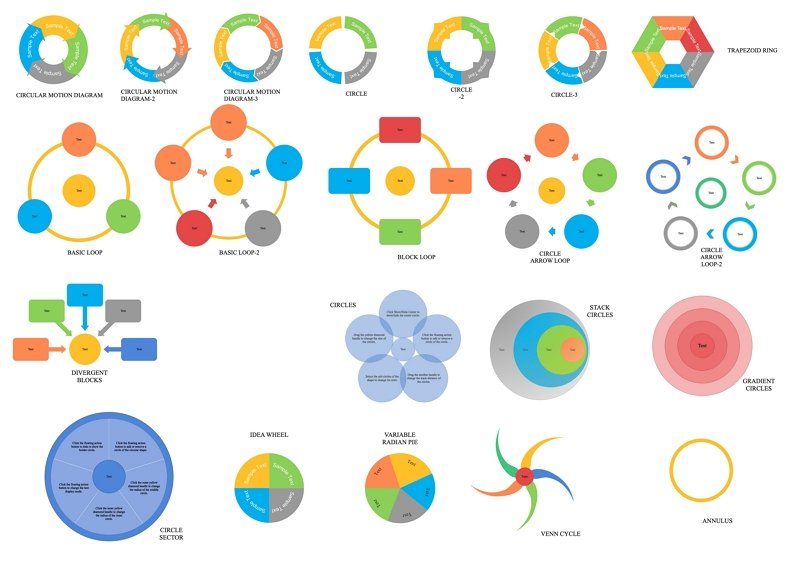
The circular charting shapes include circular motion, circle, trapezoid ring, basic loop, divergent circle, divergent blocks, highlight circle, variable radian, bevel style circle, circle pie, Venn circle, among others.
How To Create a Circular Diagram?
Using EdrawMax you can create easy, well-designed circular diagrams to depict your data. Follow this step-by-step guide.
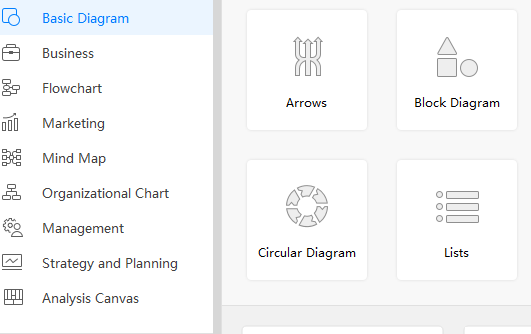
- Step 1: Open EdrawMax -> click ‘Basic Diagram’ and select Circular Diagram.
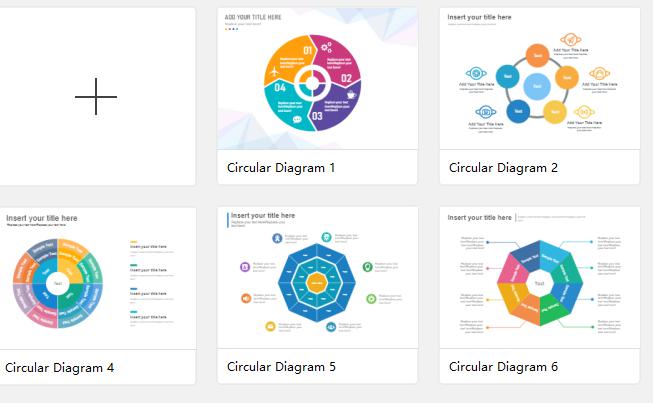
- Step 2: Once selected, you can choose a template or the option for a blank canvas.
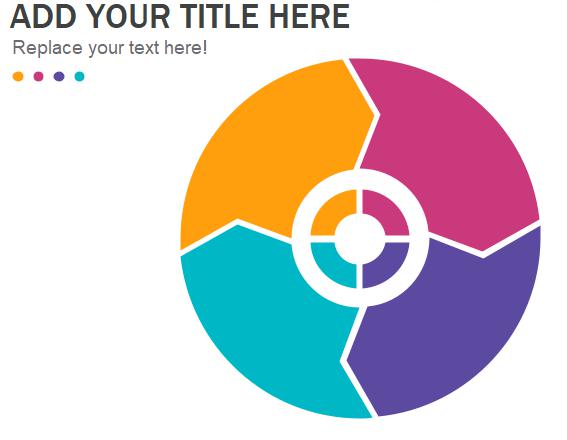
- Step 3: Create your circular diagram, from the wide range of shapes, colours, and grids available. Don’t forget to add your text.
- Step 4: Save and export your diagram to any file type you wish to. As EdrawMax is compatible with multiple file types.
Applications Scenarios of Circular Diagrams
- Six Market Model
- Onion Diagram
- Personality Analysis
- Personality Dimension
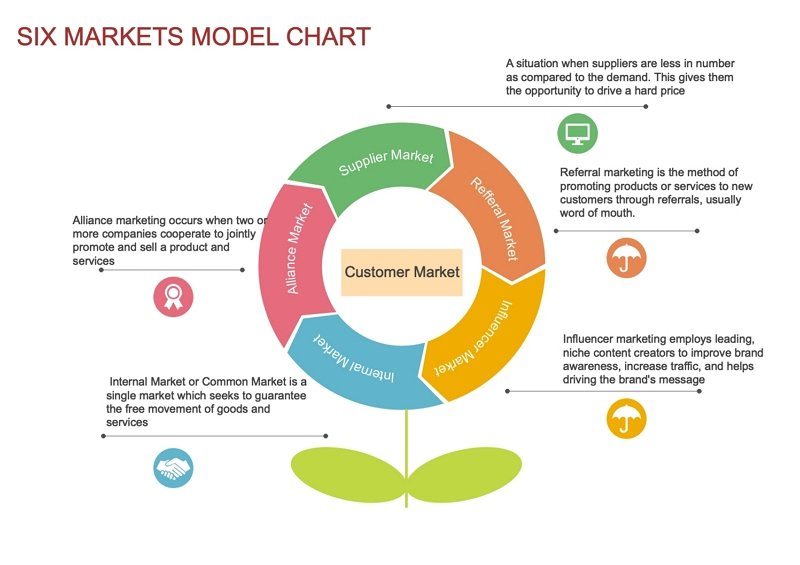
The six markets model helps the organization to analyse the stakeholders and key market domain which might be important for them. The concept/structure of the six markets provides an expanded view of where marketing can be implemented.
It defines six primary business domains where companies can guide marketing activities and will need to develop comprehensive marketing strategies. Such markets are referral markets, supplier markets, recruitment markets for employers, industry market, and internal markets.
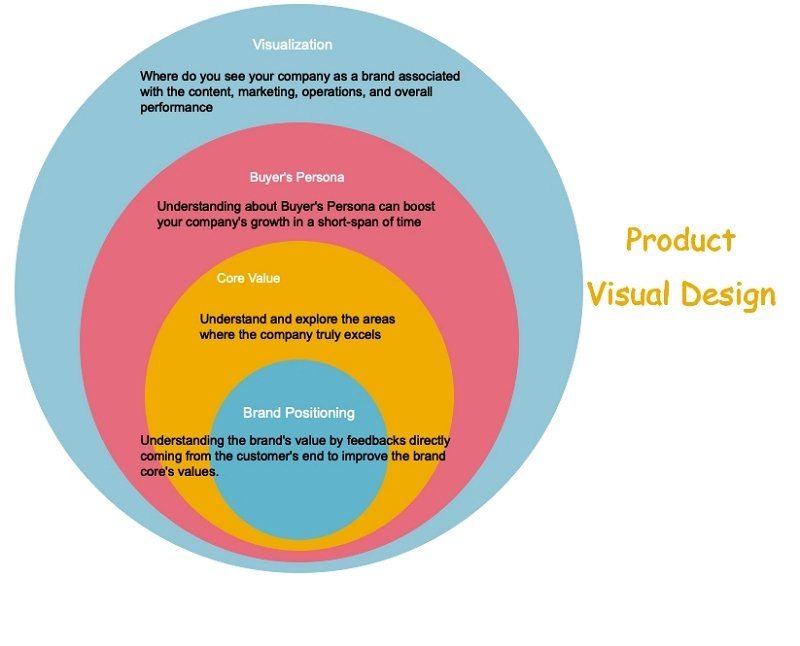
An onion diagram is a type of a chart showing the dependencies between sections of an entity or operation. The chart displays objects in concentric circles, where objects in each ring are based on items in the smaller rings.
The onion diagram is capable of displaying layers of a full structure. Each of the circles is capable of representing a component that depends on the inside component shown by the circle inside it.
The diagram's principal definition is demonstrated by the diagram's middle circle. The chart is used because it has a simple, easy-to-read graphic representation, which has a good visual effect.
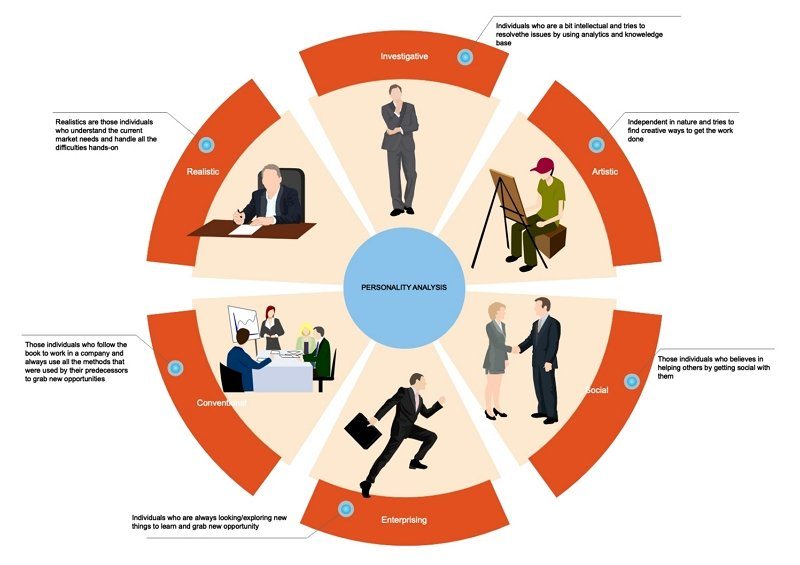
This circular diagram analyzes different personality types, which can offer some advice for career choice. Personality analysis is the assessment of personal characteristics.
This analysis is an end result of gathering information aimed at advancing psychological theory and research and increasing the likelihood of making wise decisions in applied settings (e.g., selecting the most promising individuals from a group of job applicants).
This method of personality analysis is used based on the premise that much of the observable behavioural variation from one person to another. It stems from variations in the degree to which individuals exhibit specific underlying personal characteristics.
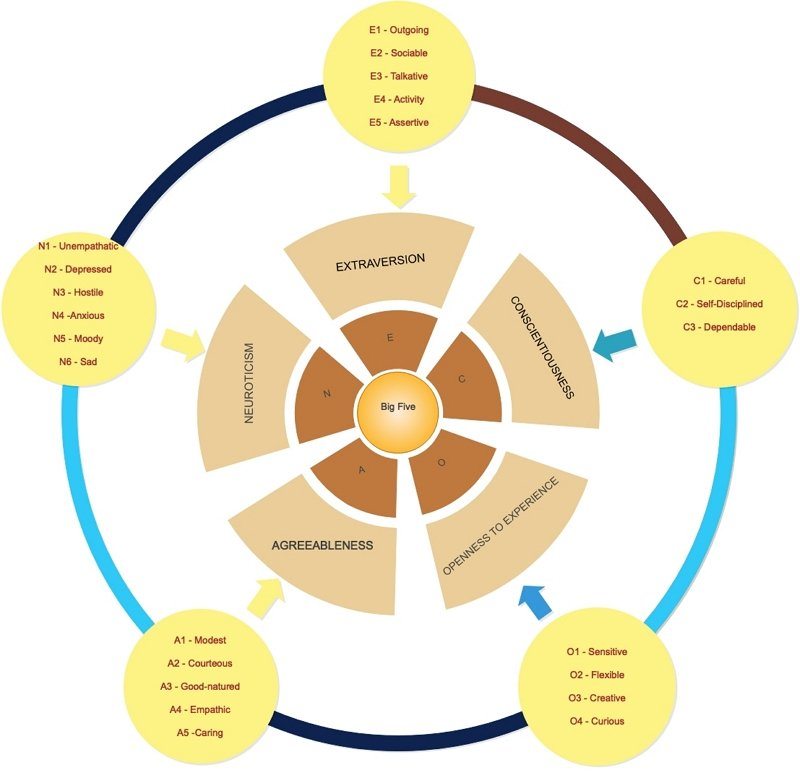
The five dimensions are defined in the following order of decreasing robustness based on existing personality scales: neuroticism, extroversion, open-mindedness, conscientiousness and agreeableness.
Personality dimensions translate deep theories about personality into common language. It provides a comprehensible context. Personality dimensions are the study about understanding self and others to make the relationships, your work and your life more successful.
Why Use EdrawMax To Create Diagrams?
EdrawMax is a all-in-one diagramming software which helps create the flowcharts, organizational charts, mind maps, network diagrams, floor plans, workflow diagrams, business diagrams, circular diagram and engineering diagrams.
- Massive symbols & templates
- Sturdy compatibility of files
- Personalisation
Templates let you get started quickly. Get inspired and quickly start your design by choosing from thousands of our professionally designed templates.
You can import Visio files or export your drawings to a number of common file formats, such as Visio, PDF, Word, PPT, JPEG, Html, etc.
The software comes with lots of vector shapes and is easy to customize. You can also connect information, add activities and track your everyday schedule. It is extremely easy to use and the interface is designed to smoothen manual procedures.


