What Is a Funnel Chart
A funnel chart illustrates the flow of data in a process commonly used by people of various professions, such as marketers and sales managers. Here, we will tell you everything you want to know about funnel charts. Learn how to create funnel charts, their purpose, and use cases. Also, check out our free funnel chart templates.
1. What is a Funnel Chart?
A funnel chart is an excellent data visualization tool that depicts connected stages and a series of data values. They are mainly used to showcase sales funnels, sales management, order fulfillment, and recruitment. These charts resemble a funnel with the broadhead at the top and the narrow neck at the bottom. A funnel chart graphically represents a process or data flow in a hierarchy. It uses the size of each section in the funnel to depict the number of data values or users connected in a linear process.
You can use a funnel chart to track workflow and analyze conversions. It doesn’t use an axis to represent data on a graph, and you can use it to depict data regression as it moves from one phase to another. It is used primarily to visualize connected sections of a linear process. The chart follows a simple hierarchy where the highest number of values go at the top and moves down to the next highest till it reaches the lowest number of data values. You need absolute counts of users at the start and end of any process to create an effective funnel chart.
Click on the image to edit. Source: EdrawMax Online
2. Benefits of Funnel Chart
Reveal bottlenecks in a linear process with funnel charts. These charts visualize data flow and make it easier to understand the logic of any process. As the process moves forward, you can track all data values and discover a bottleneck in the linear process where data flow stops.
Calculate retention rates using funnel charts. Using funnel charts, the illustration of values and users follows a hierarchy in which users' rates and data value reduce as the process moves. Each step cuts down the value, and you can calculate the number of users leaving at each stage. It is simple to calculate accurate retention rates with funnel charts.
Use other visualization tools to cross filter funnel charts for the same data flow report. Funnels charts give you the flexibility to attach and use different visual representation tools to filter and highlight the critical details in the chart. It means you can use other graphs and charts to explain the funnel better. It also helps you analyze the conversion rates of customers.
3. Funnel Chart Use Cases
Selection Process: Funnel charts are helping tools that help human resources visualize their recruitment and selection process. It makes it easier to track the number of applicants who applied for a job, those who were called in for an interview, and the ones who passed the screening and reached the final interview. Instead of writing this down in plain text, illustrate the recruitment rate with funnel charts.
Customer Dropout: You can use a funnel chart to depict the customer dropout process as the sales proceed. A standard sale starts with picking a target audience and introducing them to the products or services via calls. After that comes the follow-up on the sales where some customers drop out. The next step is to analyze the conversion rates of customers considering the sales offer. Most customers drop out before making the purchase.
Order Fulfilment: We use funnel charts to illustrate the order fulfillment process. This process starts after customers decide to purchase, so they contact the store and register and order. The order moves through four steps before the product reaches the customer. The store processes the order and approves it after checking if it is available. The number of buyers reduces in this step. After the shipping starts, some orders come back for various reasons.
Track workflow: You can use funnel charts in sales, marketing, and analyzing workflows of operational areas. You can make the process of order shipment as an example. After the order is approved, it goes into the database within 24 hours. After that, the worker picks the product and prepares it for shipment within 24 hours. The next step is transportation, and finally, the product reaches the customer.
Watch this video to learn more about marketing diagrams. If the video doesn't play, please visit it at YouTube.
4. How to Create a Funnel Chart?
Here are some tips on creating a funnel chart and accurately representing data. When creating a funnel chart, make sure that the caption is short and easy to understand for the reader. Maintain the chart's layout by using the size of bars to illustrate data values. Label the graph after adding the data values and creating the funnel.
4.1 Tips for Creating a Funnel Chart
Tip 1: You can create a funnel chart using any style you want, but if you are looking for an easy-to-understand manner, go with a bar-style funnel chart. Instead of using a line to represent the boundary of a section, a bar chart uses area boundaries to separate sections and make things easier for the reader.
Tip 2: Make sure to take care of spacing between funnel sections. You can create a funnel using an inverted triangle and divide it into sections. The width of an inverted triangle shortens as we move from top to bottom, so keep the vertical spacing even.
Tip 3: Using the funnel chart is not always the best choice to visualize data, and you can use it to depict a process with 4 to 6 steps. The chart won't give you much insight with less than four steps and will get confusing with more than six steps.
4.2 Steps to Create a Funnel Chart
After you understand funnel charts, the next step is to get started with EdrawMax and create it using free templates. EdrawMax Online is the best funnel chart maker because of its user-friendly interface and comprehensive collection of free templates. It also comes with a symbol library and many unique customization tools. EdrawMax lets you export your diagram in any format you want, and you can create more than 280 types of graphs with it. Here are the steps to create a funnel chart on EdrawMax.
- STEP 1: Log in to EdrawMax or create a new account.
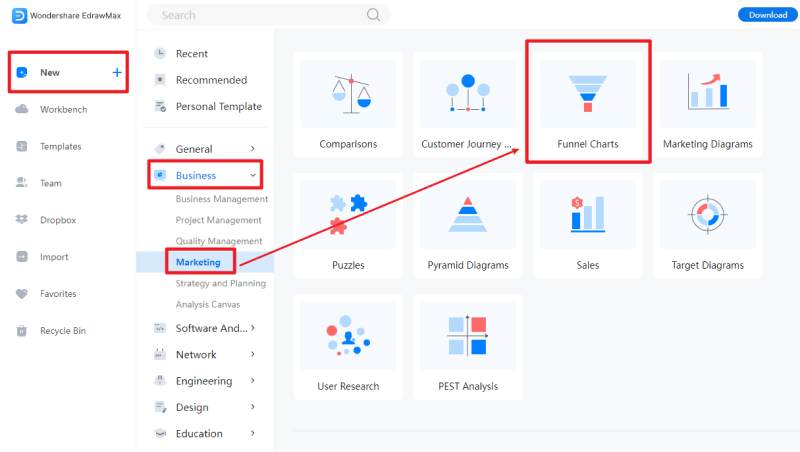
- STEP 2: You can make your diagram using a template or open a blank canvas to draw it from scratch. Go to new, and click on the Business category. Select the Funnel Chart and click on the "+" button to get a new canvas, or select a template to edit it right away.
- STEP 3: The next step is to customize your funnel chart template. Go to the symbols library and insert icons and symbols with a simple drag and drop. Add connecters to visualize the relationship between components. Align your diagram, adjust the layout, and style it by changing fonts. Customize it using drawing tools, auto themes, and color fill.
- STEP 4: After your diagram is complete, the next step is to download it. EdrawMax Online supports various document formats, so you can export in any format you want. You can also share and print it.
5. Free Funnel Chart Templates
You can easily create funnel charts with a free funnel chart template . The purpose of these charts is to visualize data and make it easier to understand for the reader. However, making a funnel chart takes time and effort, which is why professionals use editable templates to create these charts. Here are some free funnel chart templates.
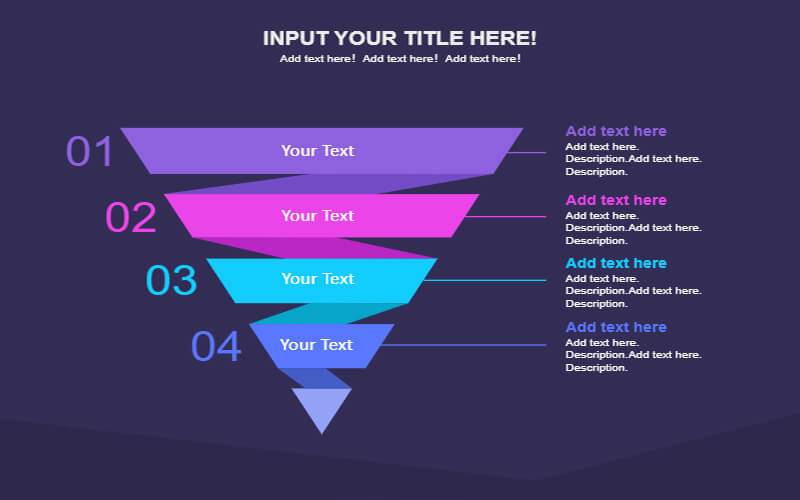
Example 1: Editable Funnel Chart
The editable funnel chart in this example is mainly used for powerpoint presentations, and it depicts a four-step process in using an inverted triangle. Each section of the funnel is in a different color for clarity. There are also text spaces where you can add the title of your funnel and label to explain your chart. Professionals use this template to edit it in a few clicks and quickly complete their tasks.
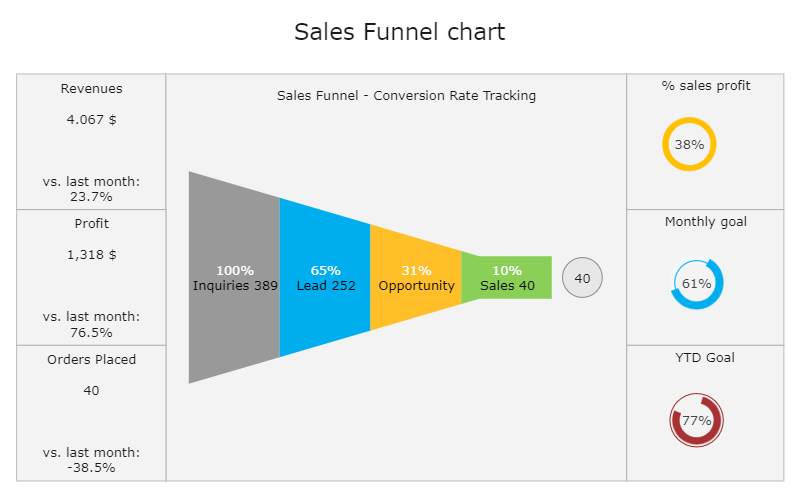
Example 2: Pipeline Funnel Chart
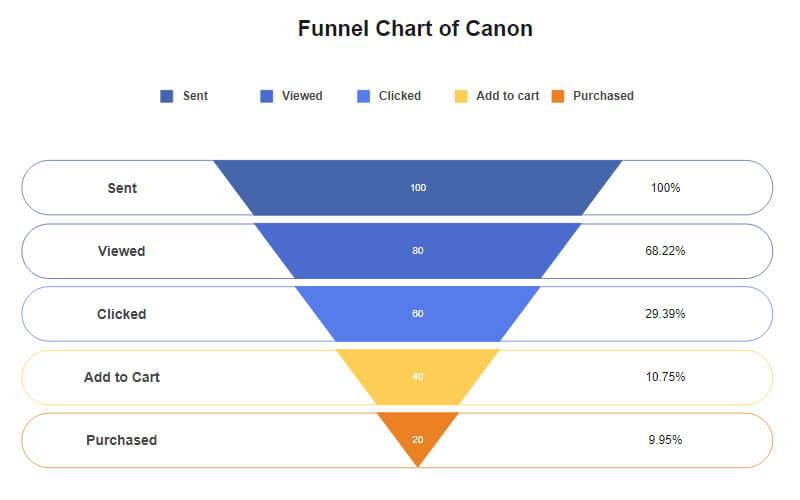
The pipeline funnel chart in this example illustrates a sales funnel to track the conversion rates of customers. The first section of the funnel contains hundred percent inquiries, while the last section depicts that only 10 percent of those customers followed through the process and are ready to make a purchase. A pipeline funnel chart is similar to a standard funnel chart with a horizontal funnel.
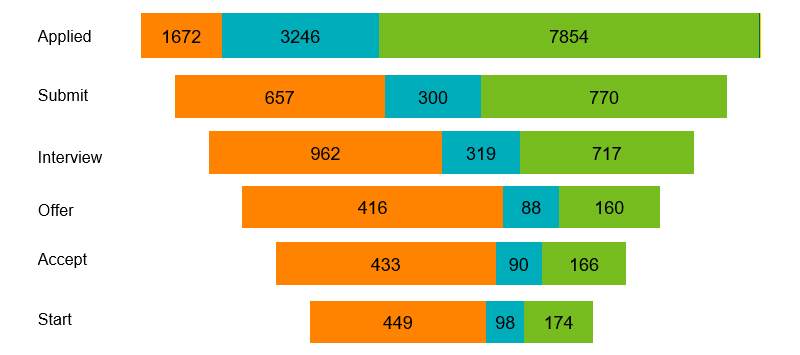
Example 3: Funnel Bar Chart
The funnel bar chart in this example graphically represents the recruitment and selection process. The people who applied for a job are in the top bar because of their number. Those who submit their CVs are lesser. There is a dropout in those who got a call for an interview. A lesser number of those applicants received a job offer. The number of those who accepted and started working is the lowest.
6. FAQ About Funnel Charts
1. How to use a funnel in marketing?
You can use a funnel chart template to nurture potential customers in marketing. Marketers use funnels to collect various leads and set target customers. They introduce their products in the first step. Next, they cultivate interest in them by telling them why they need those products. The customers then consider and show their intent to purchase the product. In the last step, they go through with the purchase.
2. What is a sales funnel chart?
A sales funnel charts illustrate the steps in the sales process using an inverted triangle. It represents the lead generation in the first step and completes the deal in the last step. The size of the first section in a sales funnel is the widest. The customers drop out with each step, and only those who commit to the sale remain to make the purchase.
3. When to use funnel chart?
You can use a funnel chart to visualize a linear process with at least four stages. Only use it when you are sure that the number of users, customers, or any other data type in the first step will be larger than the data values in the final step. Use it to evaluate the potential sales or customers and analyze track conversions.
7. Key Takeaways
A funnel chart visualizes the data flow in a linear process through regression of phases. It is commonly used in sale management to track customers and sales of products. Using sections of an inverted triangle, you can use it to track retention rates and possible deals in a reduction hierarchy order. EdrawMax Online is the best funnel chart maker that gives you free editable templates and a symbol library to make your chart. It also comes with many unique features and supports various document formats. Go to EdrawMax Online and get started right away. Find more funnel chart examples.