What is A Matrix Diagram with Example?
A matrix diagram is a management tool that is used to analyze and determine the relationship between data sets. This article will delve into the definition and usage of a matrix diagram. Along with classifications and how you can create a matrix diagram.
1. What is A Matrix Diagram
A matrix diagram is a management tool that is used to analyze and determine the relationship between data sets. Professionals and project managers deal with numerous projects, deals, and clients. These projects have multiple influencing elements that determine the trajectory of these projects. Matrix diagram helps project managers visualize these complex equations and relationships.
This diagram is a table that enables the analysis of data sets for improved decision making. It demonstrates the nature and intensity of the association amongst pairs of two or more sets of objects. The association is then illustrated in each cell by either a number or a symbol, where the two elements meet in the matrix.
1.1 The Usage of Matrix Diagram
Matrix diagrams can be used to define and evaluate the connections between two or more data sets.
Applications of a Matrix Diagram:
- Establishing the root cause of the problems;
- Specification of matching requirements;
- Assigning resources based on requirement or proficiency;
- To compare potential solutions;
- Identifying growth opportunities;
- Analysing how well requirements have been met;
- A collection of ambiguous and unmeasurable elements with a range of definite and measurable items (for example, linking consumer specifications to technical specifications).
1.2 The Classifications of Matrix Diagram
There are five basic classifications of matrix diagrams to suit various project management needs.
(1) L-Shaped Matrix
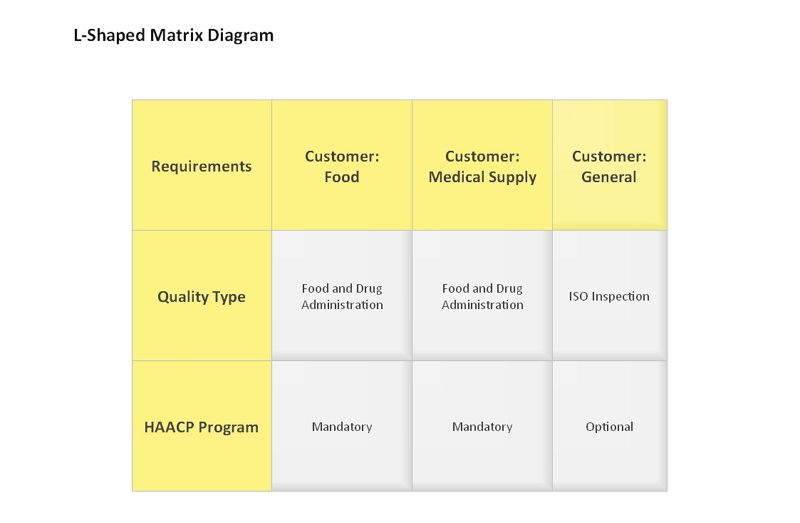
The L-shaped matrix chart is a two-dimensional diagram and the most common form of matrix diagrams. The purpose of this matrix chart to compare and analyse the relationship between two sets of data.
One set of data is represented in the left side column. And the second set items are listed at the top row column. Numbers or symbols can be used to illustrate the relationships between the intersecting cells.
(2) T-Shaped Matrix
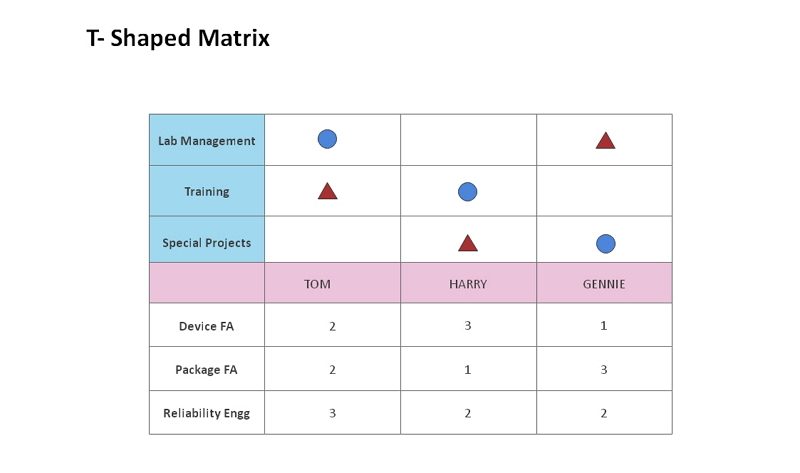
Essentially, a T-type matrix is the combination of two L-type matrices joined by a single list. There are three groups of items where group A is related to both group B and group C. But group B is not connected to group C. This matrix chart is used to analyse the relationship three factors with direct or indirect relationships.
(3) Y-Shaped Matrix
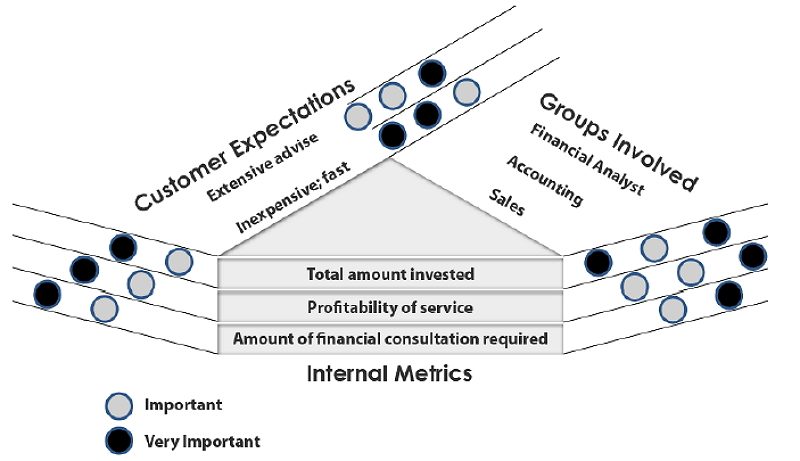
In a Y-shaped matrix, all three lists present are related to each other and exist in a circular flow. Here group A, group B, and group C are connected and related to each other.
This matrix chart is used when three tightly related lists are to be compared. Due to this chart being circular, all elements are interconnected.
(4) C-Shaped Matrix
Similar to a Y-type matrix, a C-shaped matrix also compares and analyses three sets of data of different lists. Unlike the Y-type matrix, a C-shaped matrix chart is not a circular flow but a three-dimensional cube diagram. When three types of lists have to be analysed simultaneously, a C-type matrix chart is the usual go-to.
(5) X-Shaped Matrix
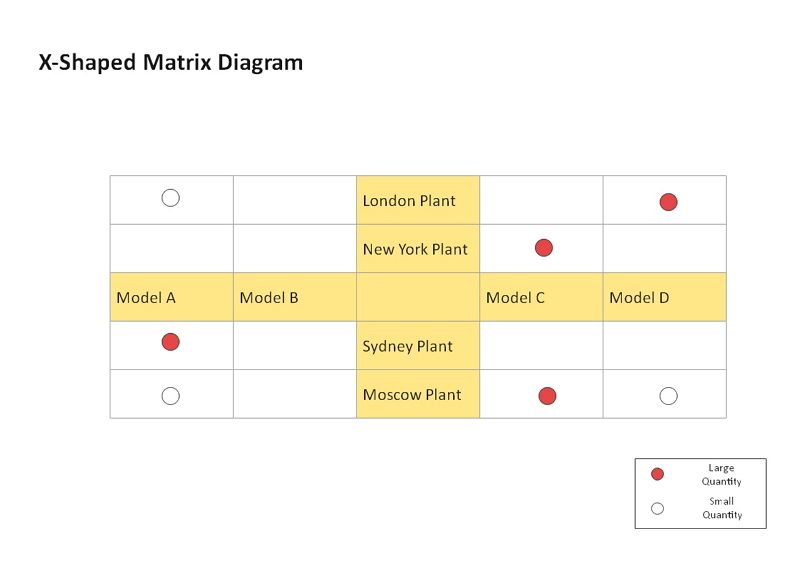
The X-Shaped matrix is a combination of four different types of L-shaped matrices. It is an extension of a T-type matrix chart and is used to compare two complementary sets of data.
Here, each axis of the matrix chart is related to the adjacent axis but not to the axis across it. Each group is related to two adjacent groups in a circular pattern.
| L-Shaped | 2 groups | A <---> B or A <---> A |
| T-Shaped | 3 groups | B <--> A <--> C but not B <--> C |
| Y-Shaped | 3 groups | A <--> B <--> C <---> A |
| C-Shaped | 3 groups | All three simultaneously |
| X-Shaped | 4 groups | A <--> B <--> C <---> D but not A <--> C or B <---> D |
1.3 The Process of Making A Matrix Diagram
Matrix diagrams help visualize complex problems. Here’s an easy six-step guide to getting you started in creating a matrix diagram.
Step 1: Create your purpose
Before you start designing your diagram, define the purpose of the matrix chart. The objective you aim for this analysis to deliver should be well-defined.
Step 2: Determine and collect the data sets
Identify and collect the data to analyze. Avoid any biases while collecting your data. And ensure that the data collected is right on the matrix chart and accurate.
Step 3: Choose a matrix type
Based on the data collected you can determine the appropriate type of matrix diagram you can use. Depending upon the objective and type of the data sets, decide on a matrix chart.
Step 4: Define a structure to compare data
In this step, you will determine the symbols you will use to compare the data sets. These can be on the basis of strength or other factors like influence or even responsibility.
Step 5: Analyse the data sets
This is a crucial step, methodically go through every cell and compare them. This step will help determine the relationship dependencies of the data sets.
Step 6: Review and draw conclusions
This analysis will help you draw conclusions. Based on the comparison you can draw a conclusion of the objective aligning with the comparison of data sets.
2. The Matrix Diagram Maker
EdrawMax enables quick and convenient drawing of a matrix diagram. You should use the predefined template specifically and just edit the content.
- EdrawMax has made a six sigma matrix template, reducing much manual operation and shortening the time taken to create a matrix chart;
- The interface of EdrawMax is intuitive and convenient to use with clearly labelled buttons;
- EdrawMax is extremely user-friendly and designed for maximum convenience;
- EdrawMax supports to export and import in multiple formats, including Microsoft Office, PS, Graphs, PDF, HTML, Visio and etc.
3. How to Make A Matrix Diagram in EdrawMax
There are mainly 5 steps to create a matrix diagram in Edrawmax with ease.
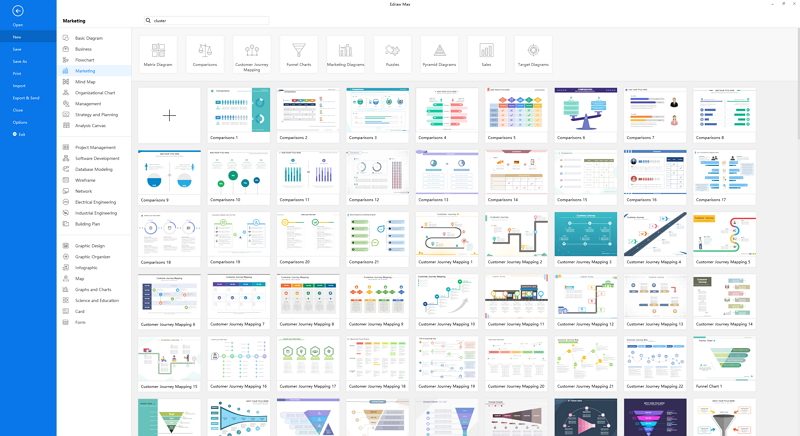
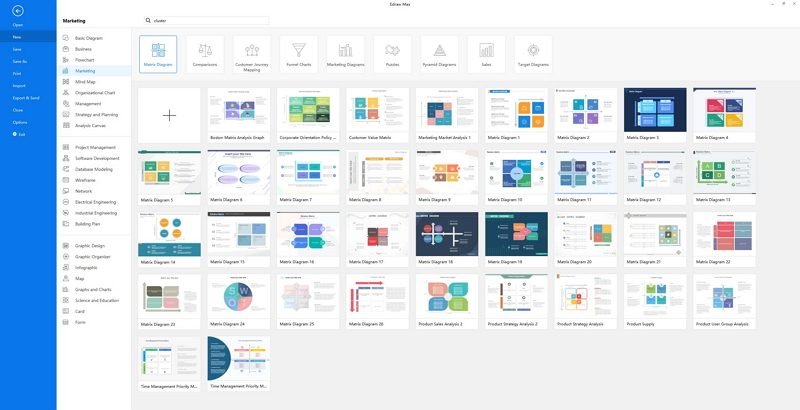
Step 1: Sign up the EdrawMax, then click on ‘Marketing’ in the left navigation panel, and the first option is a Matrix diagram.
Step 2: Choose the template you want to use for your matrix diagram.
Step 3: Customize your diagram according to your needs once the file opens.
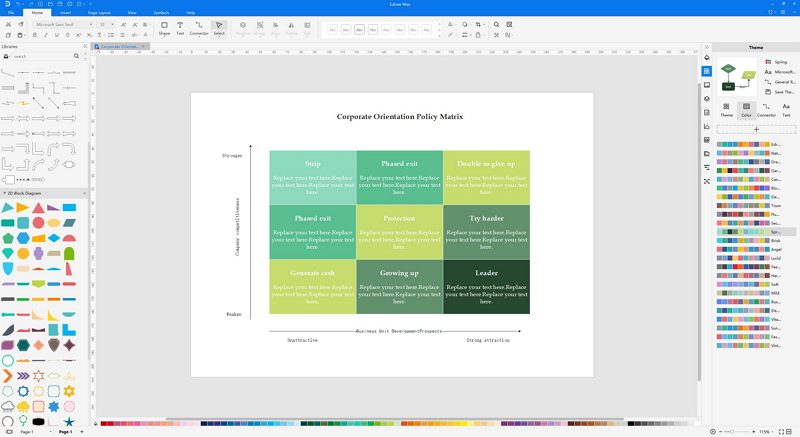
Step 4: Create your diagram and fill in your content.
Step 5: Save and export your matrix diagram when it’s ready, and even share to your friends on social media or email directly.

4. Example of The Matrix Diagram
There is an example of matrix diagram in marketing for influencing the business decisions.
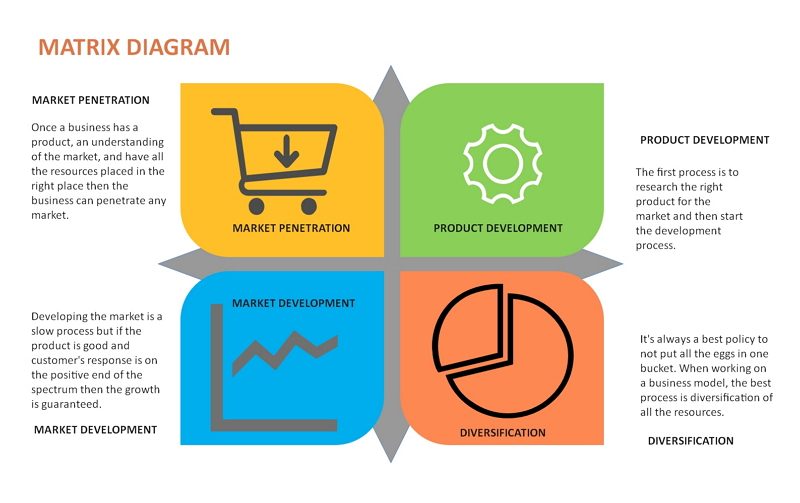
The above example illustrates key areas like market penetration, product development, market development, and diversification. This matrix chart helps analyse and compare different aspects. When doing the marketing analysis, the matrix diagram can greatly help to improve the process making and the each decision while encountering the problems.
The market penetration matrix diagram illustrates how the market, product, market diversification and development could influence the business to some degree. Furthermore, it is crucial to strengthen business from these four aspects accordingly.
5. Summary
A matrix diagram is an analysis tool that provides a compact way to represent many-to-many relationships of different strengths. It is primarily used for decision making by considering key factors that are converted into data sets. This diagram is versatile in nature and is used by many managers and engineers to make key decisions. With EdrawMax, it is easier to create Matrix diagram by simply choosing a built-in template and keep editing until you are satisfied.


