What Is PERT Chart
A PERT chart is a project management tool used to determine a project’s timeline with graphical representation. It analyses a project by breaking it down into individual tasks. Here, you will find everything you want to know about PERT charts. Learn how to create these charts, their uses, benefits, and check out their templates.
1. What Is a PERT Chart?
PERT Charts are like flow charts or network diagrams that exhibit all the tasks of a project in separate boxes, and connectivity is shown with the help of arrows to show task dependencies clearly. In comparison to Gantt charts, PERT Charts are preferable as they help identify task dependencies, though they are not easy to interpret. Project managers utilize PERT Chart to analyze project tasks and estimate the time required to complete each task in a project. In this way, a minimum amount of time can be calculated to complete a project.
The information gathered from the analysis of a PERT Chart helps the project manager develop the project's budget. The information is also helpful in determining the resources required to complete a project. A PERT Chart is represented with the help of circles and rectangles, which are referred to as nodes. These nodes are the representation of project events or milestones. Lines or vectors connect the nodes and represent the tasks involved in a project.
Click on the image to edit. Source: EdrawMax Online
2. How a PERT Chart Works?
A PERT Chart visually represents a project's tasks and clearly depicts the inter-connected dependencies. Before initiating the project, an initial schedule and estimated timeline can be created, which can be shared with stakeholders. Several project planning activities can be accomplished with the help of the PERT Chart. A PERT Chart allows the following activities.
- Get schedule and timeline of the project
- Communicate the project goals to stakeholders
- Complex projects can be visually mapped
- Estimation of time needed for completion of individual tasks.
It is essential to understand the steps involved and the visual mapping of the PERT diagram to make an effective PERT Chart.
3. Benefits of PERT Chart
Planning of complex projects can be done easily by managers with the help of a PERT Chart. These charts represent the real-time schedule of any project by illustrating its activities and processes in a hierarchy. It helps project managers showcase the interrelation between activities and their priorities.
Incorporation of Data and Information is done during PERT analysis. The information from all the departments is gathered, which encourages the department's responsibility and helps identify responsible individuals all across the organization. This promotes communication during the course of the project and helps make organizations succeed.
What-if analyses are fairly done with the help of PERT Charts. Management can follow the most efficient path and make the best decision by viewing the flow of project resources.
4. What is a PERT Chart Used For: When to Use it?
- Determining critical path: Finding a critical path is one of the unique aspects of a PERT chart. The critical path determination in the PERT Chart is used in Project Management.
- Evaluation of resources: Managers use PERT Chart in Project Management to evaluate resources. PERT Chart depicts tasks that require resources and which do not. The information is transparent and accessible for the managers and the stakeholders.
- Evaluation of Time: The PERT diagram gives a concrete estimation of the time required for individual tasks and the overall project duration. This feature is very useful as it depicts the expected timeline and is helpful for managers at the time of the initial project planning phase.
In a nutshell, PERT diagrams are easy to understand and create for simple projects. They are a quick way to denote a project's resources and timelines.
5. How to do a PERT chart?
A PERT diagram showcases the timeline, resources, and overall project flow. You can easily create PERT diagrams using templates. After picking a suitable template, follow these steps to create a PERT chart.
- STEP 1: Decide the template and draw the nodes, either squares or circles. Every node depicts an event or a milestone of a project. You must decide the major milestones of the project at this step.
- STEP 2: Use directional arrows to depict tasks that need to be completed before the management can move on to the next task. These tasks have dependencies on previous events or milestones. The tasks need to be completed in a sequence.
- STEP 3: Use divergent arrows to represent those tasks that can be done simultaneously or in parallel with any other task. Such tasks do not have dependencies on previous events.
- STEP 4: Set up a timeline for each event or milestone. Along with each arrow, it is required to write a number that depicts the number of days required to complete the task.
Watch this video to learn more. If the video doesn't play, please visit it at YouTube.
After you understand the logic of creating a PERT chart, the next step is to get started quickly with a PERT chart Maker. Using a PERT chart is easy, and drawing it on a template may not be very challenging. You can create a PERT chart with EdrawMax Online by following easy steps. Follow these steps to make a PERT chart on EdrawMax in a few clicks.
- STEP 1: Log in to EdrawMax Online or create a new account.
- STEP 2: You can use a template or open a blank canvas to create your PERT chart from scratch. Navigate to education and click on the General category. Select flowchart to see the list of templates. Pick a template or click on the "+" button.
- STEP 3: The next step is to customize your template or draw your diagram if you are working on a blank canvas. You can use various customization tools and unique features to edit your diagram and add colors and themes. Use the simple click and drag to get symbols and icons from the library. Add lines and connectors to showcase the relationship between elements.
- STEP 4: After your diagram is complete, the next step is to download it. EdrawMax Online supports various document formats, so you can export in any format you want. You can also share and print it.
6. PERT Chart Templates
The PERT Chart templates can be very helpful as they save a lot of time and add a professional look to the diagram. You can get a professional template, edit it on EdrawMax Online and customize it according to your needs. This will take a couple of minutes, and the result will be just according to your desire. Check out these free PERT Chart templates, pick the one you want, and get started.
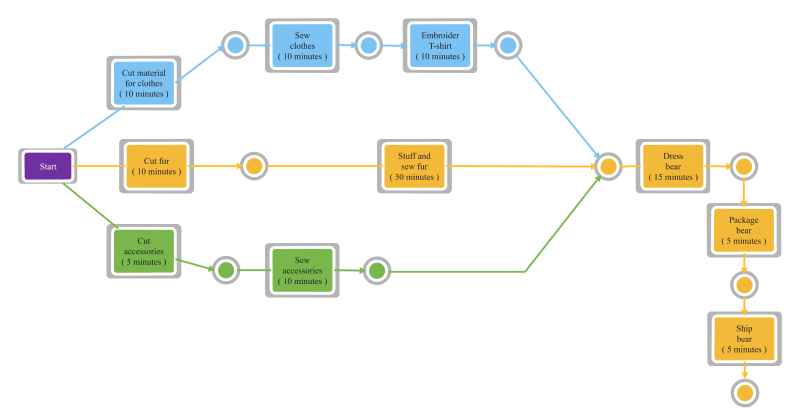
Example 1: PERT Chart Example with Critical Path
In the Toy Production PERT chart, the complete process of production and advertising a toy is shown. In this PERT Chart Example, depiction of task, duration, and dependency is done. The identifiers or the names show the tasks. The number of people assigned, duration, and the initials of personnel assigned are shown. In this example, the critical path is the path that has no extra time available. It is also possible that multiple critical paths are present in one diagram.
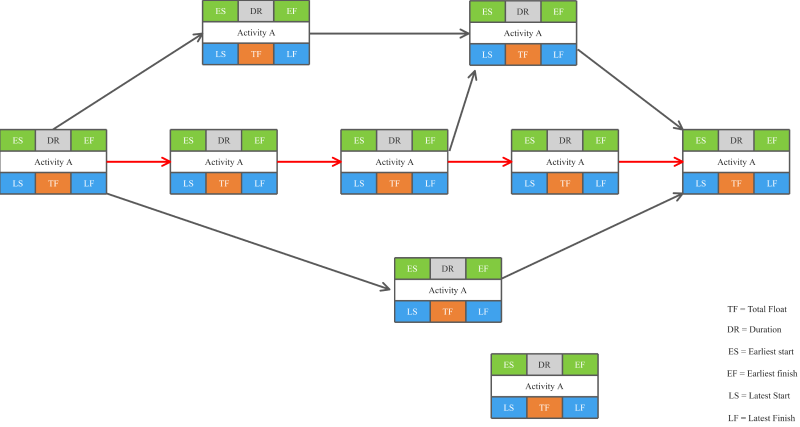
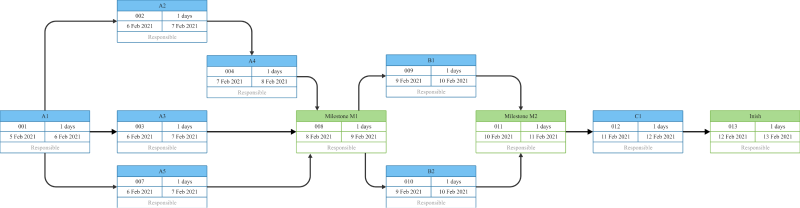
Example 2: Example of PERT Chart
This PERT chart example depicts the process A1 that is initiated on day 1. The diagram shows the program evaluation and how the project moves forward for the subsequent days and processes. In this PERT chart example, PERT calculates a weighted average found by using a simple formula. EdrawMax Online allows users to find the best way to create PERT charts for any project.
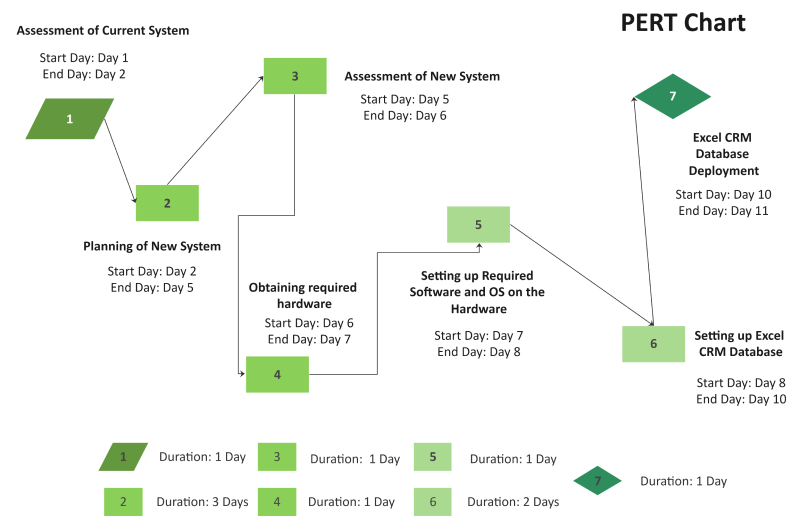
Example 3: PERT Chart Template
In this PERT Chart Example, quick visualization of the project is shown for the engineers. The creation of visuals can simplify the work for engineers. For instance, the creation of ER diagram to assess the database and P&ID for process design, PERT chart for the management.
7. Gantt Chart vs. PERT Chart
In general, PERT Chart and Gantt Chart are similar as both provide graphical views of a project's events, timelines, and schedule. However, they do possess several differences, which are enlisted and described below:
- Gantt charts are created by drawing bar graphs along the timeline; Horizontal bars are used for representing the estimated timeframe. On the other hand, PERT Charts are created like a free-form diagram. Boxes or circles denote the events, and arrows are used to connect them.
- PERT Charts depict the dependencies and show an inter-connectivity of the events or milestones. In Gantt Charts, bars do not show dependencies, and rather they are stand-alone.
8. FAQ about PERT Chart
1. What does a PERT chart reveal?
PERT Chart helps managers analyze the tasks and the estimated time required to complete each task. PERT Charts depict the required resources and dependencies among project phases or events. With the help of the PERT Chart, the manager can get a clear idea about the minimum time required to complete a project.
2. What is the purpose of a PERT chart?
The PERT Chart is used as a tool by the Project managers to organize, schedule, and illustrate the tasks in a project. Its main purpose is to provide a flow of the project with the timeline's depiction and break down individual tasks.
3. What is the critical path in the PERT chart?
The three common types of dichotomous keys are the nested, linked, and branched dichotomous keys. In the nested type, we get the answer of each statement nested right next to it. In the linked types, we use lists of text to identify objects. We use a tree diagram to make the dichotomous key in the branched type.
9. Key Takeaways
We use PERT Charts for creating a visual project flow diagram. They are like flow charts or network diagrams that exhibit all the tasks of a project and show connectivity between project stages and help identify task dependencies. Managers often use PERT diagrams for analyzing the estimated time and resources involved. As the charts are made, they are easy to understand by the stakeholders, and a budget analysis can be done. EdrawMax Online is one of the best PERT maker as it enables users to use professional templates and customized tools. Find more PERT Chart examples.