How to Make a Bar Graph with Step-by-Step Guide
Create a Bar Graph on Edraw.AI Online Free Free Download Free Download Free Download Free DownloadWhat is a Bar Graph
A bar graph or a bar chart is used to represent data using rectangular bars of different heights and different lengths. The graph is represented either horizontally or vertically. Mainly the bar graph is used to show or compare the changes in something over the time.
Components of a Bar Graph
- Title: The title of a graph gives users a short explanation of your graph.
- Axis: Bar graphs have two axes, which are X-axis and Y-axis. In most of the bar graphs, X-axis runs horizontally and Y- axis runs vertically.
- Data: The most important part of the graph is the information or the data, based on which the bar graph is plotted.
- Legend: The legend helps users to understand what they are looking at on the graph. These are the small descriptions of the graph, which makes the graph easy to understand.
Types of Bar Graph
· Horizontal bar graphs
This is an effective way of presenting data when there are a large number of different categories and there is insufficient space to fit all the columns required for a vertical bar chart across the page.
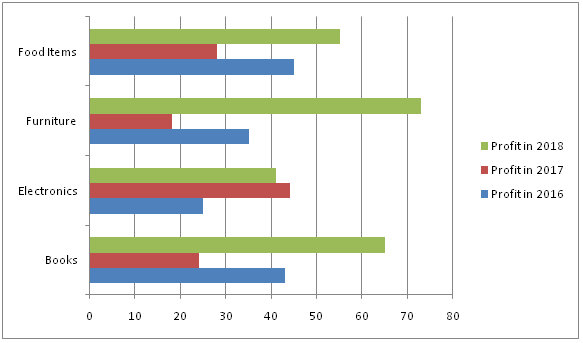
· Grouped bar graphs
This is a way of showing information about different sub-groups of main categories. A separate bar represents each of the sub-groups and these are usually colored or shaded differently to distinguish between them.
· Stacked bar graphs
This is a way of representing sub-groups on top to make a single column, or side by side to make a single bar. The overall height or length of the bar shows the total size of the category shown in different colors.
When to Use Bar Graphs
- Bar graphs are used to compare data between different sets of groups and track changes over time.
- It is best to use when the changes are very larger e.g. in terms of years.
- By using multiple bar graphs, multiple data types can be shown in single graph, which changes over time.
How to Make a Bar Graph Easily
How to create a Bar Graph? You can simply follow the below steps to make a bar graph easily using EdrawMax Online.
Step 1:
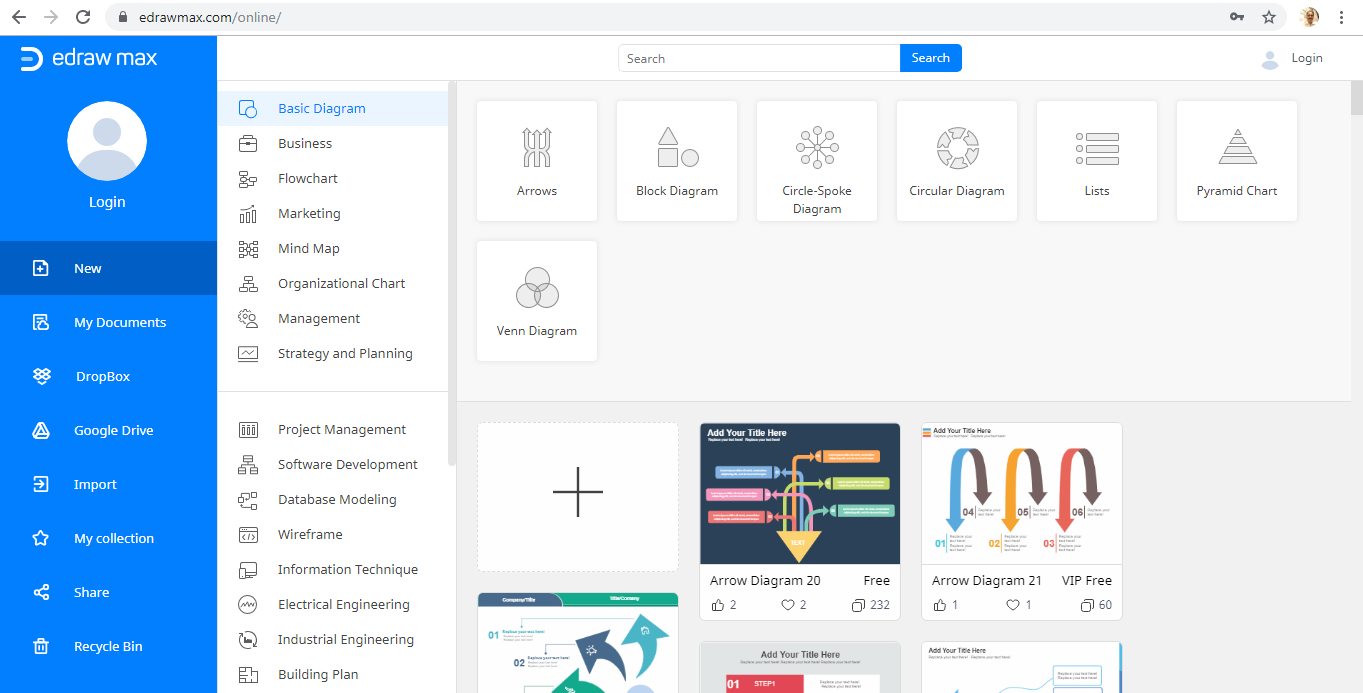
EdrawMax Online provides the easiest way to create your customized graphs. Let’ s get started by clicking on this link below:
https://www.edrawmax.com/online
After signing in, you will be redirected to the home page of Edraw, where you can view various types of diagrams and charts listed on the screen with pictures.
Step 2:
Scroll down to the Graphs and Charts section and click on it. You will get all kinds of graphs shown on the right side of the page.
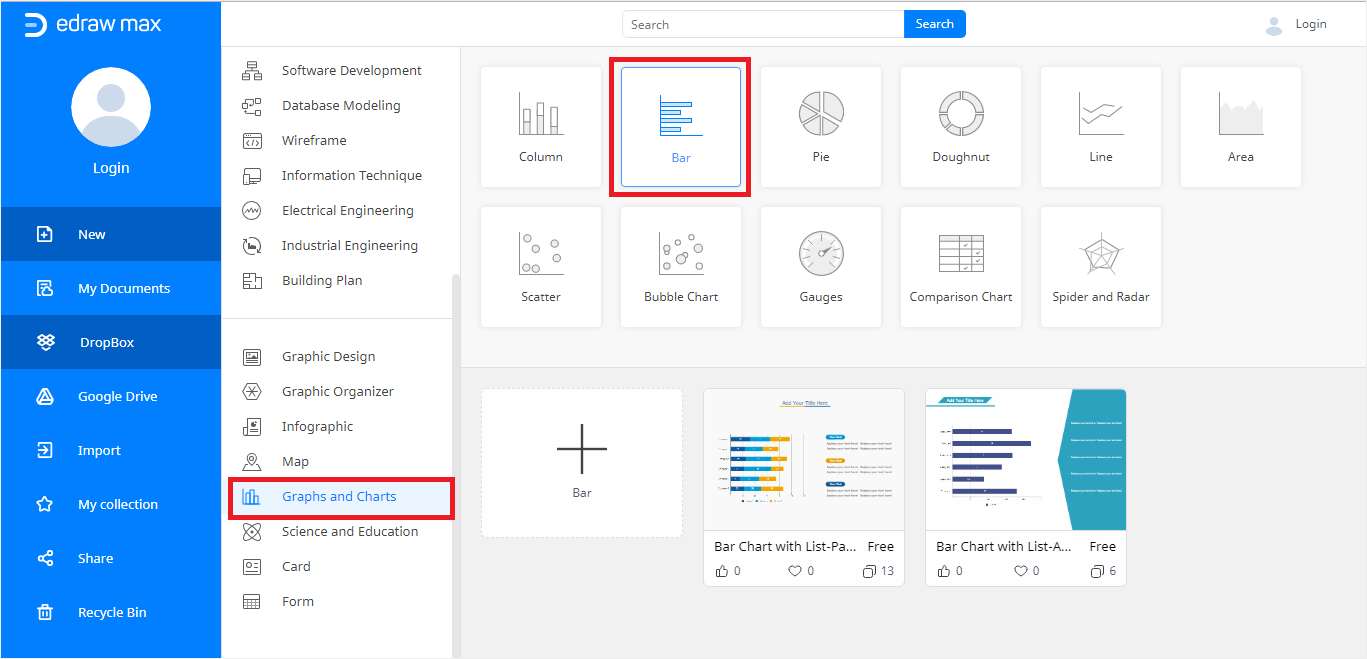
Step 3:
Select the Bar Graph and you will have the option to select templates
Step 4:
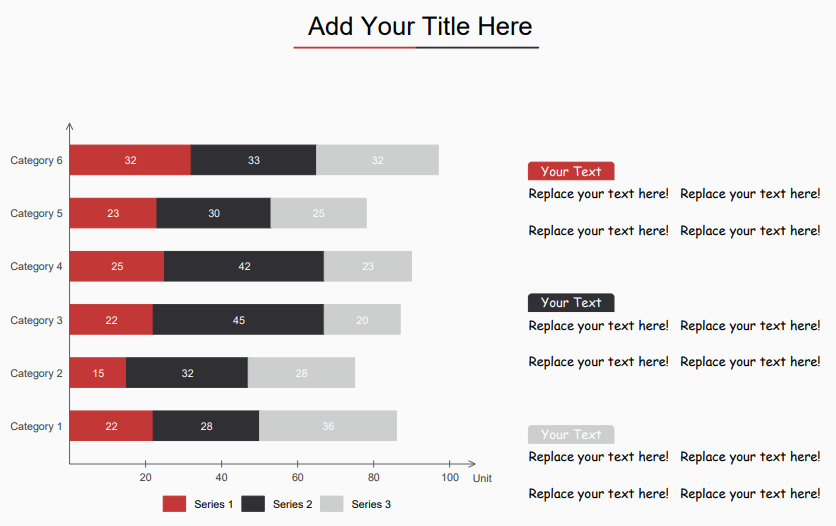
- Select a template of your choice and you will be redirected to a bar graph creation page where shows sample bar graphs and sample text for the legends that can be replaced. It is available only in EdrawMax Online.
- The first template i. e Stacked Bar Template is very impressive and eye-catching for views to see all differences in one glance.
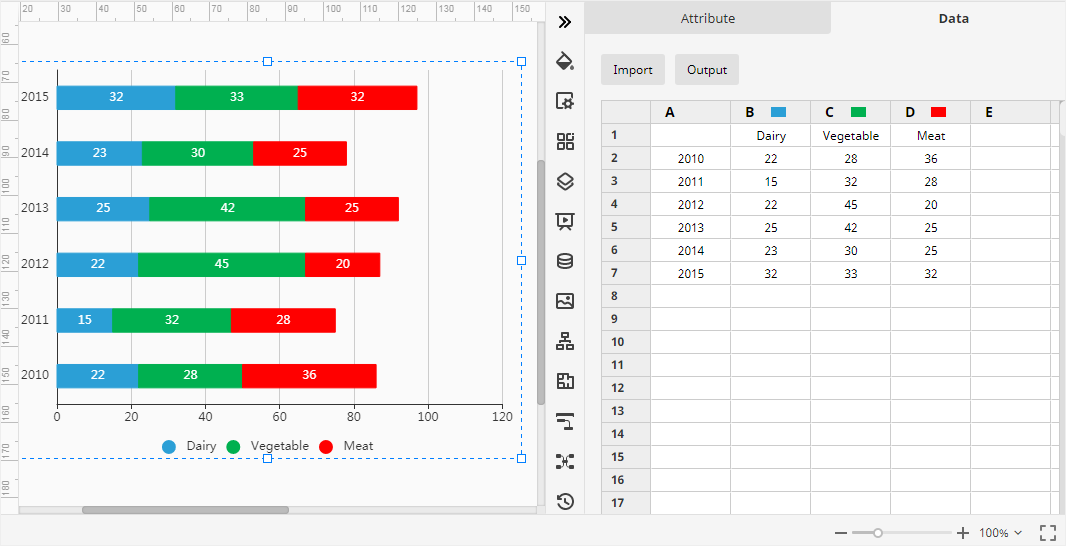
- Select the bar graph and navigate to the Chart (Data)
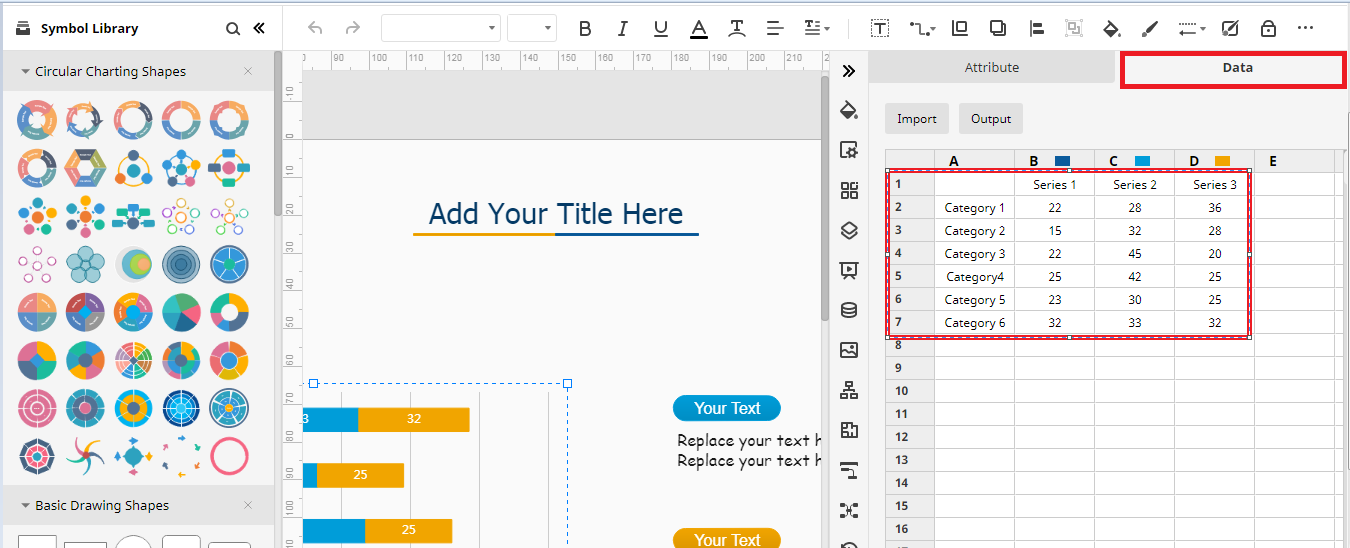
- You can add data manually into the sheet on the right side so that the graph will change and get shaped accordingly.
- However, you can also use the Import button to browse the local files from your system, which has data in the required format to make a bar graph online.
- Customize your bar graph by giving different colors to the bars and any number of rows and columns.
Once it is prepared, you can download the same bar graph by clicking on the download button.
Step 5:
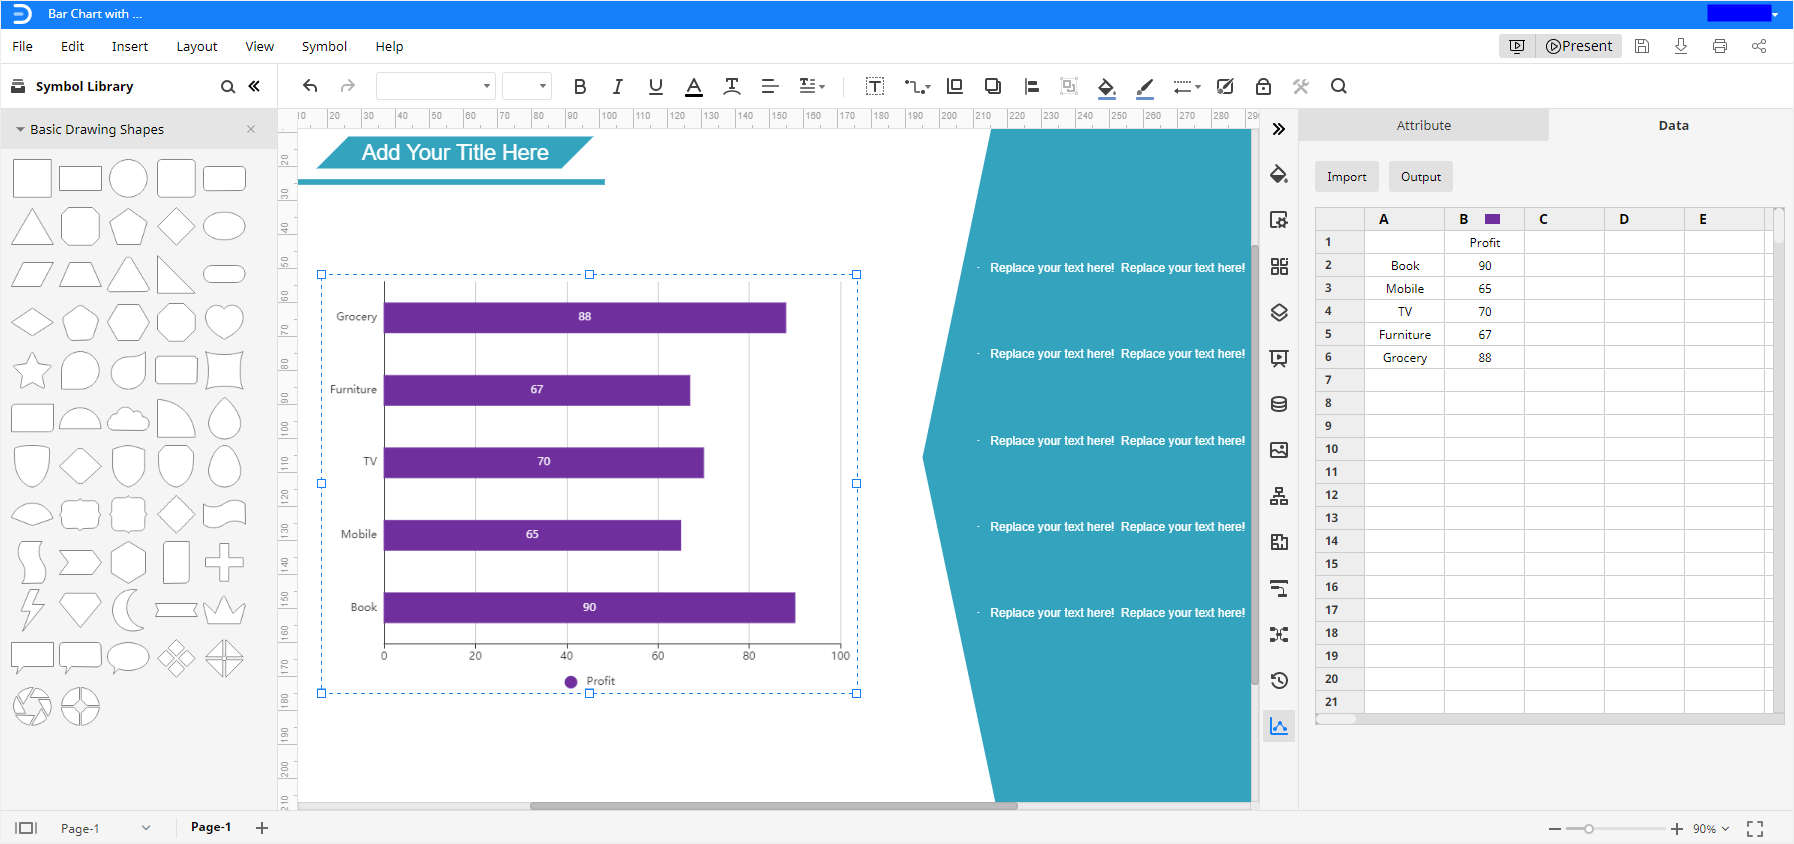
Repeat the same process for the Comparison List template available on EdrawMax Online. This template provides a free customizable comparison list from which you can easily decide by looking at the comparison presented in the chat.
Free Bar Graph Templates
· Stacked Bar Chart Template
This kind of template is used to represent data using horizontal bars and distinguish different categories in the same bar with different colors.
· Comparison List Template
This bar graph shows different categories of data in different bars which makes users easy to compare the data changing over time.
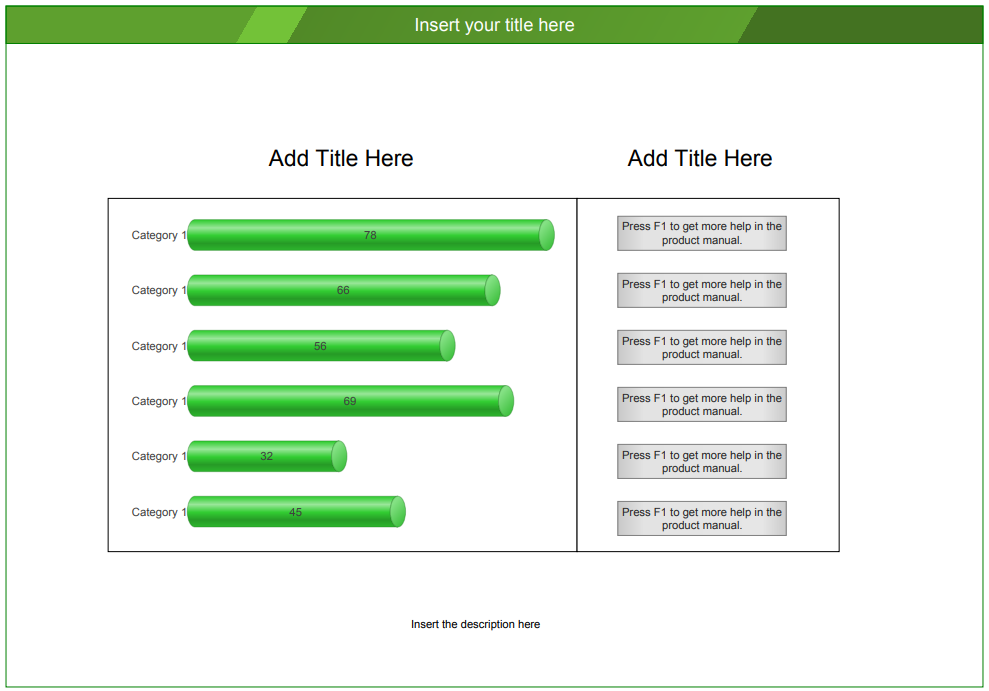
· Infographic Bar Charts Template
This kind of graph represents horizontal and vertical bar lines in different percentages of progress. You can customize the graphs with various colors or sizes as per your requirement.


