How to Create a Data Flow Diagram in PowerPoint
It’s important for a business to show the flow of data clearly in its information system. This article will walk you through how to create simple data flow diagrams in PowerPoint. We also would like to recommend a powerful and easy-to-use diagramming tool called Edraw Max to help you create complicated data flow diagrams.
How to Create a Data Flow Diagram in PowerPoint
What is A Data Flow Diagram?
A data flow diagram (DFD) shows the flow of the data through a process or a system. DFDs are set to use standardized symbols and notation to represent data inputs, data outputs, data storage and data flows.
DFDs are usually divided into logical DFDs and physical DFDs. The logical data flow diagram describes what happens in the flow to perform certain functions of a business. The physical data flow diagram describes the implementation of the data flow in the system.
Data flow diagrams can be categorized by levels. DFD levels are numbered 0, 1, 2, and sometimes increase to level 3 or above if the data flow diagram is extremely complex and detailed. You can also expand sub-processes as 1.1, 1.2, 1.3, etc. The level 0 DFD is also called a context diagram, which is the most basic data flow diagram and contains few details.
5 Steps of Creating A DFD in PowerPoint
a. Find a suitable template
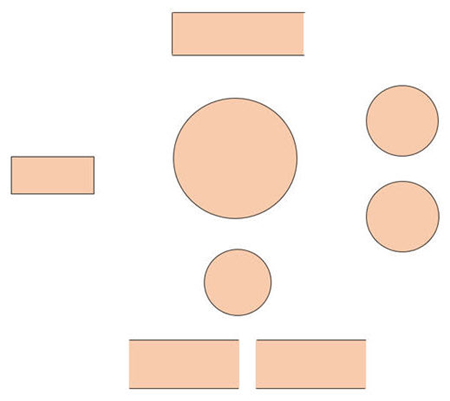
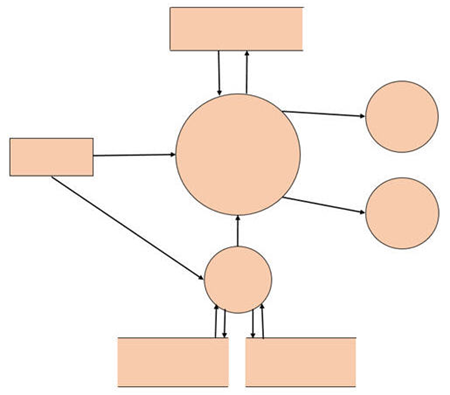
As there is no available data flow diagram template in PPT, you have to use basic shapes in the program to replace the essential symbols and notation in DFDs and make a data flow diagram.
- Rectangles representing the External Entities, which are the sources or terminations of data.
- Circles representing the Processes, which are the activities that changes or transforms the data flow.
- Open-ended rectangles representing the Data Stores.
- Arrows representing the Data Flows.
If you don’t have no idea about how to draw data flow diagrams from scratch, you can find a DFD template on the Internet and then build your own data flow diagram by imitating the template.
b. Add shapes
Go to Insert tab, click Shape, or click the shape gallery on Home tab, choose the corresponding shapes in the drop-down list and add them onto the page.
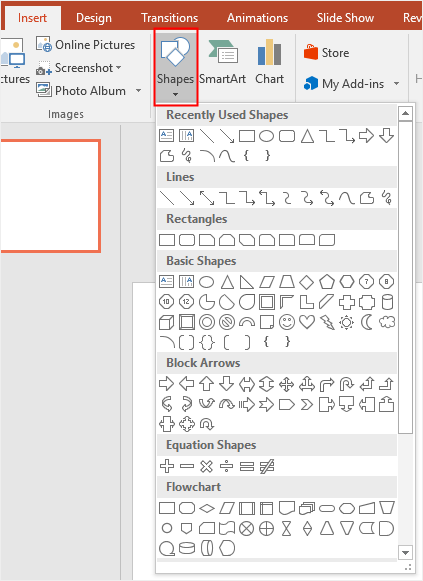
The one-side and two-side open-ended rectangles for data stores are not the pre-made shapes in PowerPoint, so you have to create them by yourself.
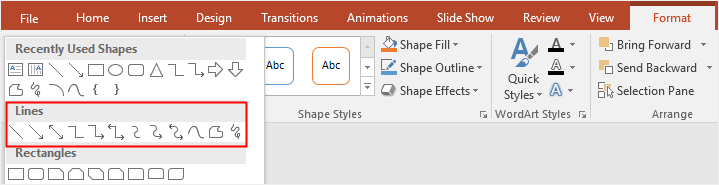
c. Add lines
After adding shapes to build the main structure of the data flow diagram, you need to add connector lines to indicate the relationships between these shapes.
Find the shape gallery in Home tab, Insert tab or Format tab, click Arrow symbol to add lines into the diagram.
d. Add text
To add text on the data flow diagram, there are 2 different ways:
To add text on the shapes, you can click the shapes and type text on them directly.
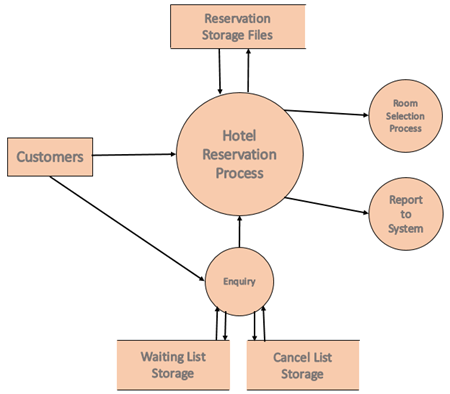
To add text on the lines, you need to insert text boxes on the lines and then type text in the text boxes.
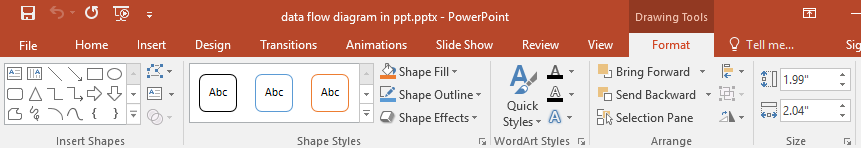
e. Format a DFD
Once you make a basic data flow diagram, you can format the shapes, text and connector lines with the format options in Word.
The format options lie in the Format tab. The Shape Styles option is for changing the shape styles, like shape fill, shape outline colors and shape effects. The WordArt Styles option is for changing text styles, including text fill, text outline colors and text effects.
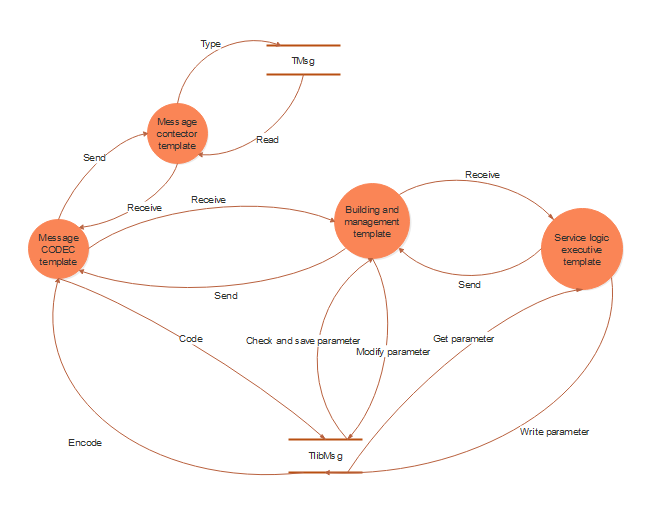
How to Create a Data Flow Diagram in Edraw Max
Making a data flow diagram in PPT with the four basic symbols will cost much more time and effort in building the diagram structure if the data flow diagram is going to show a lot of details. It also requires some additional steps to finish the complete diagram.
Compared with that, the professional diagram creator -- Edraw Max -- will give you great help. No more need to consume extra time in doing preparation and with plentiful pre-made templates and various symbols for different types of diagrams, Edraw Max can help you create data flow diagrams with less effort and better quality.
The steps of creating a data flow diagram in Edraw Max:
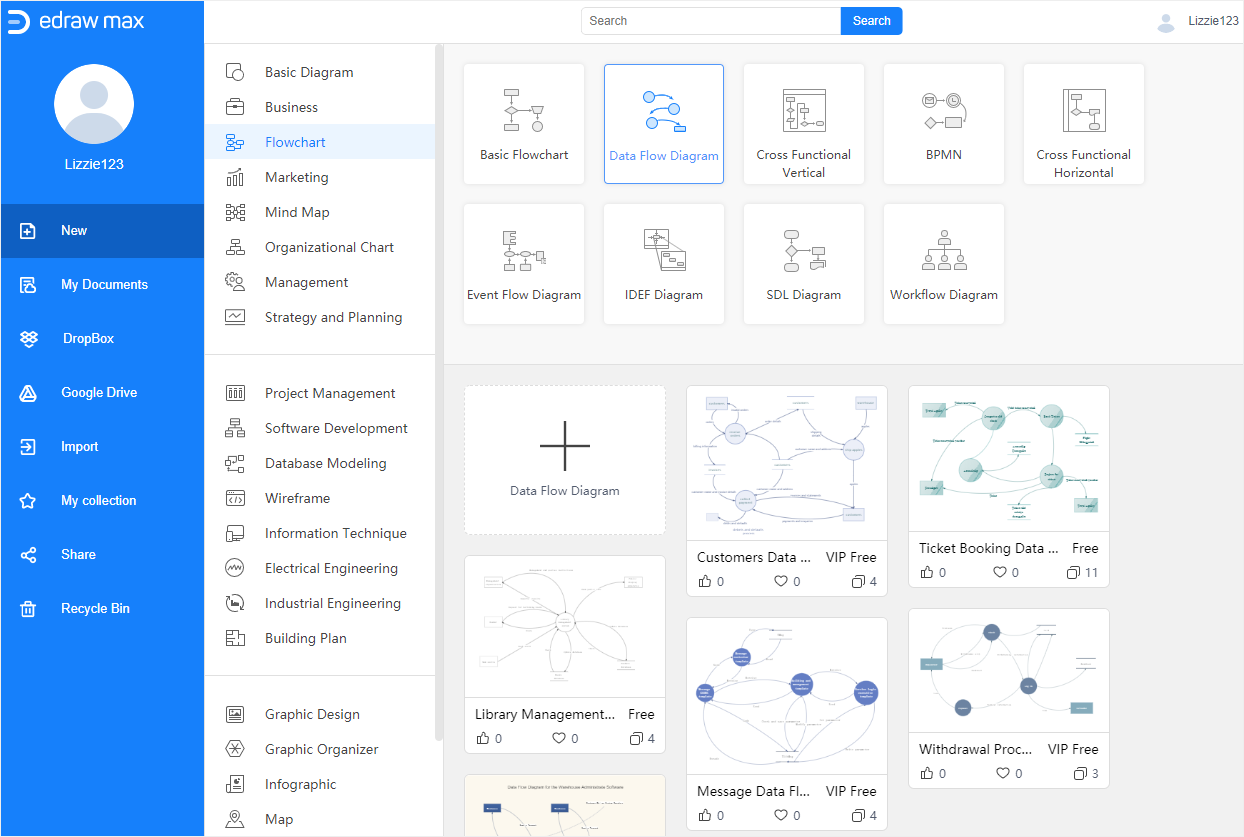
- Enable Edraw Max and select a desired data flow diagram template in the Flowchart gallery.
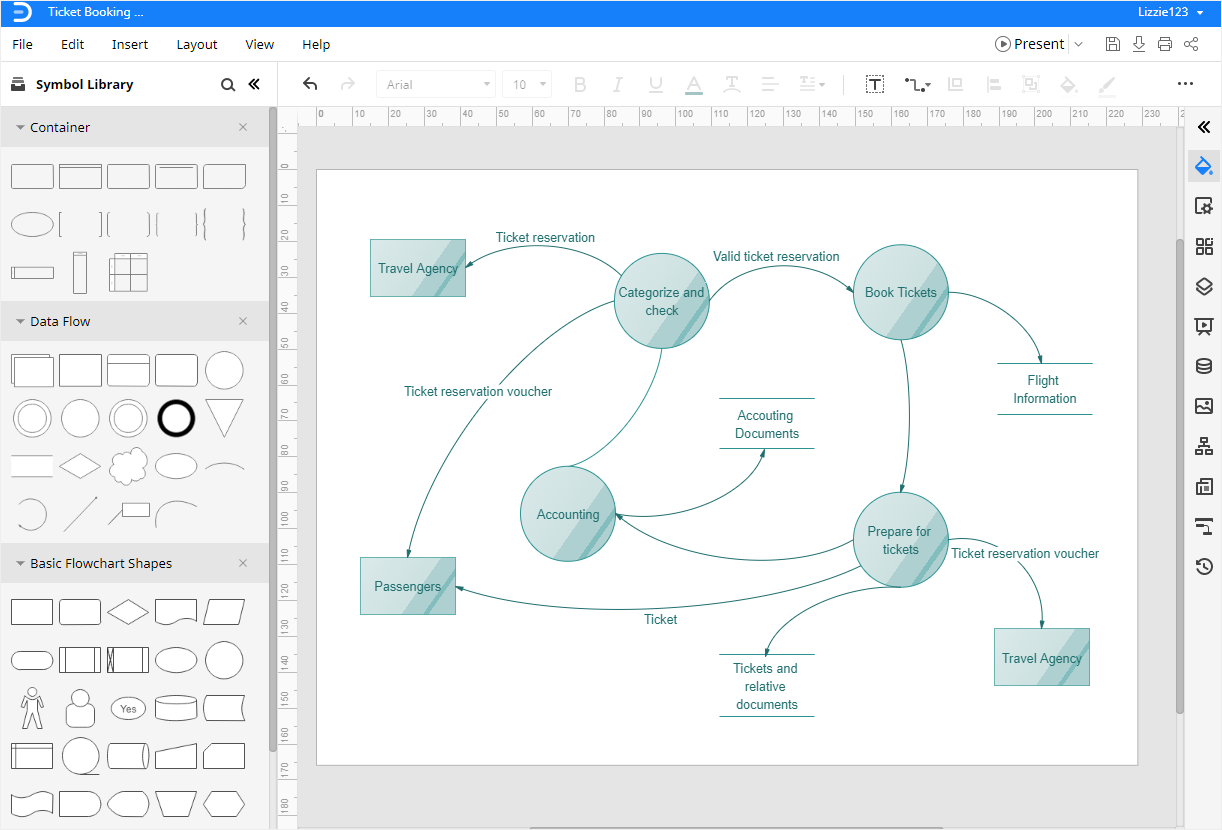
- Double-click the template to enter into the drawing interface and you will see the symbol library will pop up on the left side so that you can select anything that you need and add it into the diagram.
- Modify and customize the template to create your own DFD with easy-to-use drawing tools and abundant symbols.
- Save and export the data flow diagram in PowerPoint format or other common file types.
How to Save an Edraw Max diagram as PowerPoint File
When you finish making a data flow diagram in Edraw Max, you can choose to save or export the Edraw Max document in PowerPoint format.
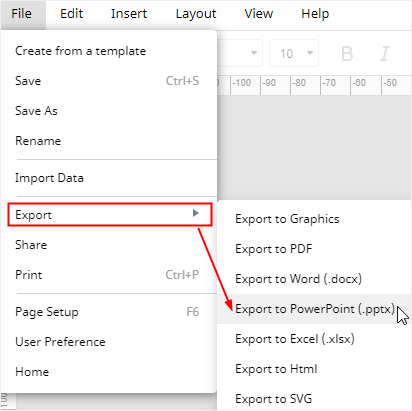
Go to File tab, click Export > Export to PowerPoint, and the system will automatically save and download the created data flow diagram as a PowerPoint file. So you can get a data flow diagram in PowerPoint format. All the Microsoft Office files exported from Edraw Max are editable.
Besides, you can also export the finished Edraw Max diagrams in many other common file types, such as graphics, PDF, Word, Excel, HTML and SVG. It will be much more convenient for you to share and transmit your designs and diagrams with colleagues and friends if they don’t use Edraw Max.