What is The Entity Relationship Diagram (ERD)
Create a Online Free Free Download Free Download Free Download Free DownloadIf you are related to database management or software engineering, then you might already be aware of ERD. It stands for Entity Relationship Diagram and lets us create a visual representation of different linked entities together. Since we can even establish the relationship between numerous real-world entities, it makes ER diagrams extremely popular in data modeling.
To come up with a well-structured database, it is important to have a foolproof Entity Relationship design at first. Let's get to know what is an Entity Relationship Diagram in detail and how to create one using a professional tool.
What is an ER diagram?
As the name suggests, an ER diagram depicts the relationship between two or more entities. This could be real-world entities or entity sets of a database. The model helps us build a logical structure of the database or the overall connectivity in software development. Ideally, an Entity Relationship Diagram looks like any other flowchart at first. Though, there are specific symbols and properties that set them apart.
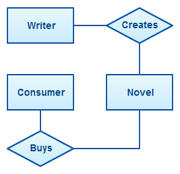
There are different levels of ER diagrams that are used to depict the conceptual, logical, and physical dependencies between different entities. Therefore, these diagrams can range from a simple to a complex structure. For instance, this is a simple ER diagram that describes the relationship between entities like writers, novels, and consumers.
How ER diagram was created?
Although ER diagrams are now used for a wide range of applications, they were first associated with relational database. It was in 1971 when Peter Chen came up with a uniform model to draw a relationship between different entities in a database. The concept was conventional to relational database at that time. Later, in 1976, he published a paper defining the concept in terms of relational database and exploring different layers of the representation.
When to draw ER diagrams?
Since their inception, ER diagrams have come a long way. These days, an Entity Relationship Diagram can be used to depict the co-relation between any two or more objects (apart from database). Here are some of the common scenarios where an ER diagram can help you.
- It can be used to provide a graphical representation of a database model.
- You can use an ER diagram to identify the common entities in a system and depict how they are related to each other.
- You can break down the conceptual, logical, and physical model of a database.
- It can also help you further explore the tables stored in your database with respect to their attributes and relationships.
- Whenever you wish to provide a blueprint of the database or its graphical representation, an ER diagram would come handy.
- Apart from database or software development, ER diagrams can also be used to depict real-world entities and draw relationships between them. This can be used in IT, management, design, and almost every other sector.
Basic Concepts of ER Diagrams
Now when you know what is an Entity Relationship Diagram and its history, let’s get into details. Ideally, there are 4 major concepts of an ER diagram that you should be aware of – Entity, Attribute, Relationship, and Cardinality. Let’s discuss them one step at a time.
An entity is the backbone of an ER diagram that consists of any object, concept, event, place, etc. stored in the database. It can also be a physical thing that can be manifested in our database. Ideally, it should be distinctively recognized in the database via its characteristics (that are known as attributes) and a unique key. It is represented as a rectangle in an ER diagram.
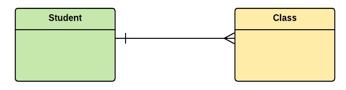
For instance, an employee, a student, a car, a building, a course, or an action could form an entity. When several entities are combined together by sharing common attributes and values, they become an entity set. Consider Students in a university as an entity set of various individuals. They are enrolled in a Class, which can be another set of different classes.
Entities can be weak or strong. A weak entity is the one that does not have its own primary key and relies on any other entity for its unique identifier.
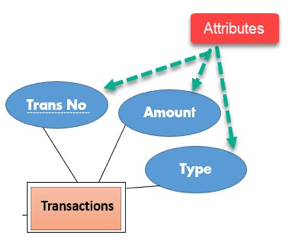
Attributes are used to explore an entity by defining all kinds of characteristics related to it. Mostly, it is a single property that explores an entity, letting us know the kind of data stored in it. In an Entity Relationship Diagram, an attribute is depicted by an ellipse and is linked to an entity directly.
Consider an ATM transaction as an entity. Now, it can have different attributes like the type of transaction, amount, transaction id, etc. Each of these attributes will have their distinctive values corresponding to the entity.
On the basis of their complexities, there can be 4 different kinds of attributes:
- Simple – It features an atomic value and can’t be further derived (like a transaction id)
- Composite – It consists of several values and can be broken down further (like name into a first and a last name)
- Derived – It does not exist in the database but its values are derived from other attributes (like age being derived from the date of birth)
- Multivalued – It depicts an attribute that has more than one value (like an individual can have more than one email ids)
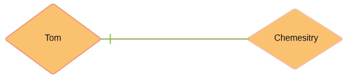
A relationship defines how two or more entities are connected to each other. They are used to identify which entity depends on other entities in a database. For example, consider Tom and Chemistry as two entities that are linked with a relationship that depicts Tom studies Chemistry.
Cardinality is a vital component in any Entity Relationship Diagram that explores the link of the attribute in the relationship. That is, it helps us explore how two or more entities are linked to each other. There can be different types of cardinalities in an ER diagram.
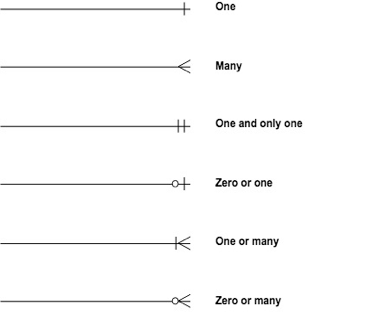
Entity Relationship Diagram Symbols
After understanding the major concept of an Entity Relationship Diagram, you are all prepped-up to draw a model on your own. To do this, you need to know how to depict every important component in an ER diagram.
• Rectangle: Used for an entity or an entity type

• Diamond: This represents the relationship between different entities

• Double rectangle: Represents a weak entity

• Double diamond: Depicts a weak relationship

• Double Ellipse: Defines a multi-valued attribute

• Ellipse with a line: This is used for a primary key attribute

• Lines: They simply link relationships with entities or entities with attributes
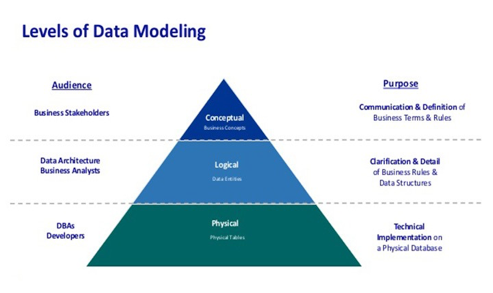
3 Main ER Data Models
An ER diagram can depict the overall structure of the database in the three common hierarchal ways.
It provides the overall reference of the database with all the master sets. Its purpose is to give the basic structure of the database and lay it down into different logical models.
This is a more detailed version of the conceptual level that consists of operational and transactional details apart from master data. It is also focused on the relationship between different entities.
This is the most detailed model of the diagram that closely relates to how the database has been created. It consists of database tables, unique keys, foreign keys, indexes, relationships, etc. that can reconstruct an entire database.
Entity Relationship Diagram Examples
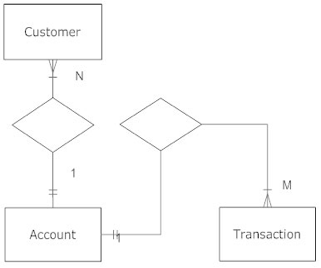
To further understand what is an Entity Relationship Diagram and how they are created, let’s consider these three examples.
Let’s start with the simplest case of an ER model. This ER diagram has three major entities – customer, account, and transactions. In the case of joint account holders, more than one customer can have a single account. Additionally, from each account, multiple transactions can be made.
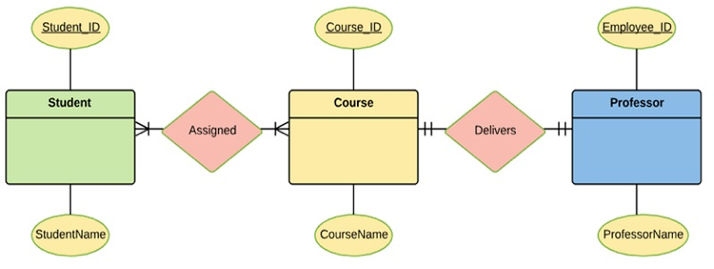
Here, Student, Course, and Professor are three different entity sets. Each set has a unique key – student id, course id, and professor id, besides their individual attributes. As you can see that multiple students can be assigned to multiple courses. Though, individual courses are delivered by dedicated professionals (one-to-one cardinality).
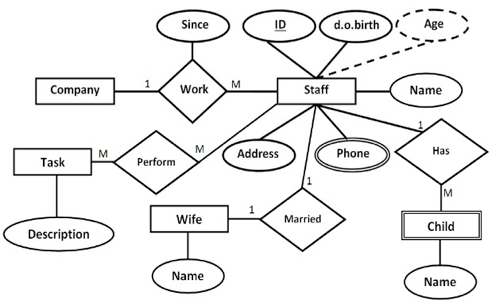
Finally, let’s consider a more complex ER diagram. In this, we can see that one company can have multiple staff members. Each of them has an ID, which acts as a primary key. Age is a derived attribute from date of birth. To expand the Staff entity, we have listed if they have kids, whom they are married to, and what job they perform.
How to draw a basic ER Diagram with EdrawMax?
Now when you know the nitty-gritty of an Entity Relationship Diagram, you can easily create one by following these steps:
This is the most important aspect of any ER diagram. At first, you need to identify what are the major entities involved in it. For instance, if we are creating an ER model for the university, then it would have three entities – Students, Course, and Teachers.
Relationship is acting as the bridge among entities. Usually, relationships reflect the interactions, which are verbs like "buy", "contain" and so on. In the following example, the relationships are "perform", "work", "has", and "married".
The next step is to add the attributes. In the ER diagram, the attributes usually are the further indication of each entity, such the "ID", "Name" and others. In the example below, the attributes are "Name", "Age", "ID".
The final step is to organize all the elements in your ER diagram in a logic way, from which the complex data could be simplified visually.
That’s a wrap, everyone. I’m sure that after reading this guide, you would be able to learn what is an Entity Relationship Diagram, its major components, and how to draw one. Although ER diagrams are extremely useful, they are mostly confined to relational database. If you wish to depict an object oriented database component, then it might not meet your requirements. Thankfully, with a tool like EdrawMax, you can easily explore all kinds of flowcharts and models to come up with engaging visuals like a pro.