How to Create a Fishbone Diagram in Excel
No professional diagramming tool at hand, and you have to make a fishbone diagram right now! Don’t worry and we are going to tell you how to create a fishbone diagram in Excel.
Today, we will walk you through creating a basic fishbone diagram (also known as cause-and-effect diagram) in Excel and then share an efficient and powerful diagram maker -- EdrawMax -- which is easier, faster and more productive than Excel in creating fishbone diagrams.
How to Create a Fishbone Diagram in Excel
Before you start to draw the fishbone structure in the worksheet, it’s better to change the worksheet into a total blank drawing page so that the grid will not obstruct the view.
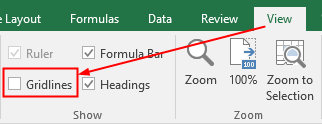
a. Turn Off Gridlines
Click View tab, find Gridlines option and remove the checkmark so that the whole worksheet will become a blank drawing page. It will be easy and convenient to see the overall effect of the diagram.
b. Add Shapes
Actually, there is no available and built-in fishbone diagram template in Excel, so you can search on the Internet and find some suitable fishbone diagrams as models to create your desired diagram in Excel.
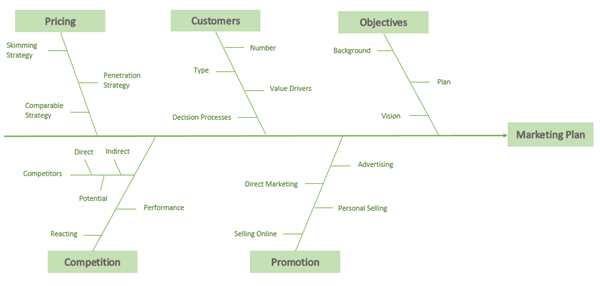
Fortunately, Edraw provides a great number of free fishbone diagram template, you can take a look at it and find some templates that attract your attention.
Here I choose the below fishbone diagram as the example.
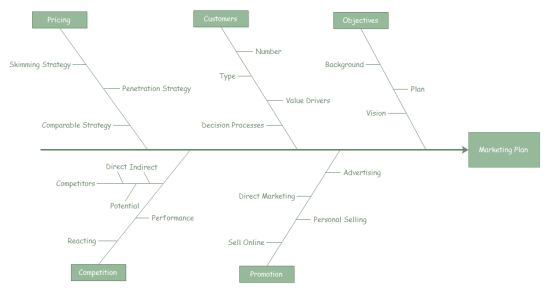
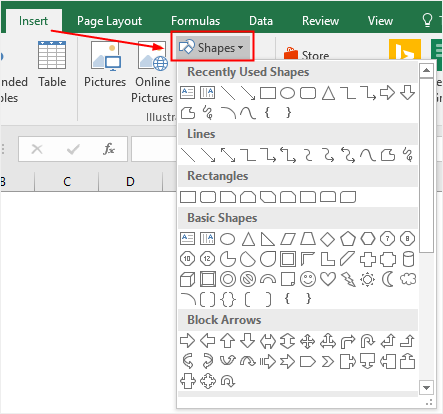
Then, you can imitate this diagram to add shapes (the boxes and the horizontal arrow) on the worksheet.
Go to Insert tab, click Shape, choose the corresponding shapes in the drop-down list and add them onto the worksheet.
c. Add Lines
Go to Insert tab or select a shape, go to Format tab, choose Lines from the shape gallery and add lines into the diagram.
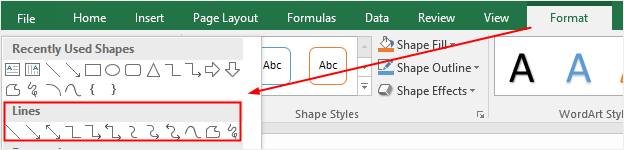
After adding lines, the main structure of the fishbone diagram will be outlined.

d. Add Text
To add text on the structure of the fishbone diagram, there are 2 different ways:
To add text on the boxes, you can click the shapes and type text on them directly.
To add text around the lines, you need to insert text boxes around the lines and then type text in the text boxes.
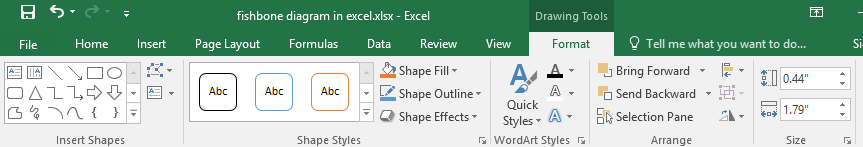
e. Format a Fishbone Diagram
Usually, the default colors and fonts in the diagram may not satisfy your requirements. So most of the users would like to customize the fishbone diagrams and adjust visual effects by changing the styles of shapes and text, font styles, alignment, etc.
You can modify the shape styles and WordArt styles in Format tab and change the font styles and alignment in Home tab.
How to Create a Fishbone Diagram in EdrawMax
Making a fishbone diagram in Excel needs you to spend much more time in drawing the main structure. It also requires a lot of additional steps to build a complete diagram.
Compared with that, using the professional diagram creator -- EdrawMax -- can give you great help. No more need to consume extra time in doing preparation. With plentiful templates and various symbols for different diagrams, EdrawMax can help you create high-quality fishbone diagrams with less time.
The steps of creating a fishbone diagram in EdrawMax:
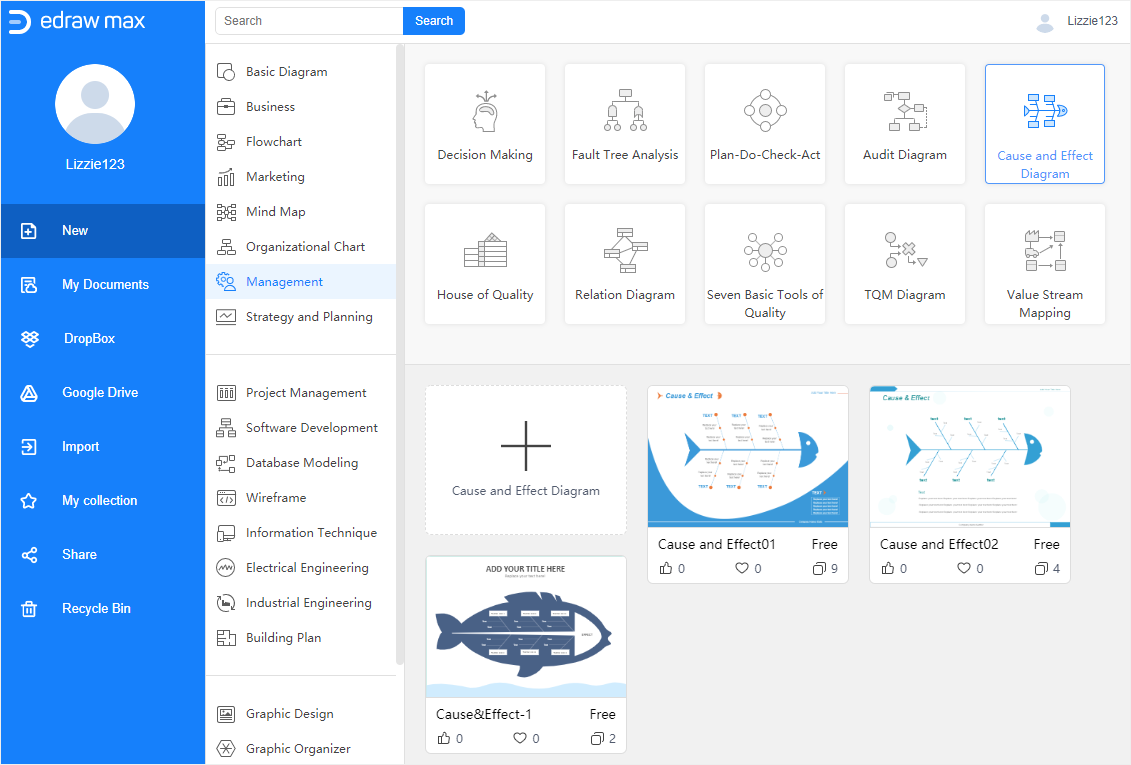
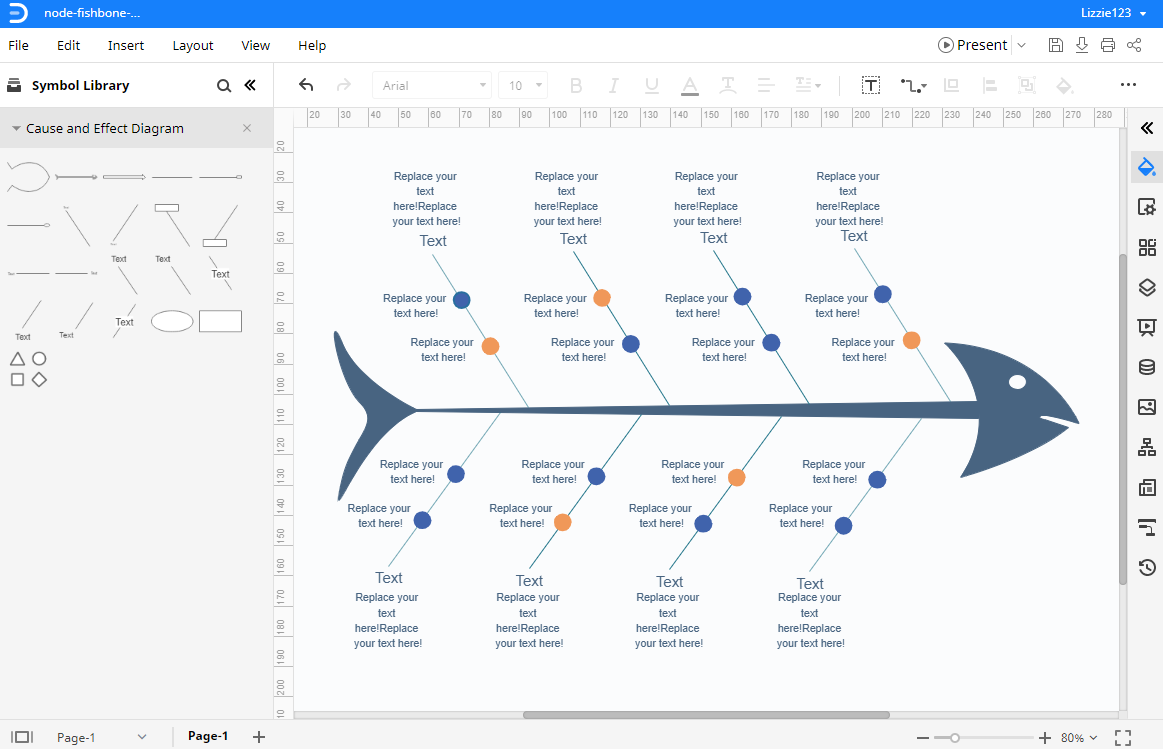
- Enable EdrawMax and select a desired fishbone diagram template in the Management gallery called Cause and Effect Diagram.
- Double-click the template to enter into the drawing interface and you will see the symbol library will pop up on the left side so that you can select anything that you like and add it into the diagram.
- Modify and customize the template to make your own fishbone diagram with easy-to-use drawing tools and abundant symbols.
- Save and export the fishbone diagram in Excel format or other common file types.
How to Save an EdrawMax diagram as Excel File
When you finish making a data flow diagram in EdrawMax, you can choose to save or export the EdrawMax document in Excel format.
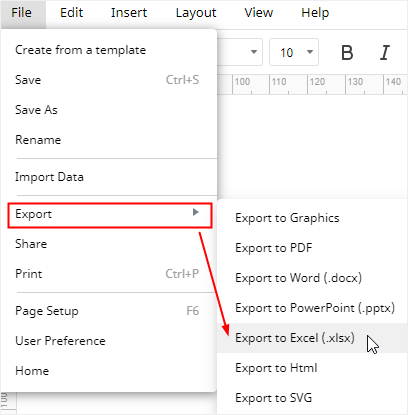
Go to File tab, click Export > Export to Excel, and the system will automatically save and download the created fishbone diagram as an Excel file. So you can get a fishbone diagram in Excel format. All the Microsoft Office files exported from EdrawMax are editable.
Besides, you can also export the finished EdrawMax diagrams in many other common file types, such as graphics, PDF, Word, PowerPoint, HTML and SVG. It will be much more convenient for you to share and transmit your designs and diagrams with colleagues and friends if they don’t use EdrawMax.