How to Make a Funnel Chart in Google Sheets
1. How to Make a Funnel Chart in Google Sheets
With the help of a funnel chart, organizations can understand and analyze the sales process at different functioning points. The funnel chart is the pictorial depiction of the revenue generated at each phase of the entire sales process.
The objective of a funnel chart is to provide an effortless understanding of the sales process to the readers. Creating funnel charts in Google Sheets is a smooth process. It involves very few steps, and those are:
Step 1: Launch Google Sheets
Launch Google Sheets in your browser and select the 'Blank' tab to open a new sheet.
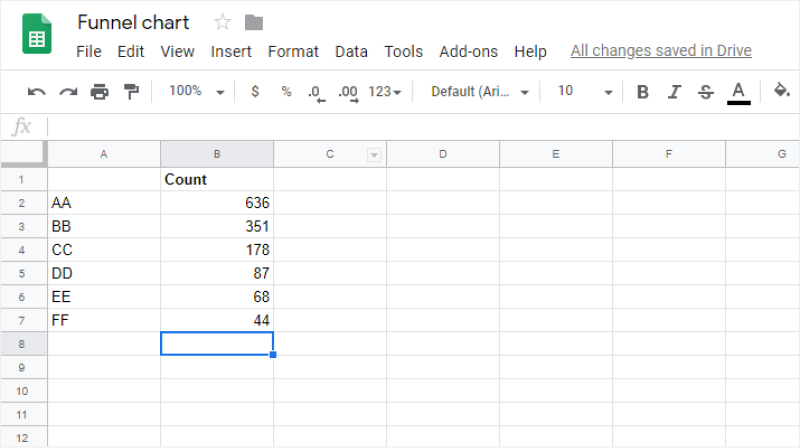
Step 2: Provide Data to Create Funnel Chart
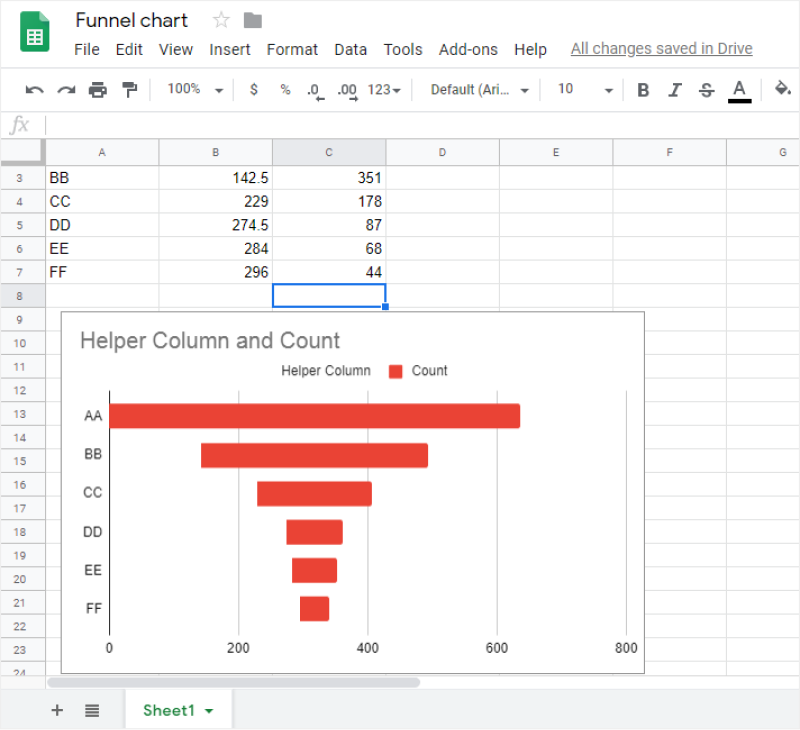
For the next step, you need to provide the data values in that sheet to create the required funnel chart.
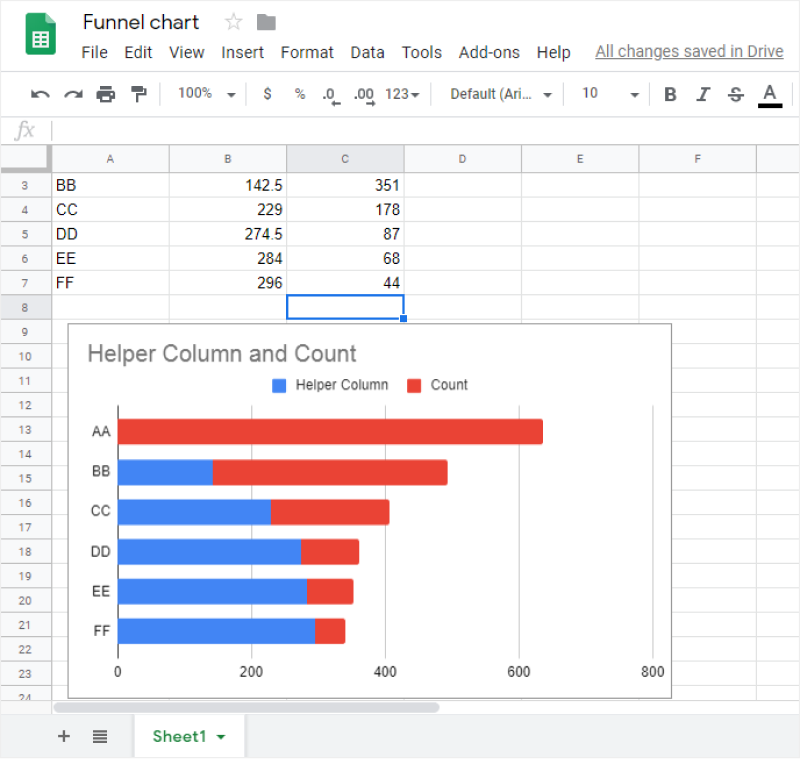
Step 3: Create Helper Column
Use the stacked bar chart for the purpose. You can make the base bars transparent. It will give a more prominent visualization of the funnel chart.
Now create a helper column. Later, you can give a transparent visualization. You can see a sample helper column in the below image.
Step 4: Insert Chart Type
After your helper column is ready, insert the chart by going to the Insert tab and selecting the chart. Go to the Chart Editor. Select Stacked Bar Chart as the Chart Type.
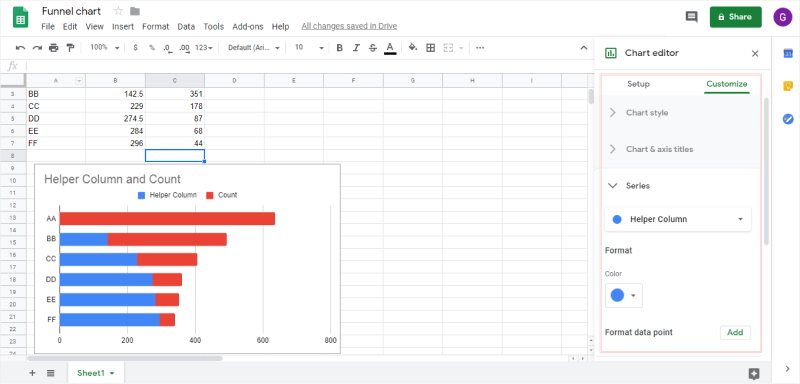
Step 5: Remove the Helper Bar
In the next step, you need to remove the helper bars. Double click on the blue bar to make the Chart Editor appear. Go to the Color tab, set the color value as none, and the helper bars will turn transparent.
Step 6: Save the Funnel Chart
Save the funnel chart for further use. You can download it by clicking on the File tab. Now, select the Download option.
Instead of a sheet full of words and figures, create a funnel chart. It is pleasing. It is easy to understand even in the most complex of business processes. Thus, these are the steps behind creating a funnel chart in Google sheets.
1.1 The Advantages of Making Funnel Charts in Google Sheets
Sales and marketing agencies use Funnel Chart to illustrate the linear process with sequentially connected stages. Several newbies use Google sheets to make and share their Funnel Charts. Following are some of the advantages of making a funnel Chart in Google Sheet:
- With Google Sheets, remote collaboration is top-notch.
- You can easily create a stacked bar chart that some companies refer to as an Inverted funnel chart if you know your work around the topic.
- You can easily link your Funnel Charts to Google Slides, making remote presentations extremely convenient.
1.2 The Disadvantages of Making Funnel Charts in Google Sheets
In simple words, Google Sheets is the alternative to Microsoft Excel or Keynotes. It is generally used to work on spreadsheets. However, even if you are trying to make a funnel chart in Google sheets, you will come across several limitations or disadvantages, like:
- Unavailability of funnel chart templates
- Inability to correctly customize the funnel charts
- You will be dependent upon third-party tools to get access to create funnel charts.
1.3 Tips for Making Funnel Charts in Google Sheets
If you are making a funnel chart in Google Sheets, then there are certain tips that you have to follow so that you can effortlessly work on your charts, like:
- Before you start making the funnel chart, ensure that you have created a helper column that will contain the values.
- Understand all the formulas or take a note of them from the internet
- If you are making a stacked bar chart, remove the X-Axis.
2. Make a Funnel Chart More Easily on EdrawMax
There is a tool EdrawMax that shortens your time to create a funnel chart. Also, it contains a substantial funnel chart in the product and template community that you can use immediately and create a chart effortlessly.
On EdrawMax, you can find thousands of readily available templates and design components to create all kinds of diagrams. The best part is that EdrawMax Online can also be accessed online, letting you work seamlessly on any platform. With simple drag-and-drop options, you can also create a visually appealing funnel chart via EdrawMax Online in the following way:
Step 1: Log in with Social Media Credentials
First of all, you need to log in with your EdrawMax account. If you haven't used EdrawMax before, you can sign up for a free account with your email address. Then you can use EdrawMax for free.
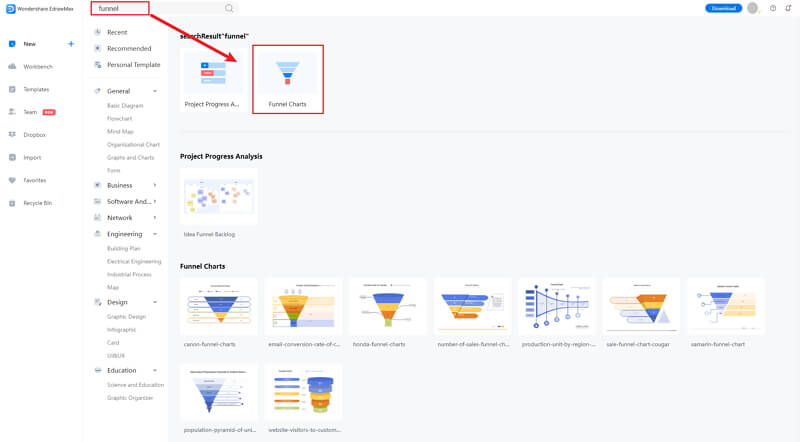
Step 2: Click Blank Drawing
After you log in to your account, find the General tab in the menu. Click the New tab, and the menu will open. From the New list, select the Graphs and Charts tab. When you click the Graphs and Charts tab, the panel will show up in the side window.
From the Graphs and Charts menu, and some bar chart templates and Create New tab (large + sign) will appear on the below panel. You can create a bar chart using a template or make a graph chart from scratch.
Step 3: Modify Your Funnel Chart
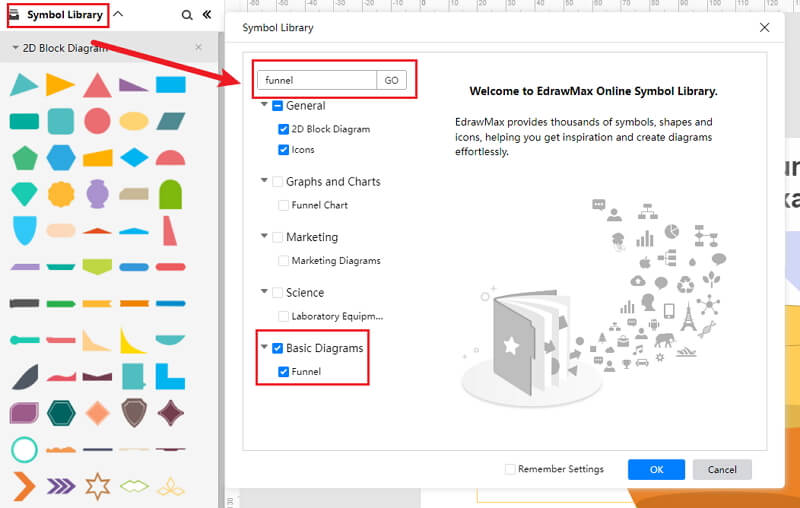
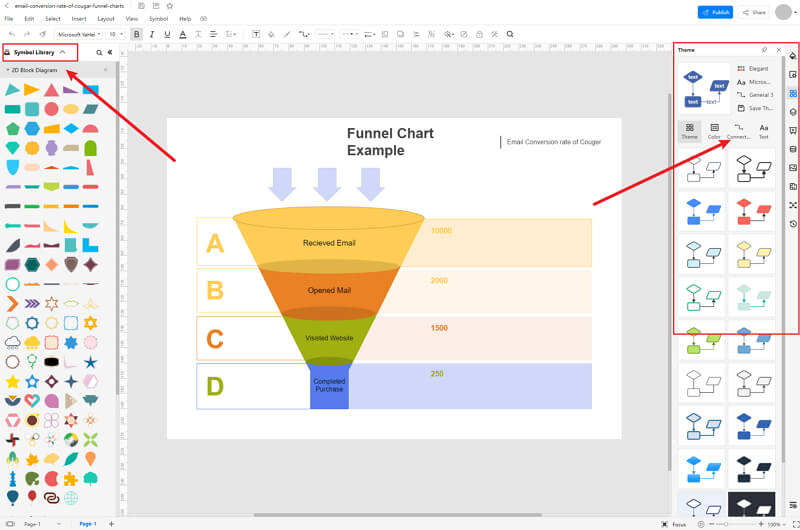
When you click the large + sign, the editor window will open. You need to find funnel chart from the Symbol Library.
Click the Symbol Library option on the top left side of the editor window. Next, a dialogue box will open. From the dialogue box, go to the Chart menu. A pop-up menu for charts symbol categories will appear. Then, mark the Funnel Chart tab, and click the OK button to import the funnel chart in the editor window.
Or you can search the funnel chart from the Symbol Library. Then, select this option, it will appear on the left side toolbar.
Step 4: Add More Details to Complete Chart
Once the symbols are imported to the editor window, you can drag and drop the six symbols in the editor to create your funnel chart using them. To edit the symbol, click in the boxes and enter your content. Likewise, you can make the boxes more attractive by using the Fill, Line, and Shadow options.
There are many editing options available in EdrawMax Online to make sure your funnel chart is customized according to your needs. You can change the transparency, change, type of fill, as well as add and remove layers.
If you want to change the graph type, go to the Attributes pane, and then click the Change Type option. To edit the series and categories of the data, go to the Data pane, and an editor window will open where you can input your data. You can add more series and categories as well as edit the different values against the series and categories.
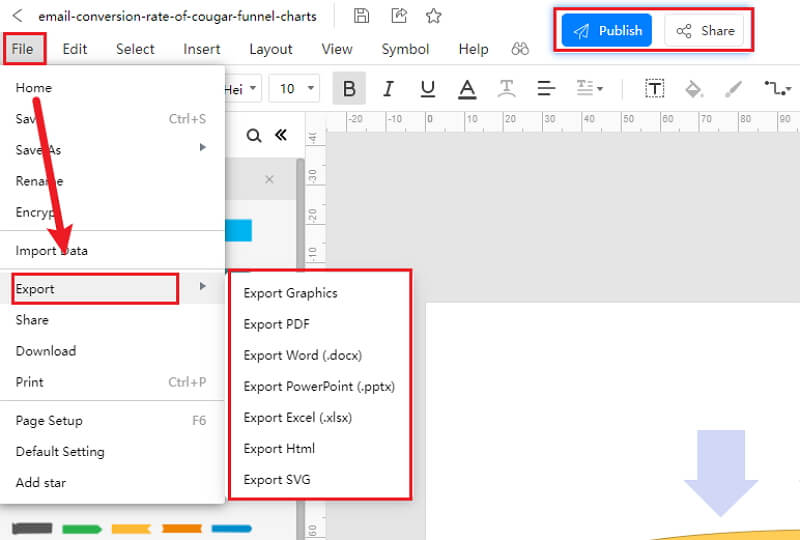
Step 5: Export Funnel Chart as Google Sheets
Click on File in the top left corner, from the drop-down menu select Export. From the Export menu, select Export to Excel (.exl), and your Edraw doughnut chart will be saved as a Google Sheets file to your computer. Also, you can export as Graphic format, and attached the image in the PowerPoint.
If you are still wondering how to make a funnel chart in EdrawMax Online, you can check this funnel chart guide for reference.
2.1 The Advantages of Making Funnel Chart in EdrawMax Online
Compared with Google Sheets, there are many advantages that making a funnel chart in EdrawMax Online:
- EdrawMax Online supports to make a funnel chart online, and will be automatically saved, which means you could make charts in any where at any time.
- EdrawMax Online has a powerful Template Community, that you can find inspirations from thousands of templates made by Edraw users.
- EdrawMax Online supports to export and import multiple file formats, which ensures that you can make continue your work from other platform to EdrawMax Online, or you can export your funnel chart from EdrawMax Online, and attached to other files.
- Or even you can showoff your funnel chart with others by using Presentation Mode.
2.2 The Disadvantages of Making Funnel Chart in EdrawMax Online
Even though there are some advantages of using EdrawMax Online as the tool to create your funnel chart, certain limitations affect the overall quality of the project. For instance:
- EdrawMax Online contains limited funnel chart related symbols. However, it is good for you to make your own bar graph symbols, you can create symbols from EdrawMax, or you can import the symbols you like and save into your symbol libraries for later use.
2.3 Tips for Making Funnel Chart in EdrawMax Online
Creating a funnel chart in EdrawMax Online could be easier thing than making in PowerPoint, since there are resources and powerful export function.
- Choose a built-in template from Template Community to start quickly.
- Use powerful toolbars on the right and left sides of canvas to make your funnel chart more stunning.
- Export your poster in mulitple formats to meet your needs, or share to your social media, email, and print it out.
3. Google Sheets Funnel Chart Templates
The followings are the funnel chart PowerPoint templates, you can refer to them, or even use them immediately with ease. There are more funnel chart examples offered to give you inspirations and you can use immediately.
Sales Funnel Chart
The following Funnel Chart design is created to illustrate the Sales Conversion Rate Tracking graphically. As you can see from the Funnel Chart below, out of 389 inquiries, 252 converted into leads. Out of this 252, only 31 percent converted into opportunities, and only 40 people were converted into sales leads.
By creating a similar Sales Funnel Chart, a product-oriented company will understand how to scale their market and which areas need more work. Such Funnel Charts also help the company realize how well they are performing compared to the last financial quarter or how much they are behind in achieving their next month’s target.
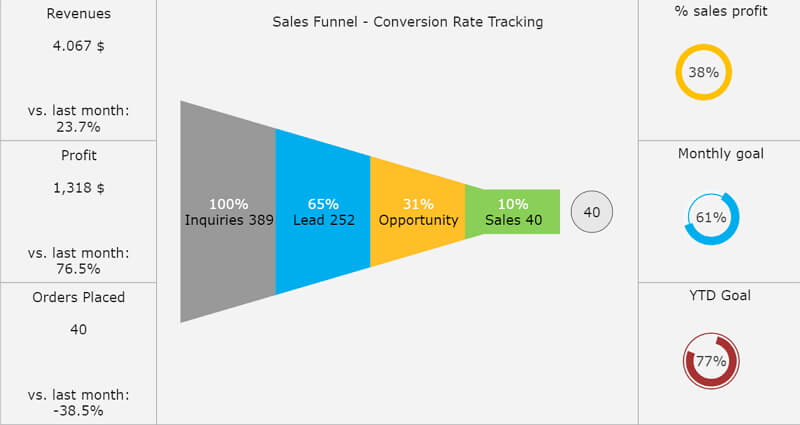
Source:EdrawMax Online
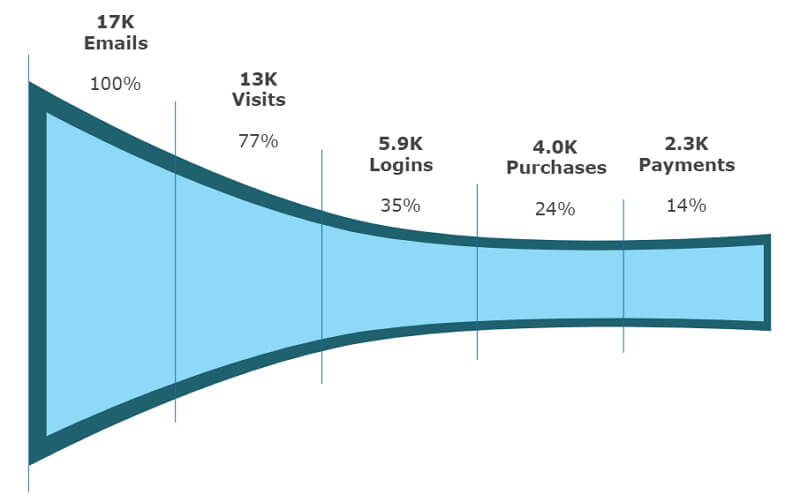
Funnel Chart Google Sheets
A Funnel Chart, just like the below diagram, helps a company visualize a linear process with sequentially connected stages. Here we have taken an example of a Purchase Funnel Process that tracks a customer's behavior across different stages. As you can see here, a customer will go through six different stages before they finally decide to make a purchase.
These stages are: Grab the Attention, Create an Interest, Consideration, Intent, Evaluation, and Purchase. Such Funnel Charts are extremely helpful as they convey the overall health of the process. You can use EdrawMax Online to create similar-looking Funnel Charts to understand your company's Purchase stages.
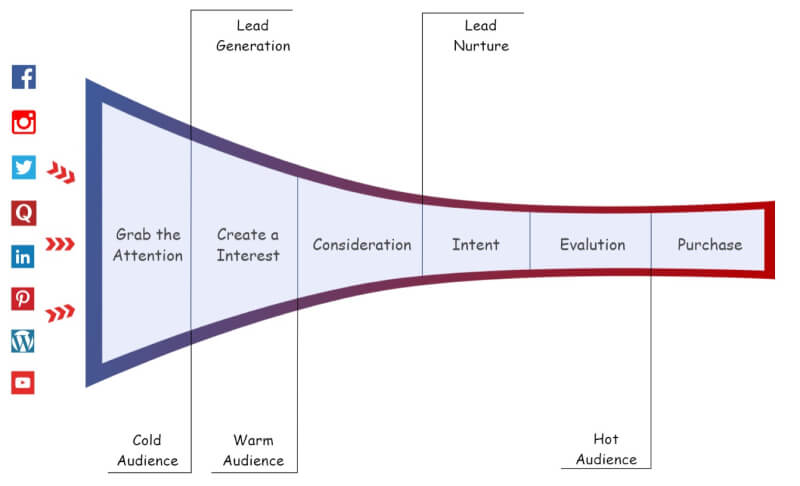
Source:EdrawMax Online
Funnel Chart Template
If you need to understand a customer reduction over the last fiscal year and track the overall data's performance, you can study the following Funnel Chart. In this Funnel Chart example, we have segmented customers into different categories depending on their level of interaction with the company.
For example, if someone has made a repeat purchase, they will surely be interested in trying a new product. If someone has made a purchase only once, you will need to release some extra offers to convince them to place an order. Such traditional sales funnels are shaped like a triangle and have four or more sections: Prospective Customers, Contacts, Leads, and Customers.
Source: EdrawMax Online
4. Free Online Funnel Chart Maker
In sales and marketing, funnel charts play an important role. Usually, these charts represent different stages of a sales cycle, starting from creating a persona to acquiring the lead to converting it into a potential client. EdrawMax Online is a free online funnel chart maker, which enables to create funnel charts with ease.
- There are thousands of design elements in EdrawMax Online that can help you create 280+ different types of diagrams.
- You can also browse its extensive range of templates in EdrawMax Online Template Communityand can readily customize them as per your requirements.
- EdrawMax Online is a free cross-platform tool that you can access on any browser and use without any prior designing experience.
- There are dedicated features to customize your diagrams and export them in numerous formats like PNG, PDF, TIFF, SVG, and more.
Funnel charts require you to understand the data before creating the stacked bars. With EdrawMax Online, you can jot down all the information regarding your product on the blank canvas before you start working on the actual chart layout.
5. Key Takeaways
Making a funnel chart in Google Sheets seems easy, but several restrictions are. It does not offer full customization, and free templates are very limited. Unlike Google Sheets, EdrawMax Online is well-equipped with free funnel chart templates that are fully customizable.
In addition to this, EdrawMax Online takes extra precautions when it comes to the safety of your charts. All the data and information imported or designed in your registered account is stored with perfect cloud-based encryption.