How to Draw a Science Diagram
Create a Science Diagram on Edraw.AI Online Free Free Download Free Download Free Download Free DownloadWhy Draw Science Diagrams?
While teaching science, there are several elements, objects, processes, or outputs/results that cannot be seen through naked eyes or felt merely by touching the substances. Some experiments require expensive equipment and materials, and many schools can’ t afford that.
This is where science diagrams come into the picture. With the help of diagrams, science teachers can easily illustrate the equipment, substances, and objects. In addition to this, the trainers also use directional arrows to represent the flow of processes that occur/take place before getting the final results.
For instance, chemistry professors cannot show molecules or atoms of certain substances to students. Likewise, these diagrams can help physics professors explain the magnetic fields of an electromagnet.
Another good example could be in the biology subject where the professors cannot dissect a human body to explain how it works. This is done with the help of diagrams where they draw all the arteries and veins to explain how they’re responsible for the blood circulation in a body.
Ways of Making Science Diagrams
Traditionally, students draw science diagrams manually on paper using a pencil, a couple of colored markers, a scale (ruler), and an eraser (to make minor adjustments and corrections), whereas lecturers do that on a blackboard or whiteboard using chalks or markers respectively.
-
Drawbacks of Traditional Method
Although the above method doesn’t require scholars and professors to carry any advanced equipment, the entire process is extremely time consuming and is prone to errors. This method also demands that the person holding a pencil, chalk, or marker has decent drawing skills failing to which, the diagram may not illustrate the object or process correctly upon completion.
Thankfully, it’s an IT era where things have become way easier with the help of software applications, and drawing science diagrams is not any exception either.
Today, there are several free and paid online diagramming tools that help you draw science diagrams quickly and easily as compared to the traditional method, without having you to be proficient in fine arts.
Such online tools have a complete library dedicated to a particular subject where all the required icons and symbols are present and can be used as needed. These programs also have lines and arrows called ‘Connectors’ to illustrate the relationship and workflow between the two elements. As a trainer or student, all you need to do is, drag and place the relevant symbols in the work area, and use the connectors to illustrate the relations or processes.
How to Make Science Diagrams Online?
The easiest way to draw science diagrams is with an efficient online tool. An example of one such diagramming solution is EdrawMax Online that is not only free to use, it also lets you export your creations to your preferred file format.
You can follow the steps below to easily create science diagrams using EdrawMax Online:
Go to https://www.edrawmax.com/online/ and sign-in to your account. If this is the first time you are using EdrawMax Online, you must create an account before you start to use it.
Ensure that New is selected from the left pane, scroll down the middle pane, select Science and Education, and from the main window in the right, click the thumbnail of your preferred science diagram template (Molar Tooth Anatomy for this example). This opens a new document pre-populated with all the symbols and shapes relevant to the template you chose.
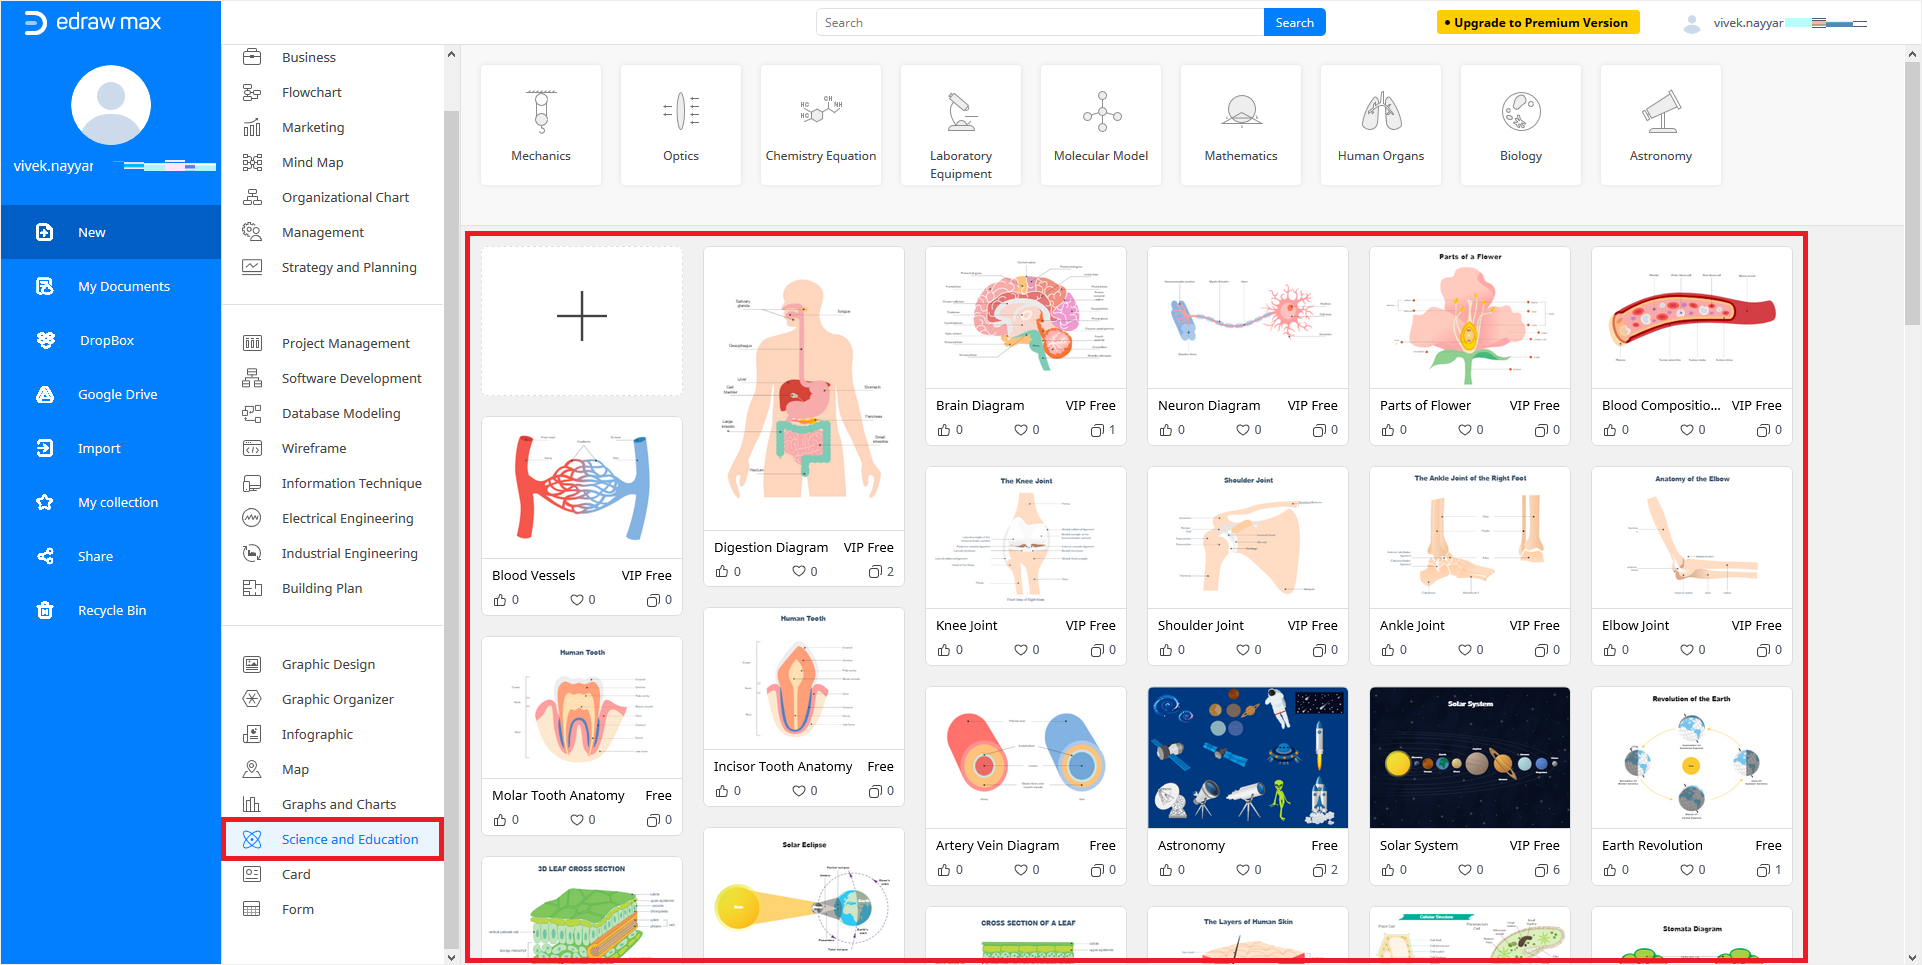
Alternatively, you can click the + icon from the main window to create a blank document and start drawing a custom science diagram from scratch.
Note: If you’ve subscribed for the premium membership, you also have access to a wide range of Free VIP templates with more complex diagrams.
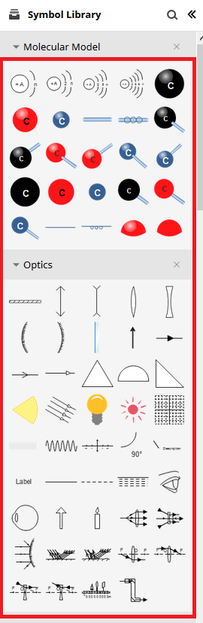
Click Symbol Library from the top of the left pane, expand the Science category in the Library box that opens up, check the boxes for the subjects you want additional symbols of, and click OK to add all the symbols to Symbol Library.
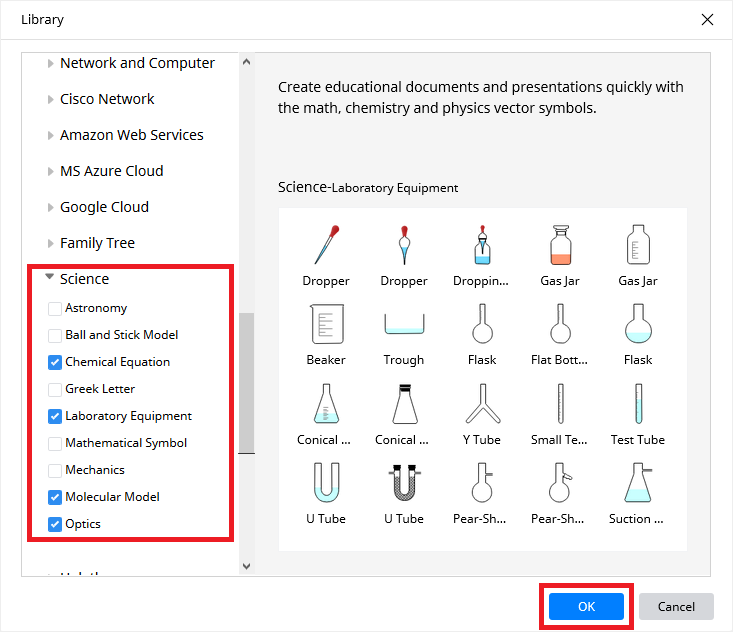
Once the symbols are added to the Symbol Library, you can double-click (or click and drag) your preferred one to add it to the current diagram.
Go to File and click Save As or Export to save your document to Dropbox/Google Drive or export it as a PDF, DOCX, SVG, or PPTX file.
More Free Science Diagram Templates/Examples
In addition to picking from the EdrawMax Online portal itself, you can also download many other science diagram templates that the developer has made available for you. A few popular ones include:
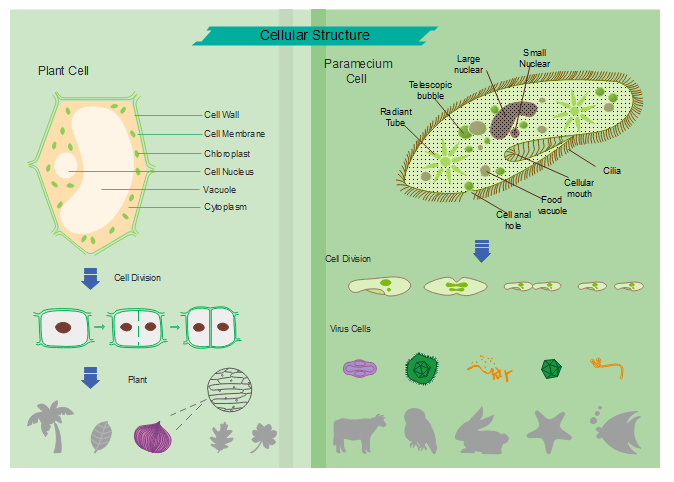
Cell Diagram
– This template has a pre-built labeled diagram of a cell. The template is also fully editable and lets you make further modifications to the diagram as needed.
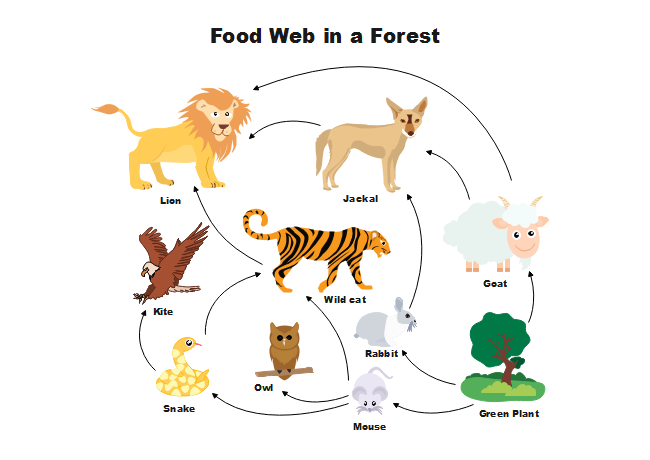
Food Web Diagram
– This template has pre-built symbols to illustrate how the entire food-chain works among animals.
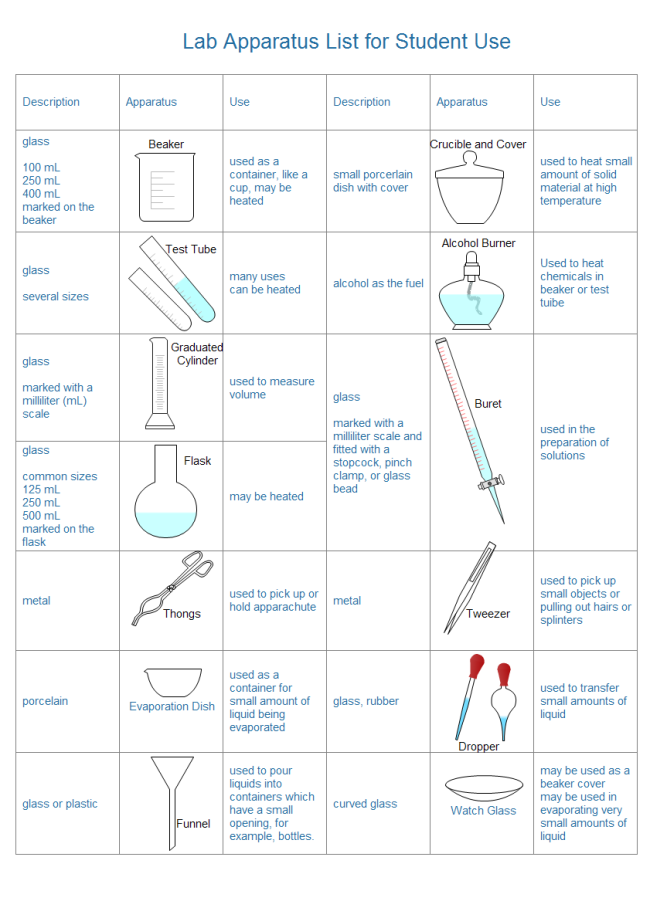
Lab Apparatus List
– Especially for scholars, this template has labeled icons and symbols for various apparatuses used in a laboratory.