Free Editable Compare and Contrast Graphic Organizer Examples
A graphic organizer is the best helping tool in education to represent the comparison and contrast between concepts and entities. It makes it easier for students to map their ideas and compare attributes to look for similarities and differences logically. If you want to create and use graphic organizers, check out our templates and example below. You can also learn about various graphic organizers and their uses.
1. What is Compare and Contrast Graphic Organizer
A compare and contrast graphic organizer visualizes similarities and differences between two or more concepts, people, items, or events. It depicts relationships between two or more data sets using various organizers such as a Venn diagram or a T chart. It helps students create a graphical map to represent their thoughts in an easy-to-understand format. Graphic organizers are commonly used as a creative studying tool for students and business presentations and reports.
2. The Compare and Contrast Graphic Organizer Examples
Graphic organizers are easy to use, and you can use them for any content area to depict information and concepts in an orderly visual representation. The term graphic organizer does not refer to a single diagram type. You can use various diagrams or charts and graphic organizers based on the entities you want to compare. Our compare and contrast graphic organizer templates will help you find a suitable diagram type. You can check out our examples and pick the one you want. Please remember that graphic organizers help students organize their thoughts to compare concepts and ideas.
|
|
|
| Compare and Contrast Graphic Organizer | Graphic Organizer Compare and Contrast | Compare and Contrast Essay Graphic Organizer |
|
|
|
| Graphic Organizer for Compare and Contrast | Compare and Contrast Graphic Organizer Template | Compare and Contrast Graphic Organizer Free |
|
|
|
| Compare and Contrast Graphic Organizer Example | Compare and Contrast Chart | Compare and Contrast Graphic Organizer Middle School |
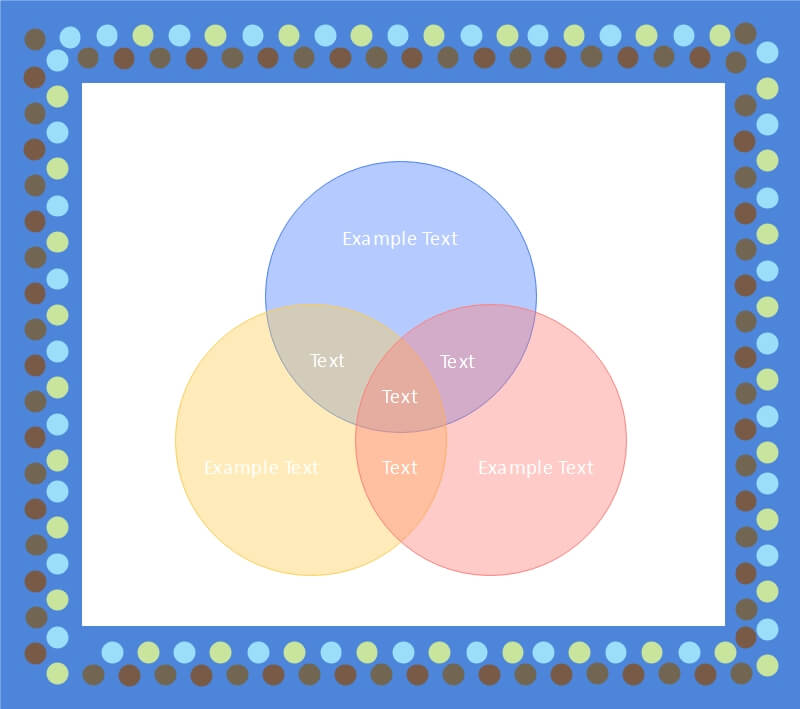
Example 1: Compare and Contrast Graphic Organizer
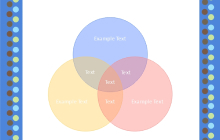
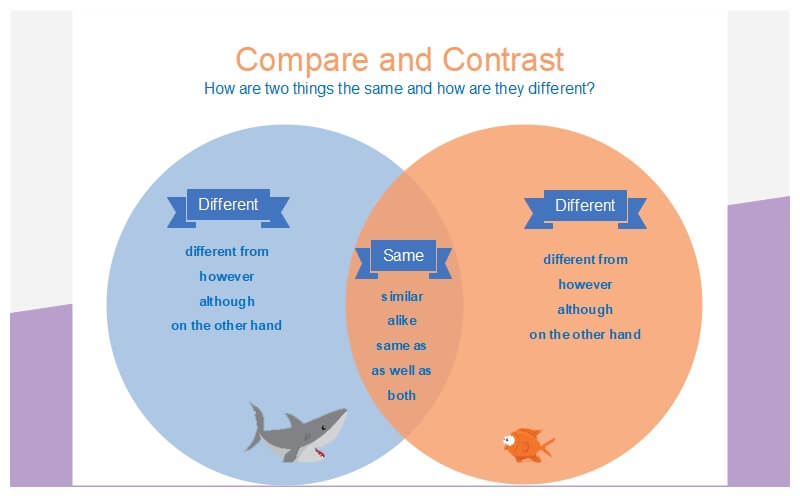
This is a compare and contrast graphic organizer example. The diagram type used in this template is a Venn diagram. A Venn diagram visually represents similarities and differences between two or three data sets with overlapping circles. It depicts the relationship between concepts and compares the attributes of various groups. The overlapping part of the circles represents the similarities, and the rest of the area means the contrast. Venn diagrams are also used to solve complex math equations.
Click on the image to edit. Source: EdrawMax Online
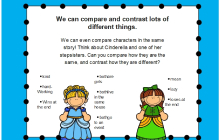
Example 2: Graphic Organizer Compare and Contrast
This is an example of a graphic organizer compare and contrast. Diagrams such as the one in this template are mainly used for education purposes, and educators use these diagrams to familiarize students of smaller grades with compare and contrast concepts. It is a simple logic diagram with creative images and bright colors that most kids like to read, and it helps them easily memorize the content and become more creative. The area of the diagram labeled as the same depicts the matching concepts of the two data sets.
Click on the image to edit. Source: EdrawMax Online
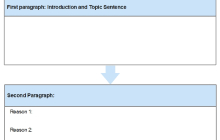
Example 3: Compare and Contrast Essay Graphic Organizer
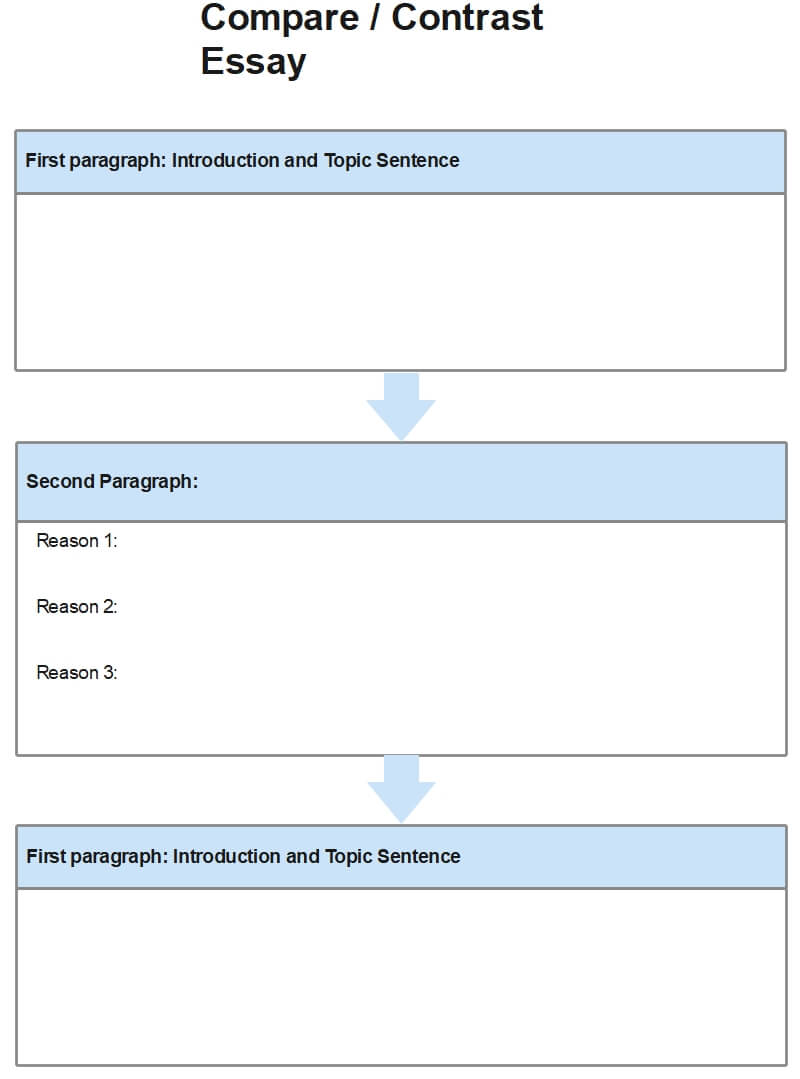
This is a compare and contrast essay graphic organizer template. The first paragraph of a compare and contrast essay introduces the essay topic, and it is always written at the top. In the first paragraph, the writers write down their ideas and concepts. After giving the topic sentence, the writer depicts the reasons or comparison for the assigned essay in the second paragraph. It makes it easier to determine the critical parts of an essay without reading it from start to end.
Click on the image to edit. Source: EdrawMax Online
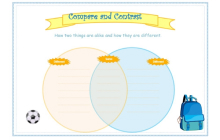
Example 4: Graphic Organizer for Compare and Contrast
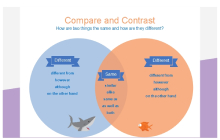
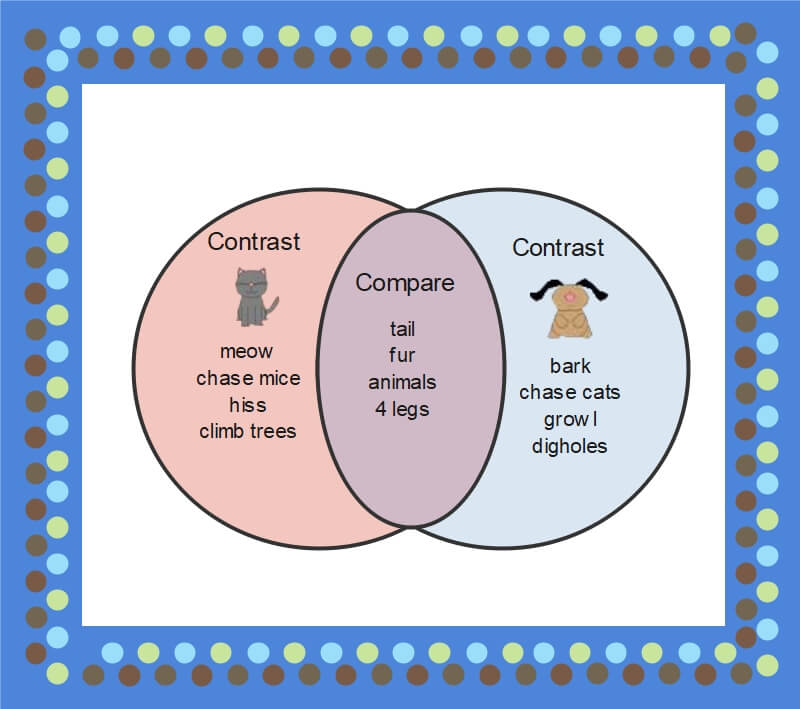
This graphic organizer example compares and contrasts attributes of two data groups or concepts. The diagram in this example is a set diagram. With the help of a set diagram, comparing two data groups is simple, and any reader can easily understand the similarities and differences between those data groups. When educators use these diagrams to teach lower-grade students, they add icons and colors to make the graphic organizer more attractive.
Click on the image to edit. Source: EdrawMax Online
Example 5: Compare and Contrast Graphic Organizer Template
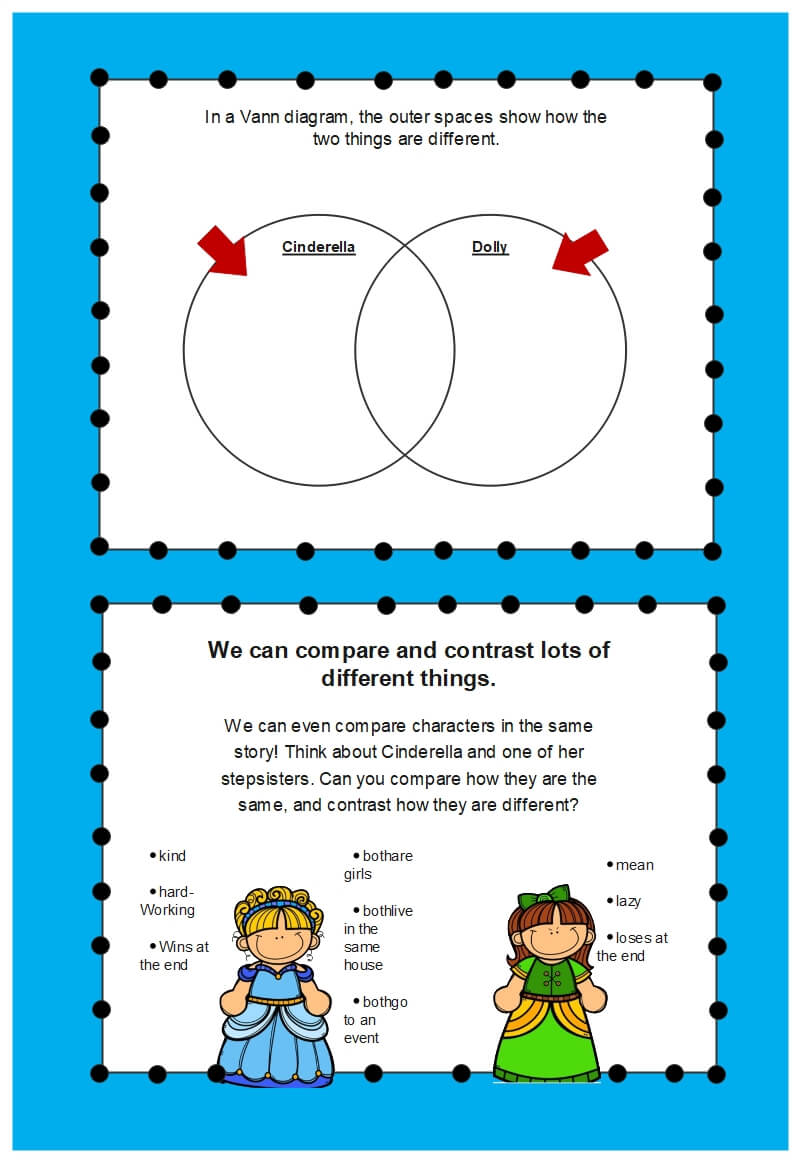
This is a compare and contrast graphic organizer template used by educators to teach their students about comparing two groups and organizing data and their ideas logically. The first half of this template is a Venn diagram that depicts the comparison between two groups. In the lower half, students can add images and list the similarities and differences between both groups based on the Venn diagram.
Click on the image to edit. Source: EdrawMax Online
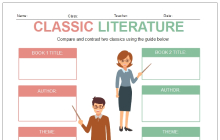
Example 6: Compare and Contrast Graphic Organizer Free
This is a compare and contrast graphic organizer free template that school teachers use to give students home assignments and tests. It follows a simple format where students write the title or name of both data groups at the top. In this template, the students are comparing two classic books. After the title, students write the words of authors for each book. After that, the students reach the theme of both books.
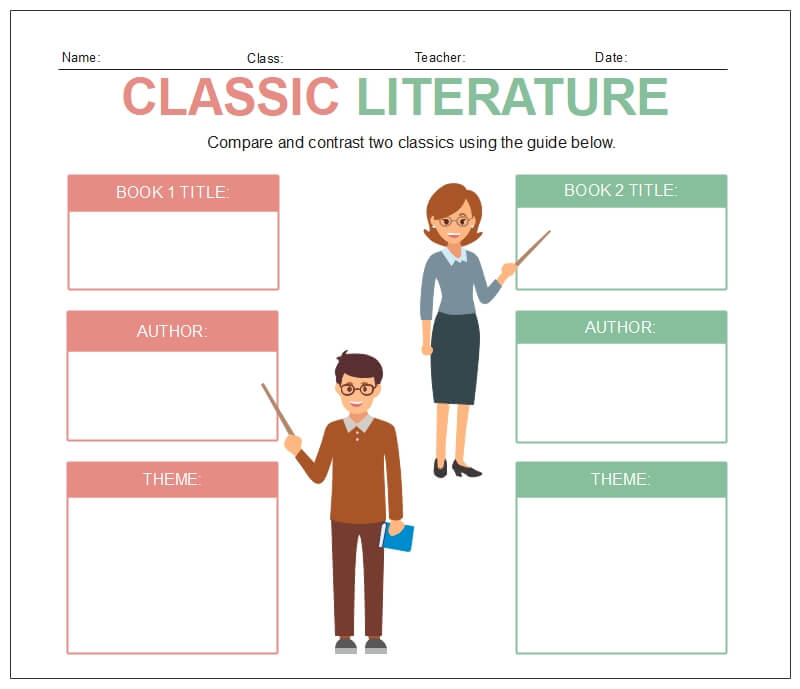
Click on the image to edit. Source: EdrawMax Online
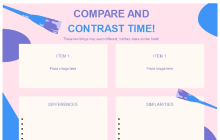
Example 7: Compare and Contrast Graphic Organizer Example
This is a compare and contrast graphic organizer example. Templates such as this one are mainly used to compare two images or data groups that look identical but are not the same. The format is simple and easy to understand for the reader. At the top, we got the images of each group, and after that, the graphic organizer divides the comparison into two sections. The first section lists the differences, and the second section lists the similarities in an organized manner.
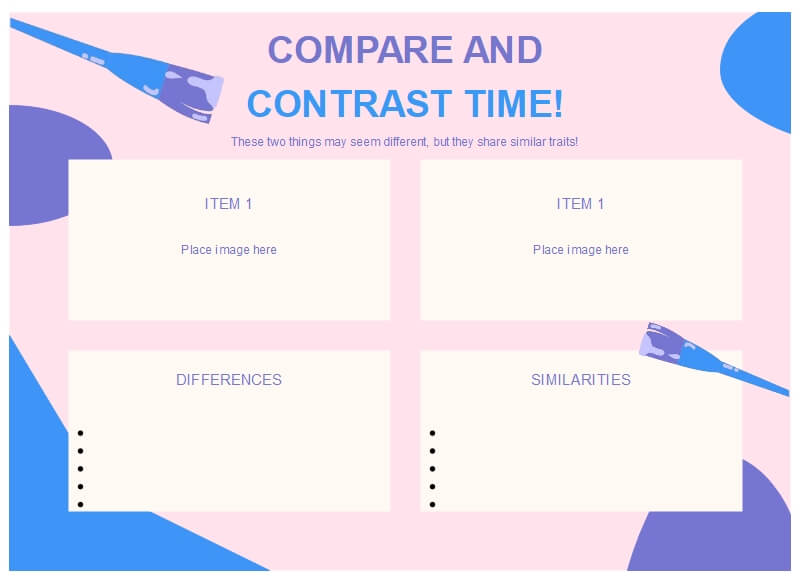
Click on the image to edit. Source: EdrawMax Online
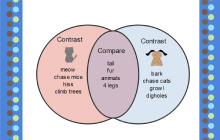
Example 8: Compare and Contrast Chart
The compare and contrast chart in this example uses a Venn diagram as a graphic organizer to show relationships between two data groups and depict their similarities and differences. Overlapping circles in a Venn diagram represent similarities between both groups, and the overlapping area contains the same attributes, while the other regions have differences. Venn diagrams are the most efficient educational tools that help teach students logical representation of ideas and concepts.
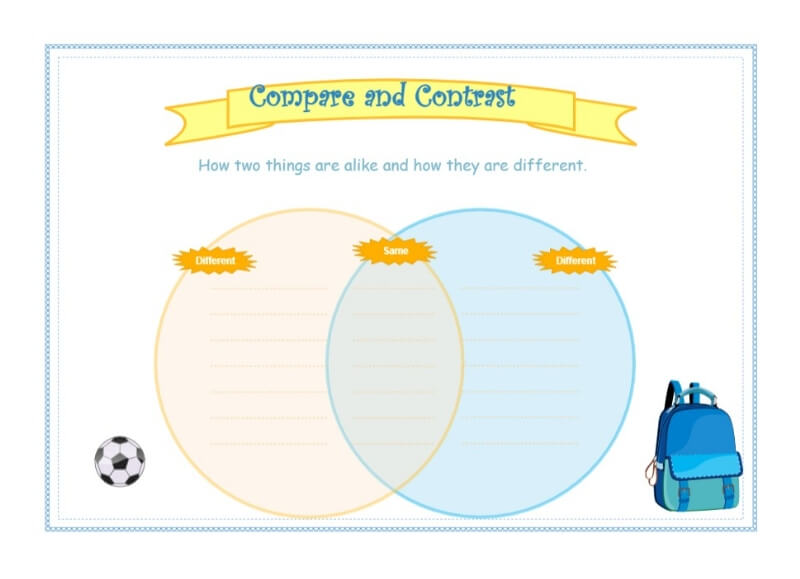
Click on the image to edit. Source: EdrawMax Online
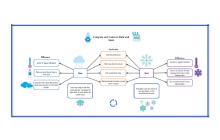
Example 9: Compare and Contrast Graphic Organizer Middle School
This is an example of compare and contrast graphic organizer in middle school. It uses a double-semantic map or a bubble map. Sematic maps are mostly used to represent the relationship between two words or data sets graphically. The topic words are mostly placed at the center on the left and right sides of the diagram. Between both of these words are their similarities, while their differences are on their left and right sides. It makes it easier to understand the similar attributes of both words or data groups.
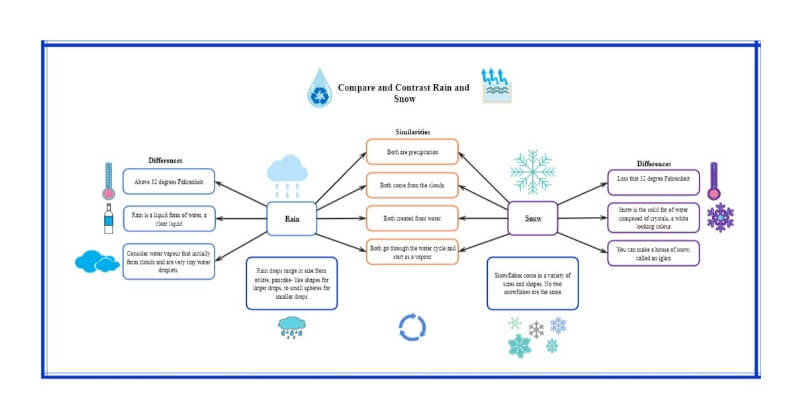
Click on the image to edit. Source: EdrawMax Online
3. Online Compare and Contrast Graphic Organizer Maker
Compare and contrast graphic organizers help visualize our thoughts and explain the differences and similarities between two concepts or entities. Although a graphic organizer is easy to understand for any reader making one takes some time and effort if you don't have the right helping tool. EdrawMax Online is the best compare and contrast graphic organizer maker out there. It gives you a comprehensive templates and symbols library that you can use and edit in a few clicks. Having pre-made templates saves both your time and effort.
4. Key Takeaways
You can use various graphic organizers to compare and contrast data sets and entities. Each compare and contrast graphic organizer comes with its features and uses. As an educator or a student, you have to make sure you are using the correct graphic organizer. EdrawMax Online is the best diagramming software to create a compare and contrast graphic organizer. It also gives you an extensive template collection that you can use for your diagram. You can also get the example templates listed above from EdrawMax. Find more graphic organizer template in the template community.