What is a Cross-Functional Flowchart?
This article is about cross-functional flowcharts with some examples. There also introduces essential steps in making one and an online tool to design cross-functional flowcharts.
1. What is a Cross-Functional Flowchart?
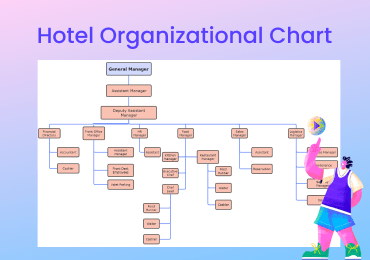
A cross-functional flowchart is an advanced version of typical flow charts with swimlanes; the cross-functional flowchart depicts who does what and when in a grid-like diagram composed of sections. The cross-functional flowcharts illustrate the relationship between the steps or stages in a process or activity and the individuals, departments, or functional areas responsible for that process.
Click on the image to edit. Source: EdrawMax Online
2. Benefits of Cross-Functional Flowcharts
Cross-functional flowcharts are widely used across all types of big and small organizations, software houses, and manufacturing plants to document their processes; some of its benefits are mentioned below.
Gives Clarity to the Process
The cross-functional flowcharts clarify the process by enhancing the process, defining everyone's responsibilities, roles, or a part in a circle, which helps reduce inefficiencies and ensures smooth execution by making it practical and efficient. The swimlanes or sections in the cross-functional diagram represent the participants, big teams, and functional departments, clearly specifying their roles in particular stages or chunks of the process.
Strong Coordination and Communication across Teams
For effective execution of the process with no delays, hurdles, or errors, all participants must be aware of their roles and timings so that tasks would not overlap. And this is what the cross-functional flowcharts does: it clearly states everyone their roles and makes communication and coordination strong and clear among all departments or individuals.
High Efficiency
Cross-functional flowcharts give a clear visual representation to control process duplication and inefficiencies. The flowcharts help identify deadlines and problems that might occur in the future; prior planning and a good strategy process will execute well without wasting time and resources.
3. Common Cross-Functional Flowchart Symbols
The cross-functional flowcharts are composed of some shapes and symbols representing a part or stage in the process.
The oval shape in the cross-functional flowchart represents the process's start and End of the process.
The rectangle shape depicts the process in the cross-functional flowchart.
The parallelogram represents the flow of information entering and leaving the system.
The diamond shape represents the decision; at this stage, the question arises, and a decision is required.
The connector represents the flow of sequence throughout the cross-functional diagram.
One more thing that makes a cross-functional flowchart unique from other flowcharts is that it comprises rows and columns, making grids representing a specific department's job or responsibility.
4. Cross-Functional Flowchart Use Cases and Examples
To gain some better understanding and working of cross-functional flowcharts, you must explore some of its applications or examples in various areas of fields.
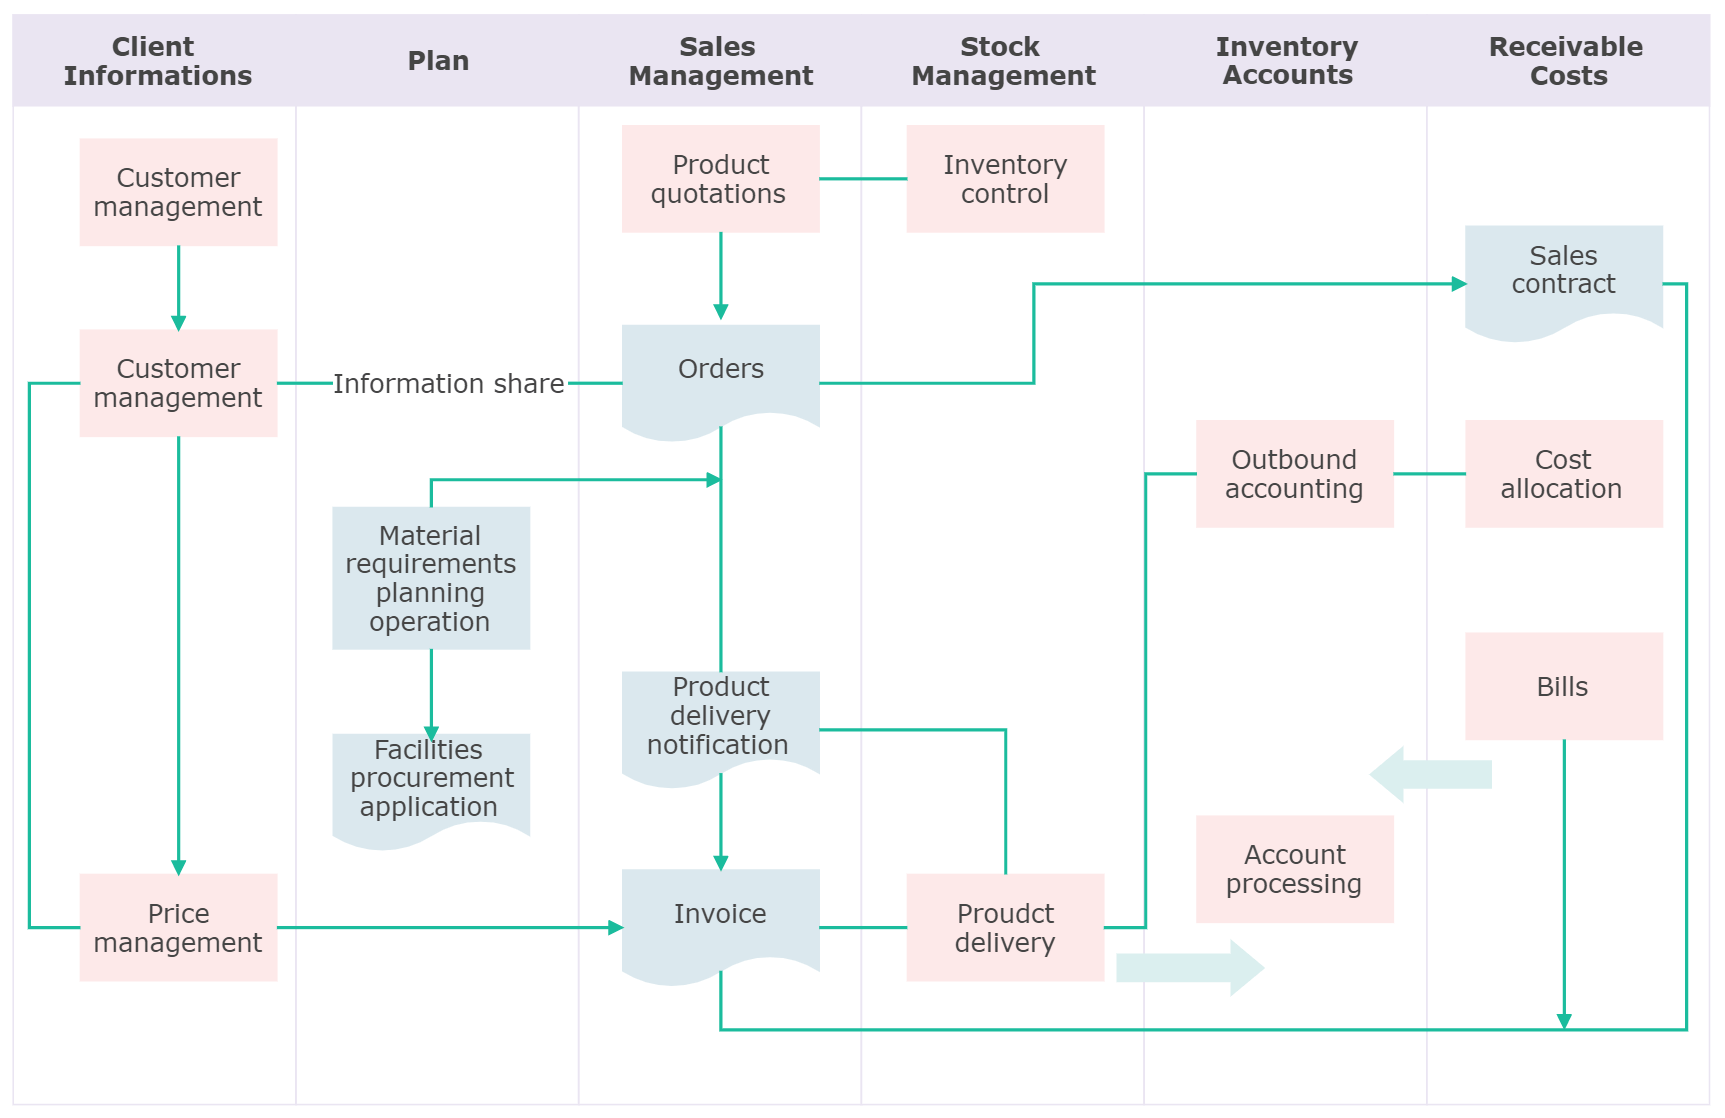
Example 1: Business
Let's take an example of the sales management process in business. Here, you can see that separate grids are made for each department with their roles and responsibilities. The client information department shares the information of the order with the sales manager when the customer pays for the product and invoice is generated; on the other hand, the Planning team is looking for required materials to manufacture that product. Once the product is ready, it is then dispatched to be delivered.
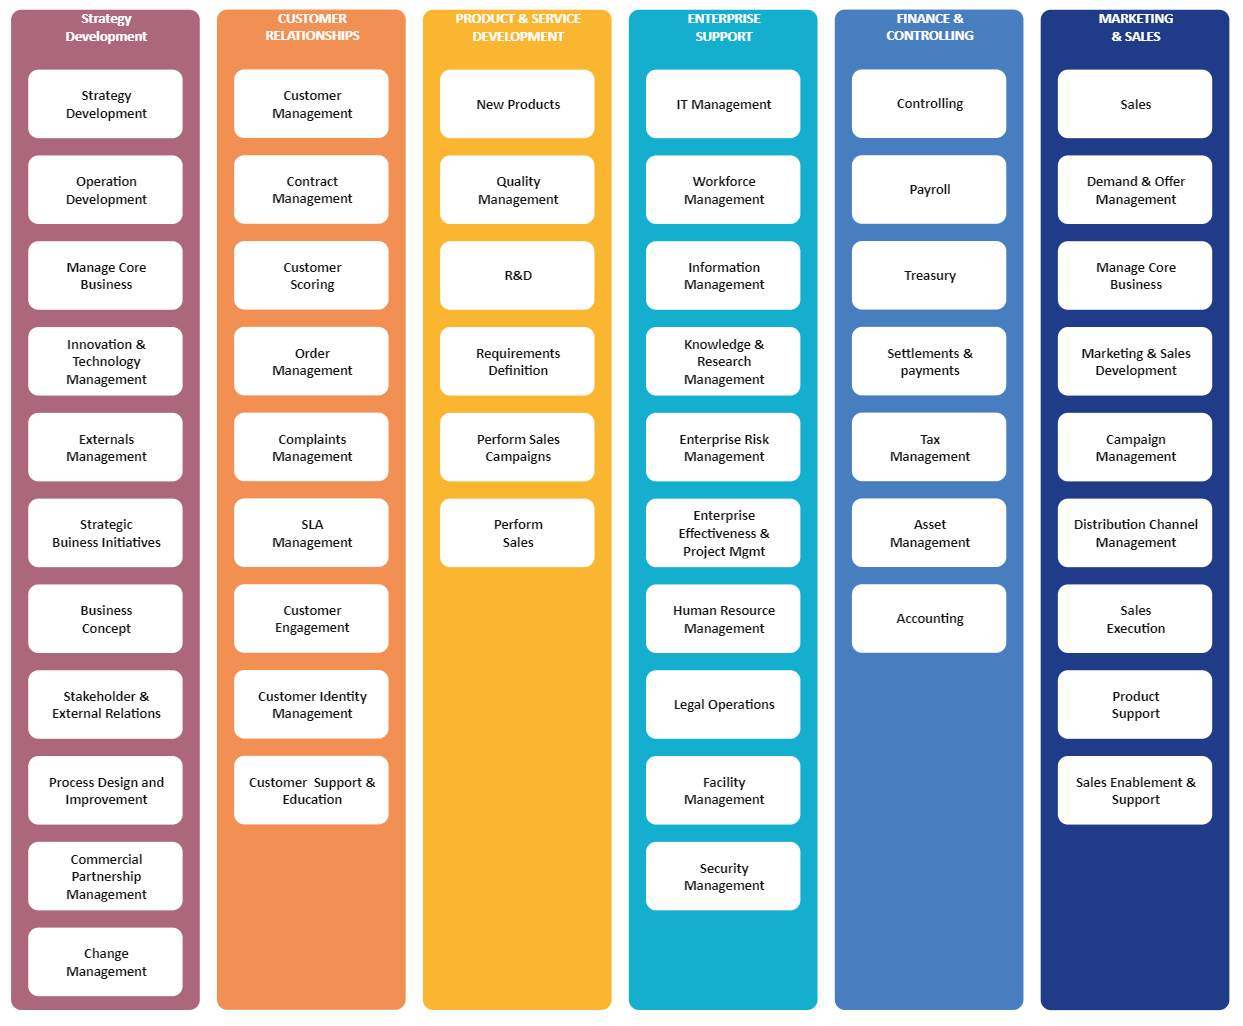
Example 2: Finance
Here is another example of a cross-functional flowchart of multiple departments of an organization, but let's consider the finance department now; the Finance department comprises seven sub-processes or jobs. As depicted in the flowchart, the Finance department is responsible for cost control, Treasury information and management, settlements, and payments, management of duties and taxes, asset management, and the most important one, Accounting.
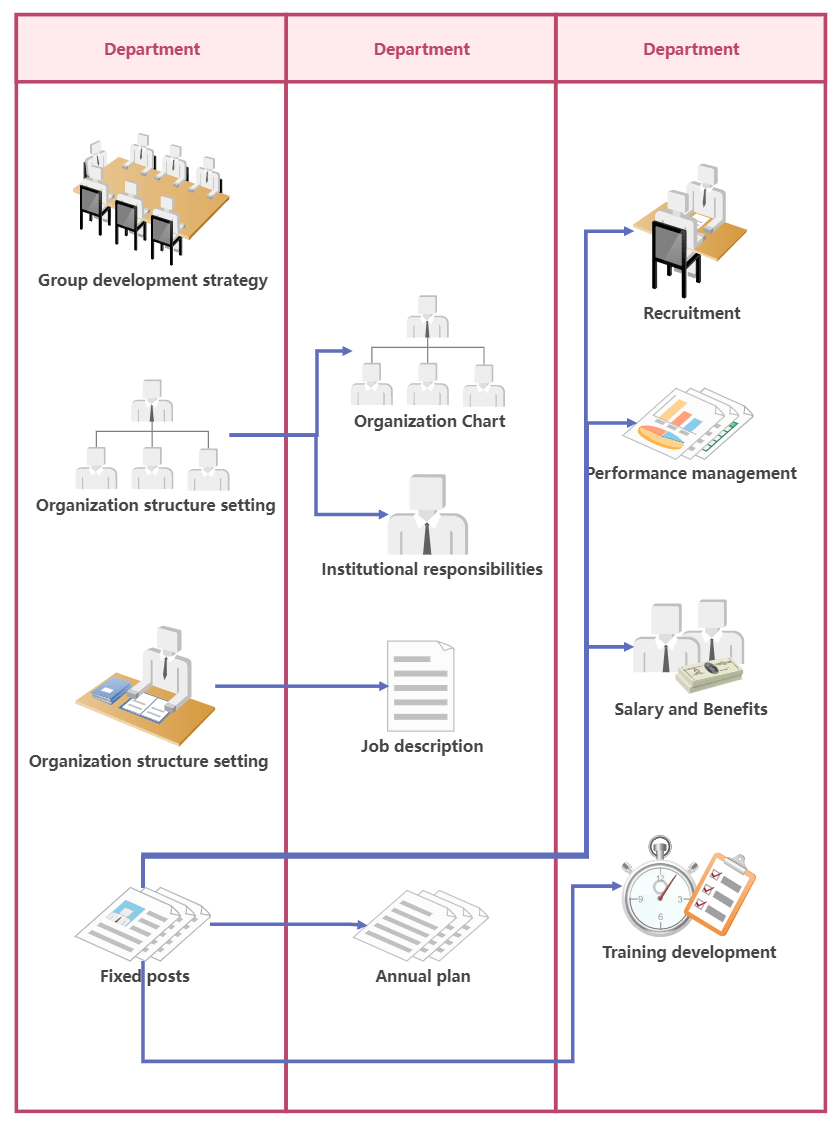
Example 3: Human Resource
This diagram is a cross-functional flowchart of a Human Resource department; the Human resource department has the information of the whole structure of the enterprise as depicted in this flowchart. They conduct an internal analysis, and if there is any need for new employees, the recruitment process begins. After selecting the new employee, responsibilities are assigned to him, and salary and other benefits are issued to him; besides, training and development of that individual are conducted where his performance is also evaluated.
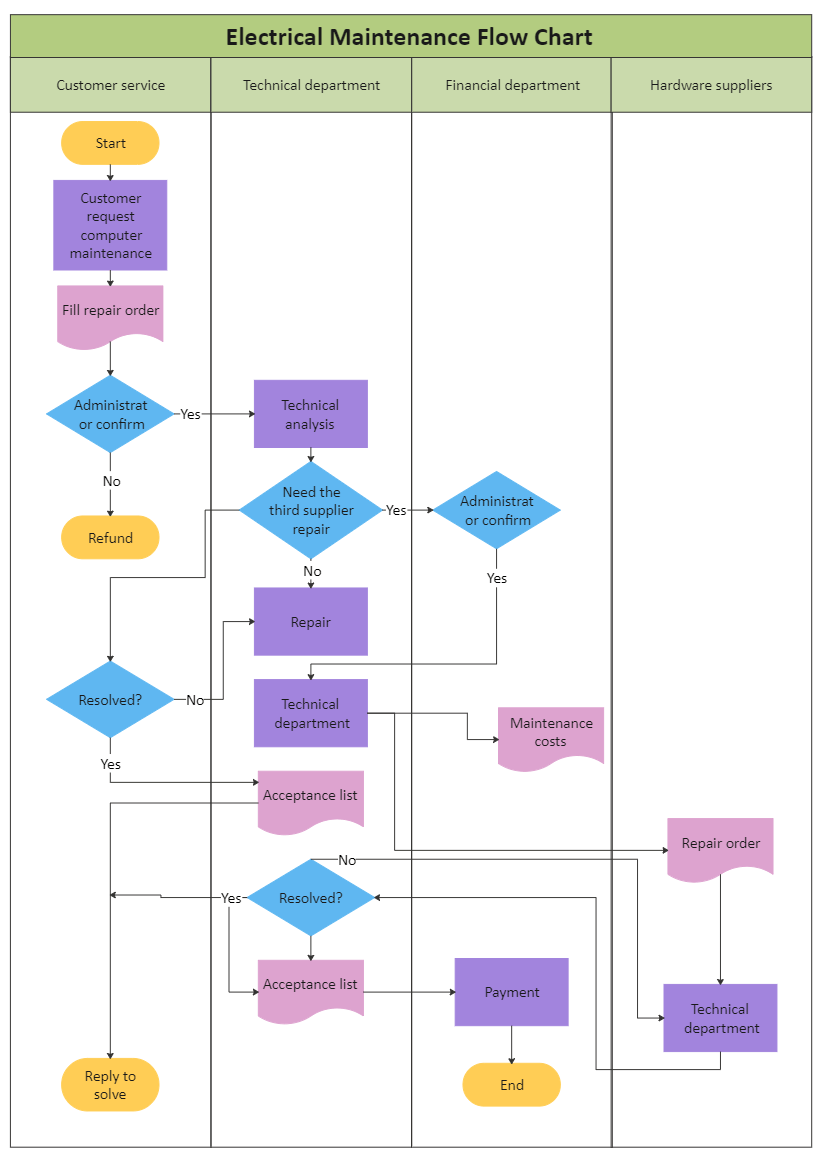
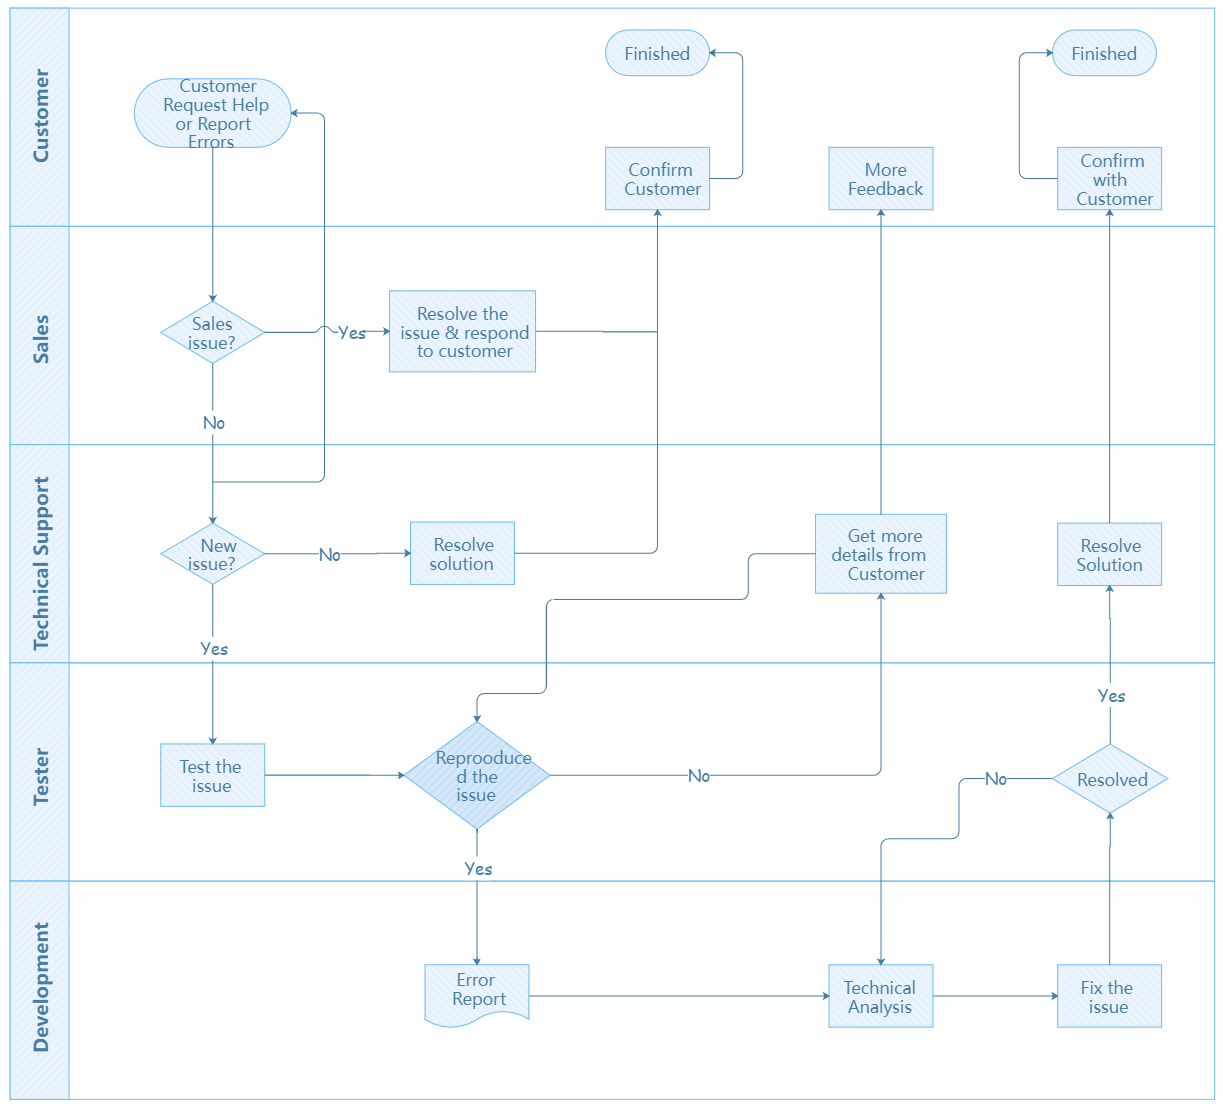
Example 4: Service
This is an example of a cross-functional flowchart of a customer service system. Here, you can see that multiple participants solve triggered feedback or complaint. When the system and the human intervention receive, feedback is necessary to answer it. The feedback is noted down, and if the maintenance is required to solve the customer's issue, then the case is forwarded to the operation team, who will resolve the customer's problem.
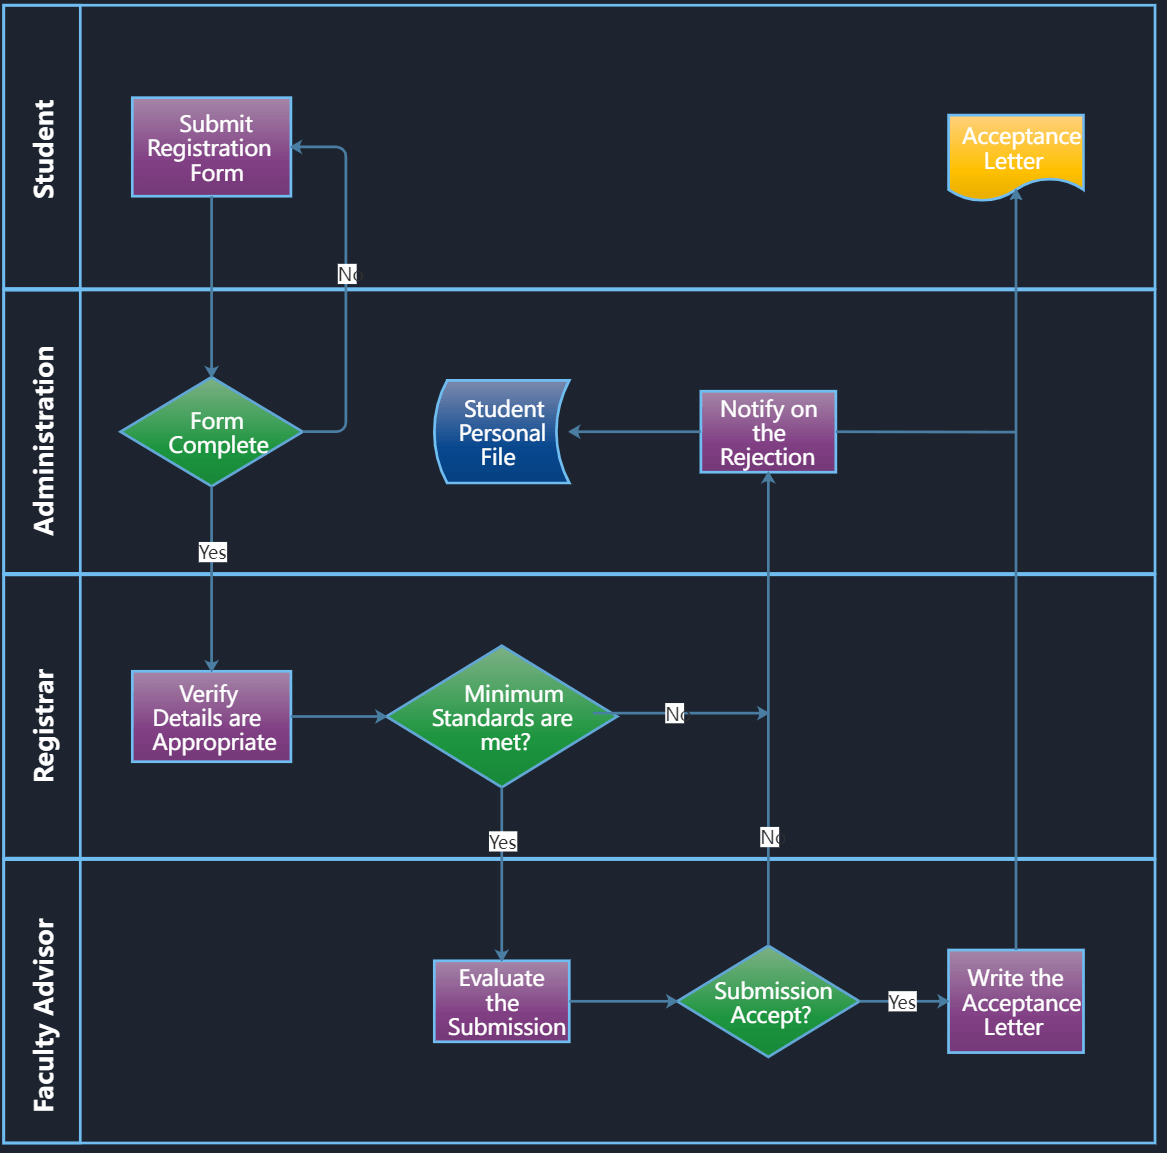
Example 5: Education
This diagram is a cross-functional flowchart for the admission process of students in a school/college. Four participants (Student, administration, registrar, Faculty advisor) are involved in the whole process, each doing his job. The student first submits the registration form for admission, and then the admin goes through the complete document if it is fine. The paper is forwarded to the registrar for verification. If the candidate meets the standards, it is sent to the faculty for final approval. If criteria are not met, then the candidate is rejected. The faculty then gives the acceptance letter to the selected candidate.
5. How to Create a Cross-Functional Flowchart?
After exploring some of the examples of the cross-functional flowcharts, now you are fully aware of it, it's time to learn how to create one.
1. Choose an Appropriate Template
As per the requirements of the process to be documented, its diagram or flowchart should be chosen. With the help of all stakeholders participating in the activity, a flowchart as the base should be selected to start designing and documenting.
2. Compile the Process Data
Identify the resources currently available and what is to be acquired. With the whole team's help, essential deadlines, process time, solutions, and alternatives should be brainstormed to better document a process.
3. Design a Proper Workflow
Once all the necessary data is compiled with crucial details, it's time to layout your initial flowchart, which will give your collected data of the process a visually appealing look easy to understand.
4. Work on Your Diagram
When the skeleton of the process is designed, it's time to gather your team and take their input, revise the mistakes, identify bottlenecks and duplicative tasks. Test your Cross-functional diagram once everything is finalized to ensure the proper execution of the process.
6. Online Cross-Functional Flowchart Maker
You can create a cross-functional flowchart in EdrawMax whether you know designing and editing or not. The cross-functional diagrams aid in identifying a process's bottleneck and indicate which department is accountable for it. Cross-functional diagrams are mainly employed when an organization's workflow has to be improved. This enables the business to pinpoint the source of an issue. A well-detailed cross-functional diagram can perfectly illustrate the issue behavior, whether due to a lack of clarity or a nasty customer service employee. Hence, it is essential before executing a process to design it in a flowchart to assist all stakeholders in implementing it.
EdrawMax is an easy-to-use diagramming software that can design a perfect detailed cross-functional flowchart of any process. In EdrawMax, one can create more than 280 plus diagrams. The software is enriched with thousands of exciting features, more than 50,000 unique shapes and symbols, and thousands of pre-designed diagram templates. The software is available for Windows, macOS, Linux, and its online application is also available. The templates offered by EdrawMax assist businesses in designing professional and branded flowcharts. The software has fantastic customization tools and features and complete control over the layouts, colors, shapes, text, and more.