Fault Tree Analysis (FTA) – Definition & Examples
Create a Fault Tree Analysis on Edraw.AI Online Free Free Download Free Download Free Download Free Download1. What is a Fault Tree Analysis (FTA)?
Fault Tree Analysis is a graphic failure analysis tool used to deduct causes of undesired results and failures at the system level. It uses Boolean logic to analyze the system and find the pathways that lead to the cause of failure. FTA uses a top-down approach by starting at a single point at the top, branching downwards to check the states of the system.
Fault Tree Analysis uses logical symbols to pin down failures at the lower levels of a system by checking basic events to identify the causes of system-level failures. A fault tree diagram depicts the failure chain by using logic gates and events. It tests events based on true/false statements and chains them to create a logic diagram to get to the root of failure.
A fault tree diagram depicts the state of a system by checking the state of basic events in that system using logic gates. It places the main event at the top and draws branches that represent the cause of the event. Each branch is further divided into branches that represent their immediate causes. It goes on and on until the logic reaches the lowest level of a system.
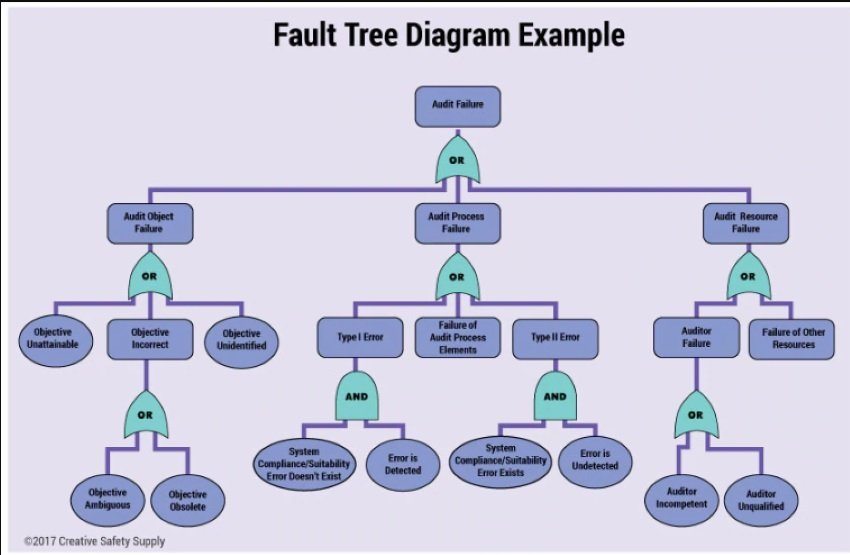
Image Source: bigcommerce.com
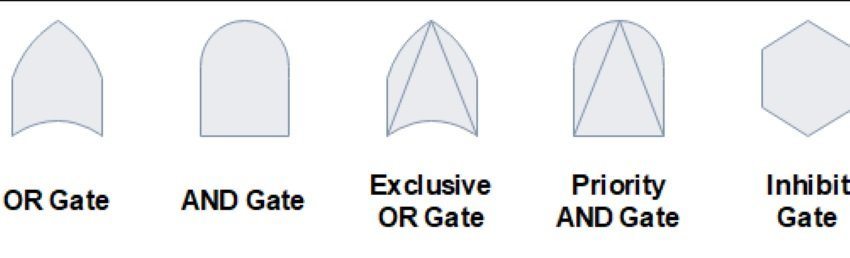
2. Symbols of Fault Tree Analysis
For drawing a fault tree diagram, you can use logic gates and symbols along with specific Fault Tree Analysis shapes. There is an article to introduce fault tree analysis symbols.
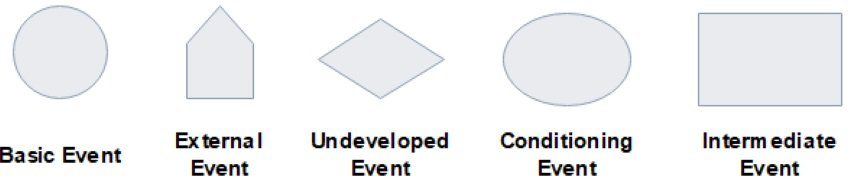
The first failure event is a circle. The house like symbol describes the external event. This event is either expected to occur or average. An undeveloped event gets indicated with a symbol that doesn't need any further investigation or breakdown or analysis because of a lack of information.
A restriction on an event gets represented through a conditioning event. A Boolean relationship describes different outcomes.
-
AND Gate
If all conditions of input meet, this event occurs.
-
OR Gate
This event occurs when at least one of the event happens.
-
Priority AND Gate
It is a restricted scenario where the event occurs only after the fulfillment of certain conditions.
-
Exclusive OR Gate
It's opposite to the Priority AND Gate. The event occurs after one condition meets, and not all.
-
Inhibit Gate
This event will occur after happening of all events described in a conditional event.
It includes the following shapes.
-
External Event
A house symbol is generally accepted to occur.
-
Basic/Primary Event
A circle depicts an error or failure in an element or system component.
-
Undeveloped Event
This event requires no more investigation due to a lack of information resources.
-
Conditioning Event
It is a restriction, especially on the logic gate.
-
Intermediate Event
In this event, there are detailed descriptions of events, and they are above a primary event.
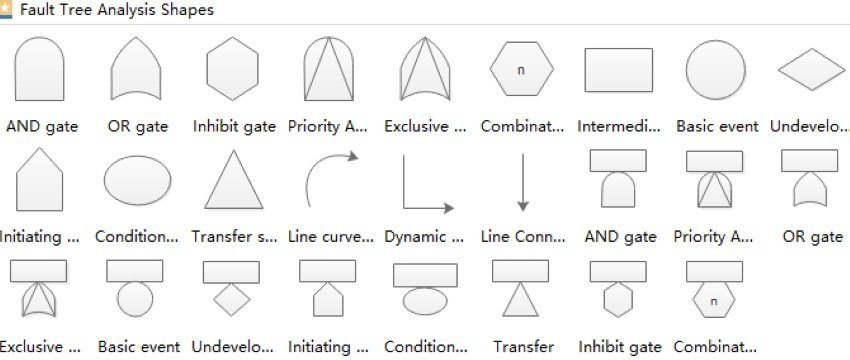
Here are some standard logos that indicate the Fault Tree Analysis shapes.
3. Fault Tree Analysis Examples
You can better understand with the help of these Fault Tree Analysis examples.
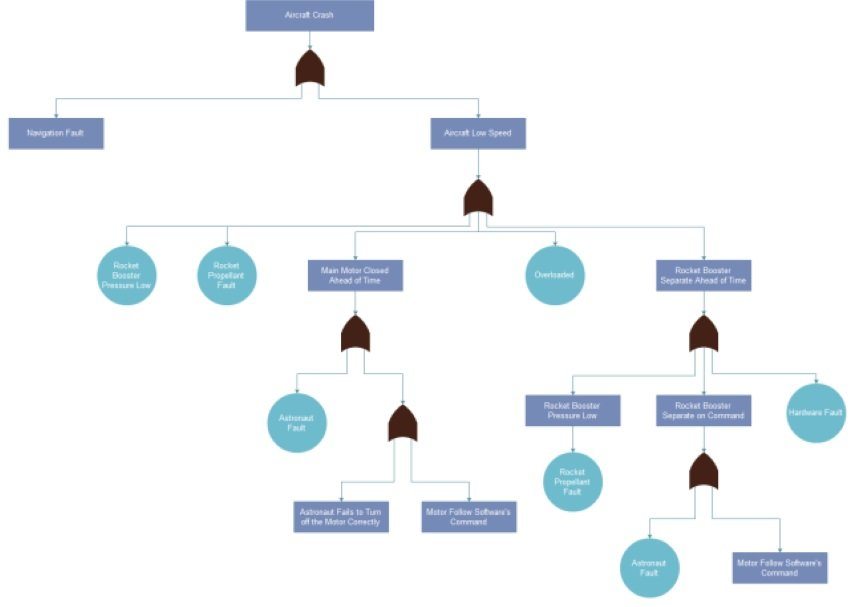
In the first Fault Tree Analysis example, you will see the causes of an aircraft crash. It can be a navigation fault or low aircraft speed. Furthermore, several reasons for aircraft’s low speed develop as the primary motor closed ahead of time, or rocket booster separates ahead of time, etc.
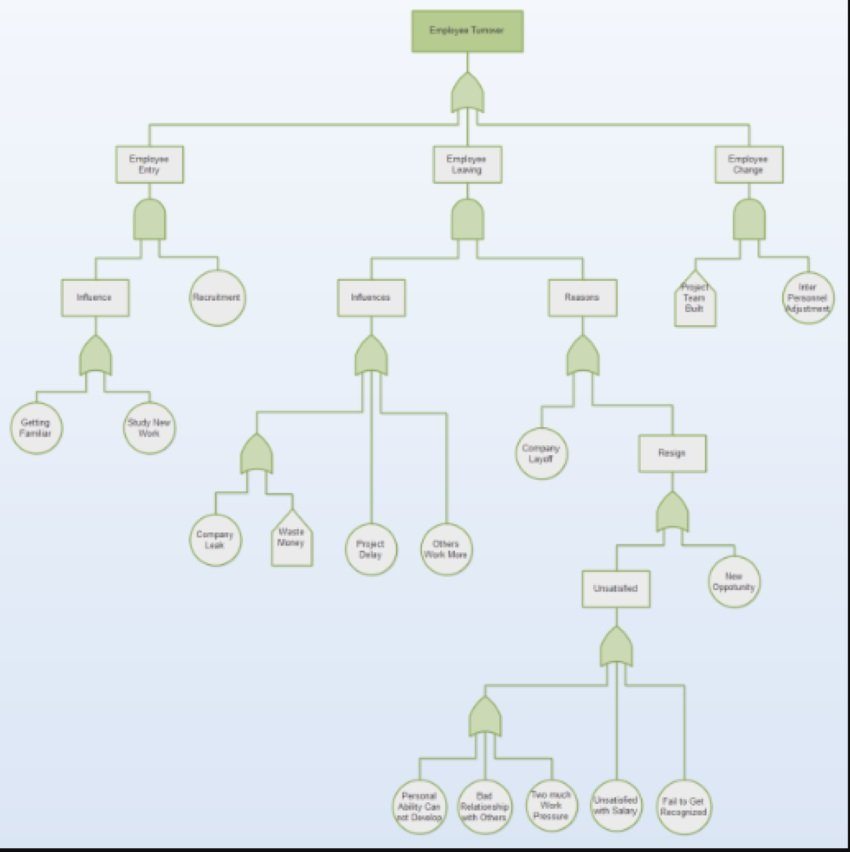
Employee Turnover is much helpful in finding out the potential causes of employee turnover and is divided into three main categories, such as employee entry, an employee leaving, and employee change. Below you can see the complete analysis of employee turnover.
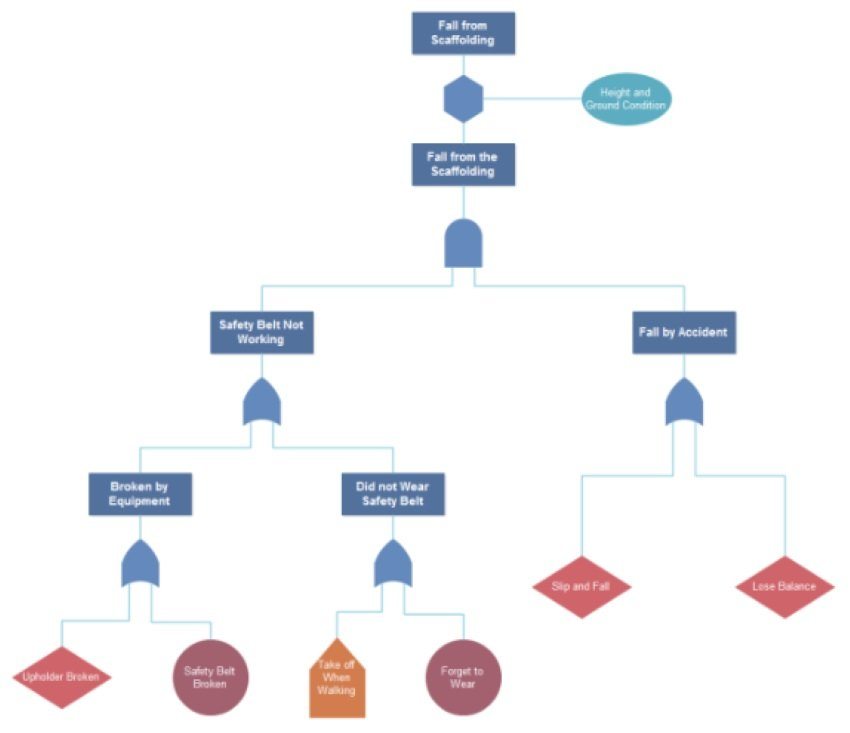
You can conveniently analyze fall from scaffolding through Fault Tree Analysis. There can be two potential causes, such as fall by accident, and safety belt not working. Safety belt not working is further divided into ‘broken by equipment,’ and ‘did not wear a safety belt.’ In this way, ‘Fall by accident’ is also analyzed with this diagram.
4. Why is Fault Tree Analysis Important?
A risk-based path depicted through Fault Tree Analysis is the primary concern for finding the root cause of the unwanted event. Moreover, it also helps the problem solver to look for events leading to the root cause of the base-level event.
Purpose of Fault Tree Analysis
- The main goal is to determine potential causes in system failure after the happening of an undesirable event.
- The probability of top events can also be evaluated using statistical or analytical methods.
- The calculations involved serve the primary purpose of maintainable and reliable information such as failure rate, failure probability, and repair rate.
Benefits of Fault Tree Analysis
- A visual representational record of a system is determined to show the logical relationships between causes and events that lead to system failure.
- The analysis helps others to understand the results and pinpoint the weaknesses quickly.
- At the same time, it also lays the foundation for any further evaluation and analysis.
- When you make upgrades or changes to the system, with Fault Tree Analysis, you already have steps for possible changes and effects.
- A Fault Tree diagram can also be used to maintain procedures and design quality tests.
5. When to Use Fault Tree Analysis?
Well, every industry needs Fault Tree Analysis for:
Probability of failure: FTA is typically used to find the probability of failure in any system or event. With the help of a fault tree diagram, you can easily calculate the probability of failure by analyzing basic events at the lower level of a system. When you read the failure analysis, you can calculate the probability of success in the next step. You can also use it in project work to identify possible failures that might occur in the system.
Defining Top-level system failures: Fault tree analysis is commonly used to define systems to the basic level. A fault tree diagram moves branches from top to bottom while defining every basic level event and its immediate causes. It helps you identify the cause of Top-level failures in the system.
Identifying system characteristics and next-level events: It helps you understand the system's characteristics and chain of events. The top to bottom fault tree diagram identifies the chain of next-level events that can happen and possibly cause failure in the system. It chains all of the events together and creates a failure path for a better analysis.
The root cause of an event using logic gates: FTA identifies the root cause of failure in any event. When it comes to designing a system, finding the reason behind failures and fixing them gets complex. Fault tree uses logic gates to reach the root cause for any positive or negative events in the system. It analyzes the faults in the system to identify negative events that cause failure. It also defines the positive events that make the system run properly.
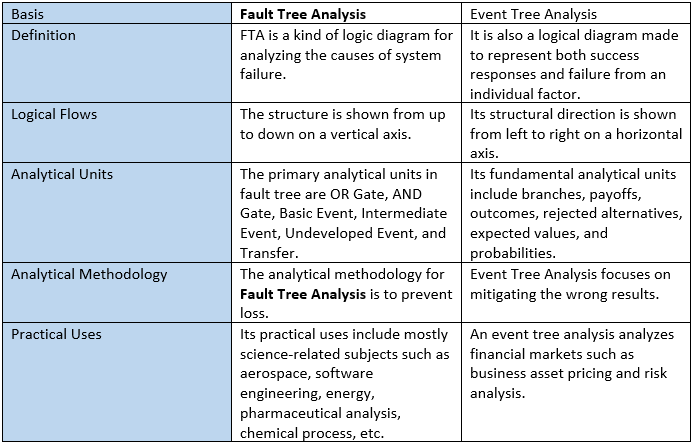
6. Fault Tree Analysis VS. Event Tree Analysis
Here are some points of difference between Fault Tree Analysis and Event Tree Analysis.
7. Limitations of Fault Tree Analysis
Well, Fault Tree Analysis also suffers from several limitations.
- You need to foresee and evaluate first the undesired event. Thus, you have to anticipate all contributing factors to the cause.
- The effort sometimes may prove to be very expensive and time-consuming unless you equip certain skills to analyze the FTA yourself.
- If the reader doesn’t possess skills, then Fault Tree Analysis may not be desirable to use.
8. History of Fault Tree Analysis
Fault Tree Analysis is a visual display of risk evaluations and safety analysis at the system level. H A. Watson from Bell laboratories introduced the concept of fault tree in 1962 to the U.S air force. With its brilliant results in the Minuteman launch control system, the Fault tree became an essential tool for system design development and analysis. In 1966, the aerospace company Boeing adopted the concepts of FTA to create a multi-phase fault tree that could analyze up to 12 phases of system failures.
The fault tree theory kept on advancing with the help of various key individuals. It led to the creation of fault tree algorithms and software that used FTA codes. With its huge impact on the aerospace industry, the nuclear industry also adopted FTA to develop nuclear power plants. Later, the chemical industry also took part in using the benefits of fault tree diagram and after that robotics industry also adopted this concept.
9. How to Perform a Fault Tree Analysis
Performing a Fault Tree Analysis is comfortable with the best online tools, such as EdrawMax Online. The recommended tool is free up to three projects and uses a straightforward interface.
Factors to be considered before making a Fault Tree Analysis diagram:
- Identify the failure at the top event.
- Identify and link first level contributors to the top event with logic gates (AND, OR).
- Identify and link second-level contributors to the top event with logic gates.
- Classify minimal cut sets.
- Evaluate the fault tree analysis.
Scan Now


Now, move on to the steps to create the Fault Tree Analysis Diagram with Edraw Max Online
Firstly, open the official site of Edraw Max Online. You need to sign up with the site for access to free templates and the creation of the project.
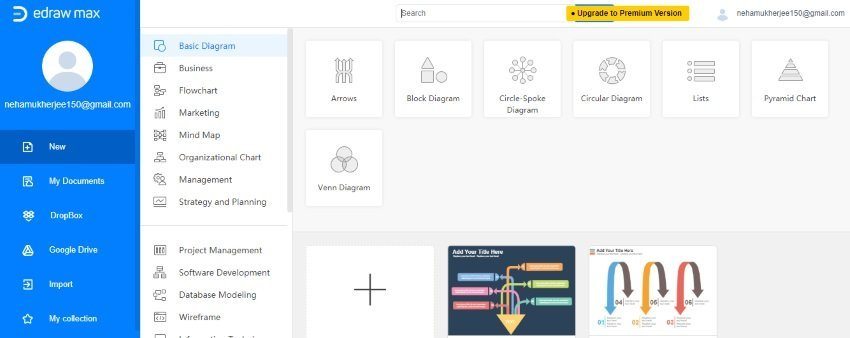
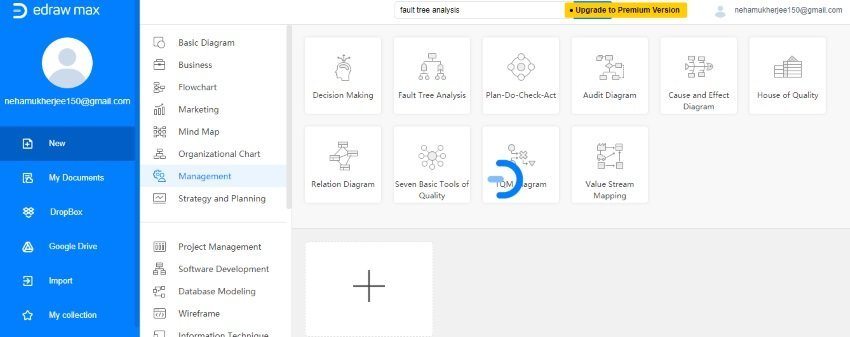
In this step, you can either search Fault Tree Analysis or click Management from the sidebar. Then, click the Fault Tree Analysis presented in the main interface.
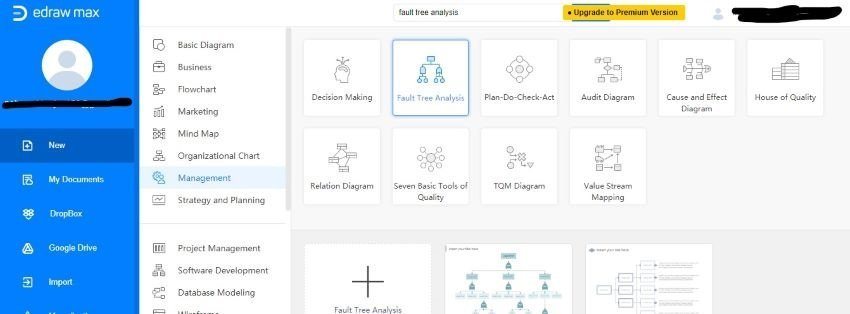
Now, you need to open the Fault Tree Analysis template from the following free templates provided in the same window. There are various premium or free options available. With a premium account, you can create unlimited projects. On the other hand, the free version allows you to create only three projects at hand.
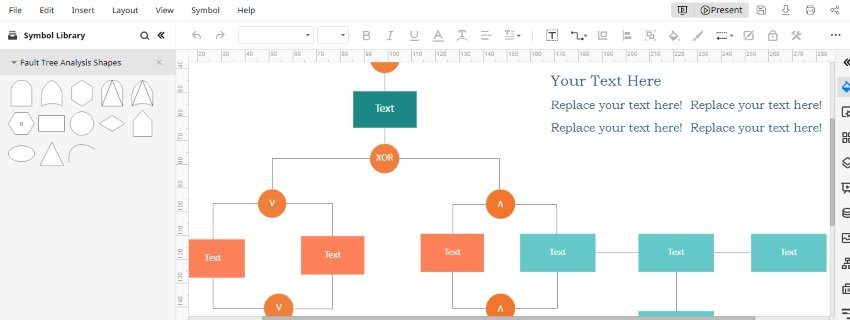
Open any of the free templates available and start creating your customized diagram from it. You can choose from various symbols and shapes provided. It is quite simple to create an FTA diagram with EdrawMax Online.
10. Fault Tree Analysis Diagram FAQ
What is Fault Tree Analysis used for?
We use fault tree analysis to get to the cause of failures at a system level. We draw a fault tree diagram that uses Boolean logic to analyze basic events in the system. Every event in the diagram branches lower-level events and their immediate causes. With its help, we get to the crux of events causing failure at the top level.
What is Fault Tree Analysis in safety?
FTA is also commonly known as a risk management and safety analysis tool. It classifies the design and architecture of a system and finds safety-related functions. With it helps you can easily identify both high-level and low-level safety-critical failures in the system.