Free Editable Food Infographic Examples
1. What is a Food Infographic
Infographics, particularly Food Infographic, are prominent visualizations used in digital marketing to transmit facts or knowledge that may be difficult to pronounce or explain in textual content or maybe too complicated for the reader to comprehend. An infographic may assist you in creatively describing a process or presenting facts that will capture the audience’s interest and contribute to the design aspect of the material. Readers are often immersed with online material for a shorter amount of time in content marketing: capturing their curiosity and conveying information without rapidly losing them is critical to attracting your audience.
2. The Food Infographic Examples
Food Infographic are a type of infographic that helps to describe dining or a nutrition process, clarify the stages in a dish, split down the results of a particular meal, or detail data about cuisine that has been provided. These visualizations are used not just to break down facts into a more intelligible manner but also to visually captivate the reader, frequently by encouraging them to discover more about the theme.
Thus, analyzing various Food Infographic examples is mandatory to visually attract the audience and compliment your ideas. We will now be breaking down some of the famous Food Infographic examples so that you will have a clear picture when you create your own infographic.

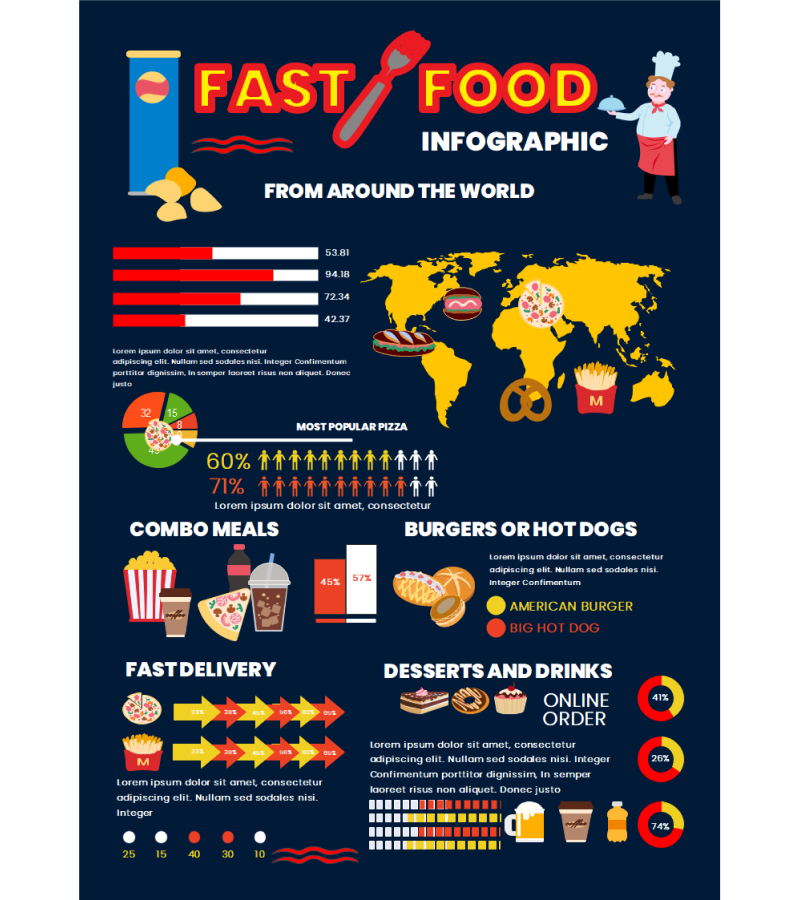
Example 1: Food Infographic
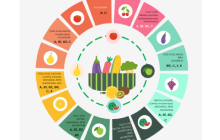
This food infographic depicted in the above diagram is intended to clearly demonstrate a food/beverage idea. The infographic is organized into six categories and includes various vibrant food imagery. The arguments are presented in such a way that they both are thorough and supported by research information and data. To agree with the idea, the statements are expressed simply and unambiguously. Each assertion is accompanied by statistical data in order to be more verifiable. Every element is linked to a relevant symbol, which allows us to connect the infographic picture. This might be decided by the priority of the operation or the reading order.
Example 2: Food Infographic Template
It's great to grab people's attention right away using data and eye-catching infographics. This food infographic template depicts several fast-food options, each with a ratio. This may be used to demonstrate the proportion of a food item's utilization in a marketplace. The following infographic depicts fast food paired with a unique product to give it a distinct flavor. This may be used to demonstrate culinary fusion.
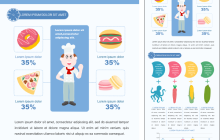
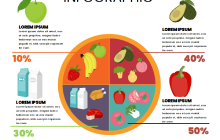
Example 3: Healthy Food Infographic
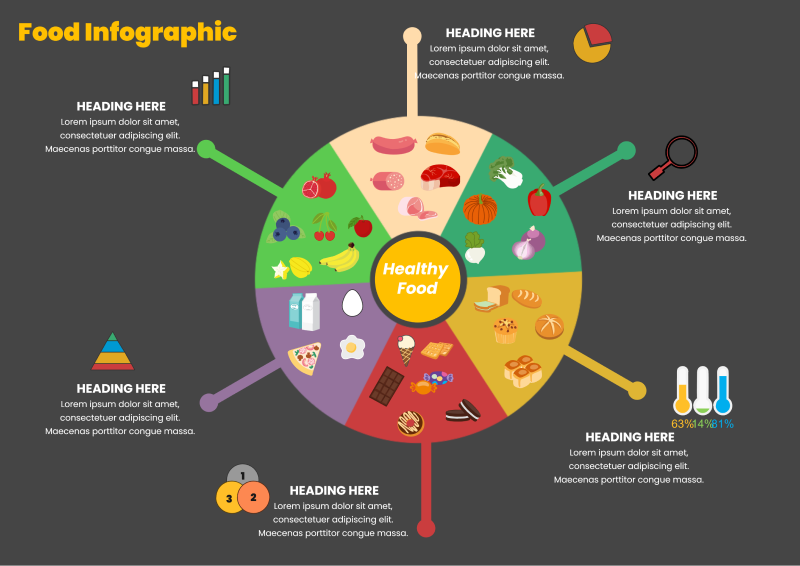
The above-mentioned healthy food infographic may be used to demonstrate the necessity and benefits of eating properly to the general audience. The infographic has an appealing concept with attractive shades that draw the public's attention to the particular topic. It may be used to provide healthy food alternatives with a percentage to represent those who select it as part of their balanced lifestyle. This will assist in explaining to the audience the necessity of the specific food in eating nutritiously in an exciting and aesthetically attractive manner.
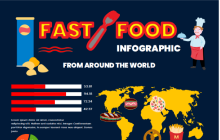
Example 4: Fast-food Infographic
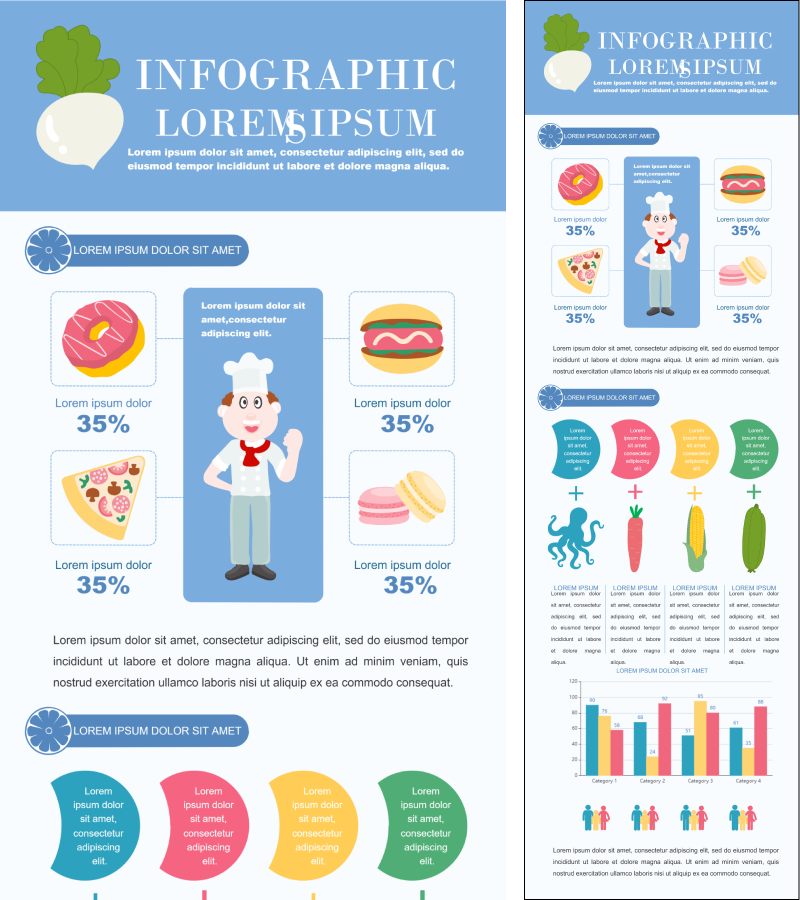
Fast food infographic uses a creative blend of patterns, images, a sleek style, and information to present a large amount of information more understandably and systematically. The exclusively editable infographic is a good contender for displaying food intake in various families. It may also be used to explain the necessity of nurturing and supportive nutrition and health.
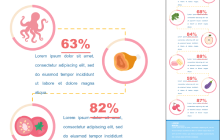
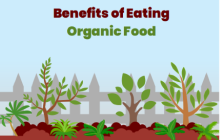
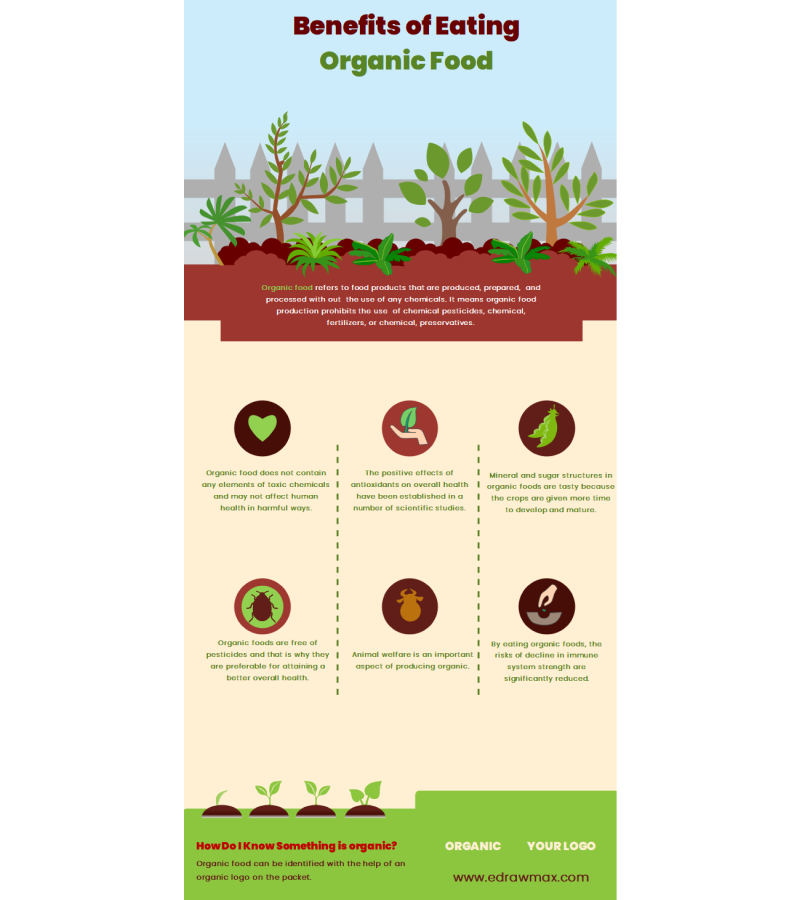
Example 5: Organic Food Infographic
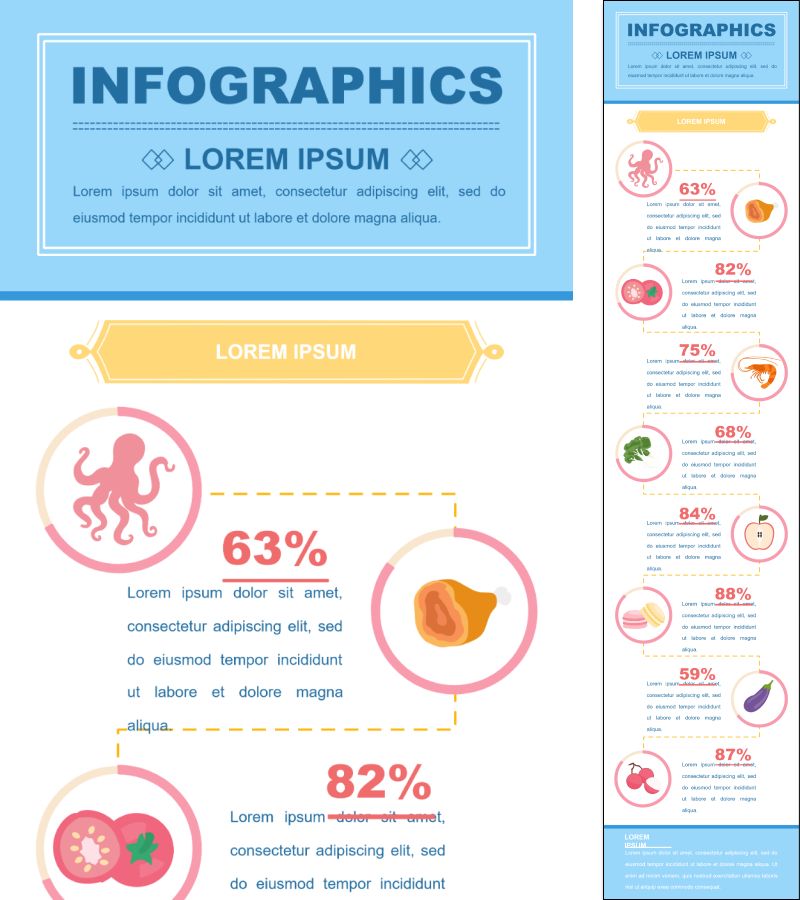
This organic food infographic begins by displaying the percentages of various servings required to produce a nutritious meal. The infographic is wonderfully designed and makes it simple to convey the intended information. The following infographic describes the many stages involved in making nutritious food. Likewise, a straightforward and Example-by-Example approach is employed to show the method for simple delivery. Finally, a comparison of various dietary products regarding their nutritional effects on the human body is presented.
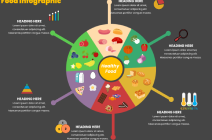
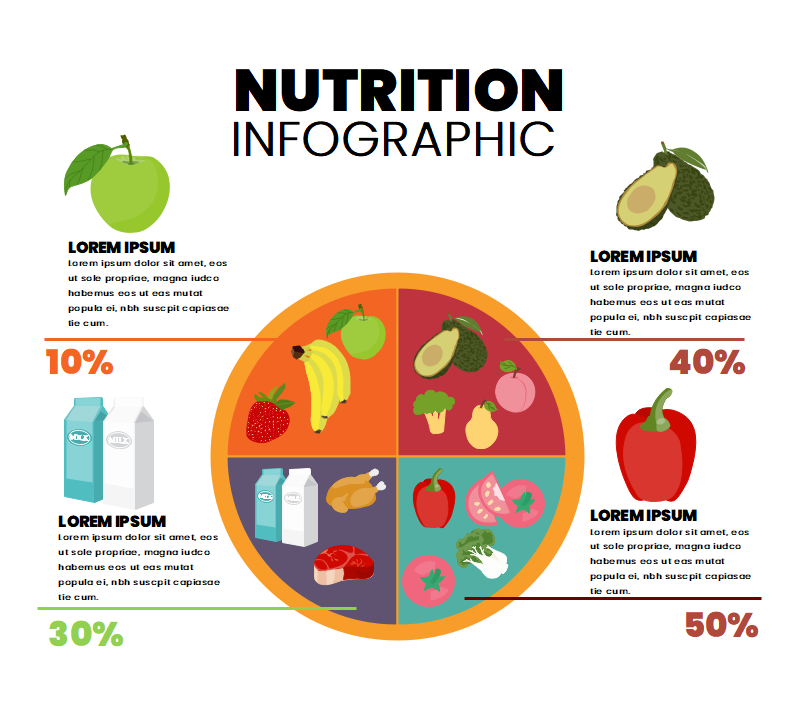
Example 6: Nutrition Infographic
In this beautifully explained nutrition infographic, each of the nutritious food that is mandatory for a balanced diet is presented. With a unique visualization of the foods that are pleasing to the eye, some of the nutrition facts are also shared, such as the carbohydrate value, proteins, and triglyceride. As soon as you understand everything that is there in this infographic, you will surely be intrigued to implement such ideas into your visualization.
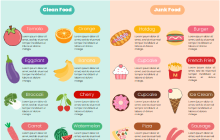
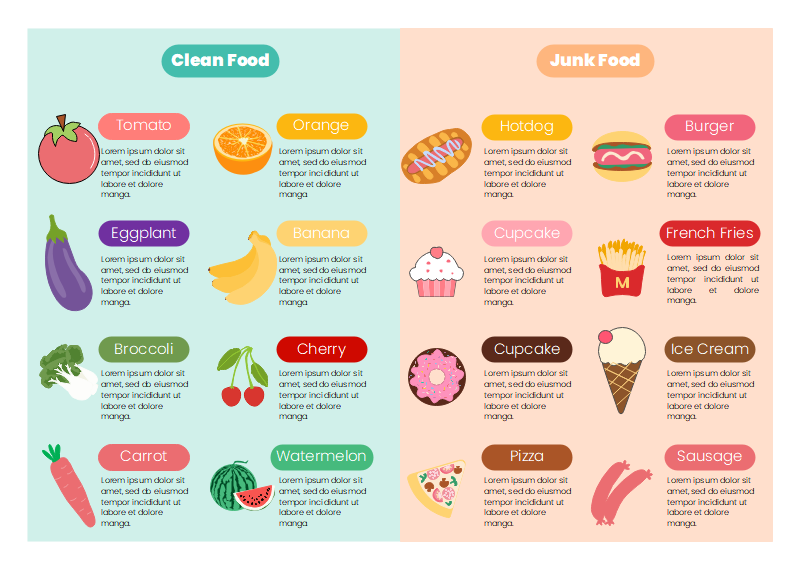
Example 7: Junk Food Infographic
Any kind of comparison is sure to strike the attention of the audience. Here, this junk food Infographic is highly creative to compare the values and nutrition facts with organic foods. By doing that, you are creating a good food infographic and gaining a lot of traffic since the majority of people always believe that junk foods are the "Silent-killers" of human beings.
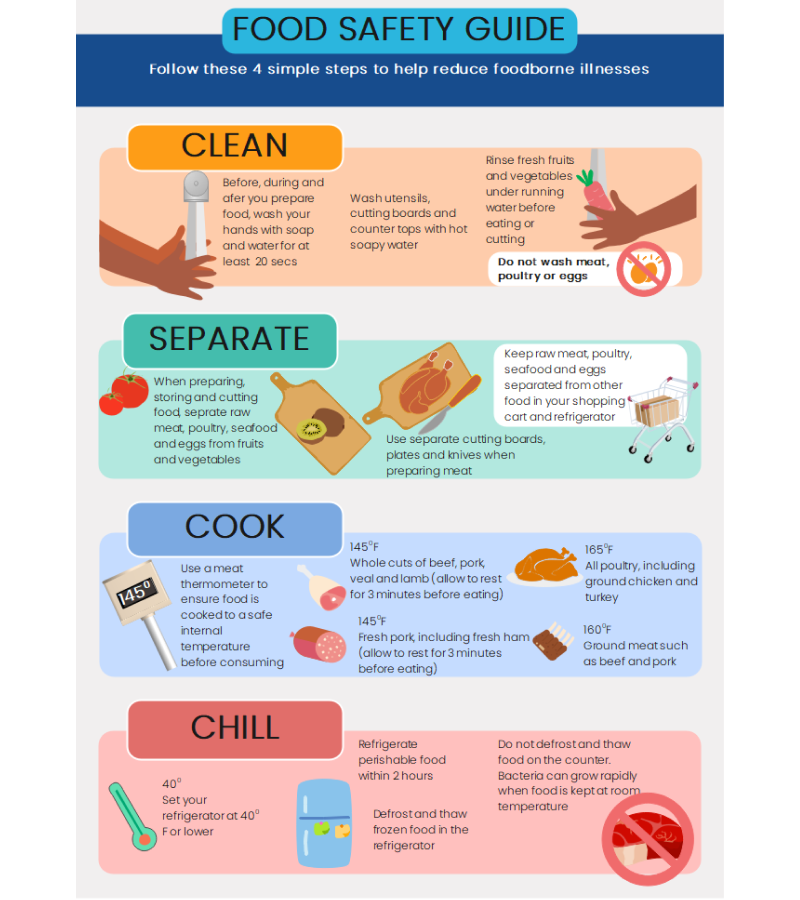
Example 8: Food Safety Infographic
This food safety infographic is quite unique from many other safety infographics available online. The infographic gives a detailed description of the dos and donts with incorporating an additional concept of a power outage. Instead of providing blunt safety instruction, this creative infographic urges some unknown facts, also a visually attractive one.
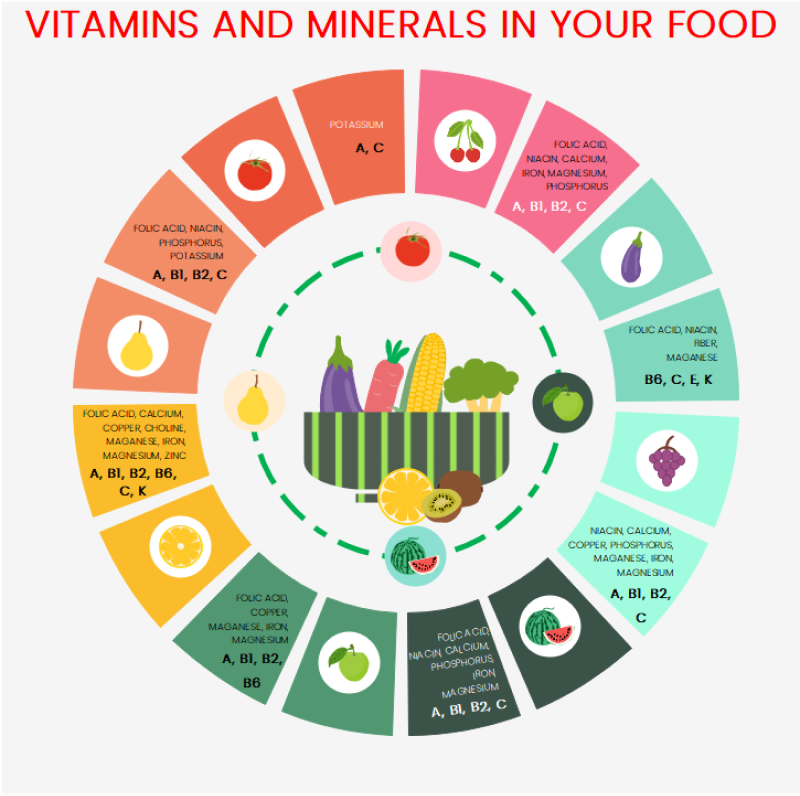
Example 9: Healthy Eating Infographic
A healthy eating infographic depicts various food products and their associated nutrients. Food is made up of specific nutrients, as illustrated by the infographics below: proteins, carbs, triglycerides, minerals, vitamins, and water. All of these are required for life, development, physiological activity, and tissue regeneration. Real food, such as steak, poultry, vegetables, eggs, and beans, is full of antioxidants and micronutrients that promote heart health.
3. How to Design a Food Infographic
Designing a food infographic demands creativity and knowledge. Not everyone could draft their food infographic. If you think you have what it takes, then follow these easy steps!
Step 1 - Eye-catchy title:Since a food infographic may be distributed or showcased by a search engine, it must have a title. The headline should not only be eye-catching, but it must also inform viewers about the information they are going to view.
Step 2 - Get the facts right!:If the information of your food infographic is based on facts and analytics, utilize a decent balance of verifiable sources to make the visual look more credible. Suppose your data is based on a sample of only 100 individuals from a single source. In that case, the data may appear to be disorganized rather than reliable data about the product you are addressing in your infographic.
Step 3 - Emphasize unique visuals: The images you will use are one of the most crucial aspects to consider while producing your food infographic. While the infographic is designed to make facts and content more approachable, the graphic will assist in writing the tale and keeping readers engaged.
Watch this video to learn more. If the video doesn't play, please visit it at YouTube.
4. Top Online Infographic Maker
Now that you know the basics of creating a unique and attractive food infographic, where would you design them? Worry not. With more than 280 types of diagrams, Edrawmax has got your back! Edrawmax is an online infographic maker that aids you with your presentations, flow charts; you name it! Each of the diagrams and templates in the Edrawmax is unique and provides a great platform to bring your ideas into an intriguing infographic.
5. Key Takeaways
Since readers rely on other perceptions to comprehend food-related knowledge, creating infographics for food-related topics might be difficult. Recognizing the complexities that might arise while designing a food infographic and what makes a food infographic engaging to readers will assist you in overcoming these challenges. Finally, you want to provide your readers with eye-catching pictures that will help them absorb information and engage with your product! Find more infographic templates.