How to Create a Comparison Chart
1. Introduction
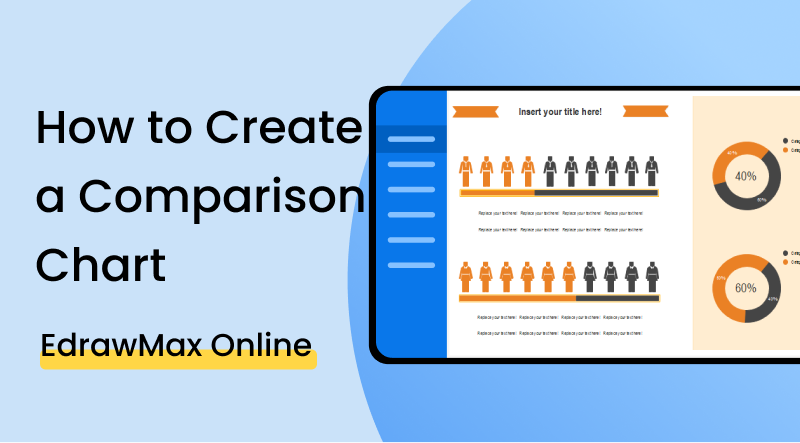
A comparison chart is not the name of a particular graphical representation. It is a broad term that brings in its purview all sorts of diagrams made for a comparative analysis of two or more elements. Comparison charts help the reader distinguish between multiple items by observing their cons, pros, and points of distinction. Let's look at a stepwise tutorial on how to create comparison chart.
2. How to Create a Comparison Chart
Comparison charts are usually needed when any comparison or juxtaposition has to be drawn between some variables or values. These charts are not fixed to a certain format/layout. Rather, bar graphs, doughnut charts, line charts, and other similar graphics are all examples of the same as long as they provide a comparison between different objects. Such charts can be useful for showing the benefits and drawbacks of a certain item in contrast to another. They can also help display how a set of values is better than another similar set of values. There are a couple of things you should note before drawing a comparison chart, such as:
1. Determining the type of graphic required
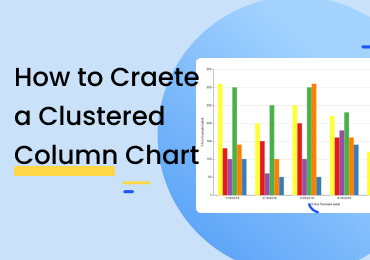
When creating a comparison chart, there are different types of graphs and schematics that you can choose from to illustrate the details. You can opt for a bar graph or a pie chart etc. These various types are helpful for specific situations. A pie chart is used when values have to be shown as a percentage of the whole, while a clustered column chart is used when different values have to be presented on the same scale. You should take stock of the data you need to depict and then choose the type of representation accordingly.
2. Noting down the different sets of values and categories
After you have selected the type of graphic that is ideal for showing your data, note down the particulars and details in a text file or on a piece of paper, a written compilation of the data will be helpful if you want to double-check the values or refer to any aspect of the info during your work.
3. Provide the legend/key
In most schematics and diagrams, values are differentiated based on their color. A clustered column chart has a variety of colored bars in a group, while a pie chart features polychromatic slices. To help the reader understand what every shade represents, it is important to include a key alongside the diagram.
If the video doesn't play, please visit it at YouTube.
3. How to Create a Comparison Chart with EdrawMax Online
You can start as a free user by default and access the basic features. To sign up, click on EdrawMax Online, and select the 'Create Account' option.
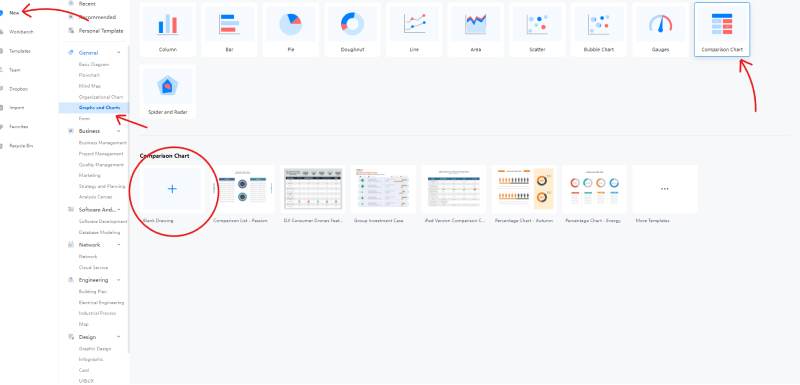
Click on 'New' on the left menu and then from the list of categories, go under 'General' and select 'Graphs and Charts.' Once the window opens up with the different chart types, click on 'Comparison Charts' and open a blank drawing. This will take you to the empty canvas. (New > General > Graphs and Charts > Comparison Chart > Blank Drawing).
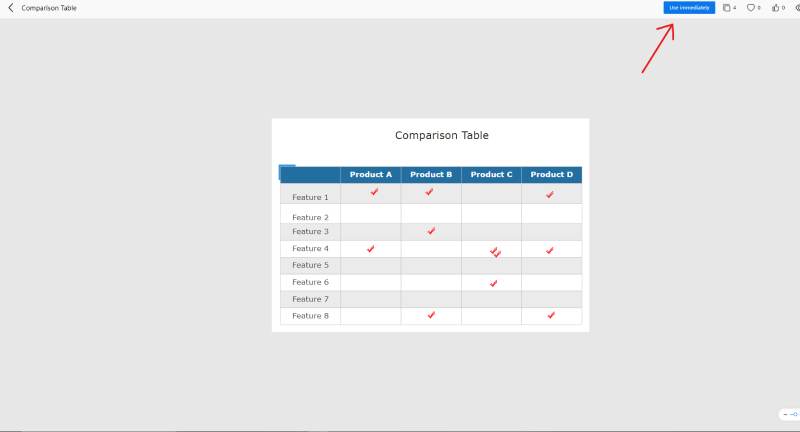
The template gallery is a nice little perk that you can use with EdrawMax Online to save some time on your diagram. If you are not sure whether you can make a decent chart, use a premade drawing uploaded by other users instead. You can use the boilerplates without editing them a lot. Just change the names and details, and you're good to go.
If you have decided to build the chart from scratch, you will have to add the shapes and symbols yourself. But thanks to the user-friendly interface, this isn't too much of an issue. All you have to do is click on an icon from the library on the left and drag it to its position on the canvas. You can later move it around using this same gesture.
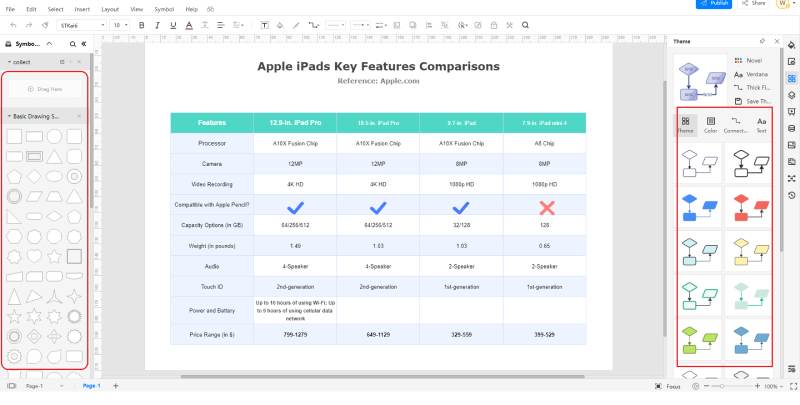
By changing the theme, you can modify the color combinations and shades and the connectors and text featured in your drawing. This menu can be accessed from the strip on the right. You can individually target colors, connectors, and fonts, or you can apply a style that collectively changes all three at once.
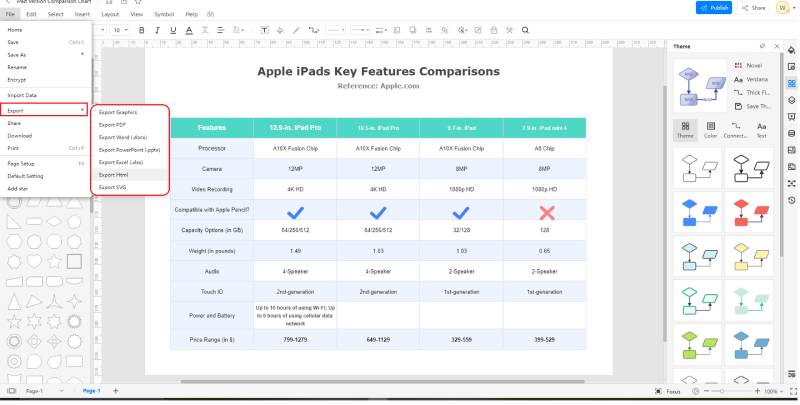
When working online, your file is being periodically saved to the cloud. This is done to resume where you left off in case the tab or window is accidentally closed. You can use the 'CTRL + S' shortcut to trigger this online save manually. The 'Export' feature, on the other hand, lets you convert your work to a popular file format so you can easily download, view, and share it. Supported file types include SVG, PDF, .docx, .xlsx, and .pptx etc.
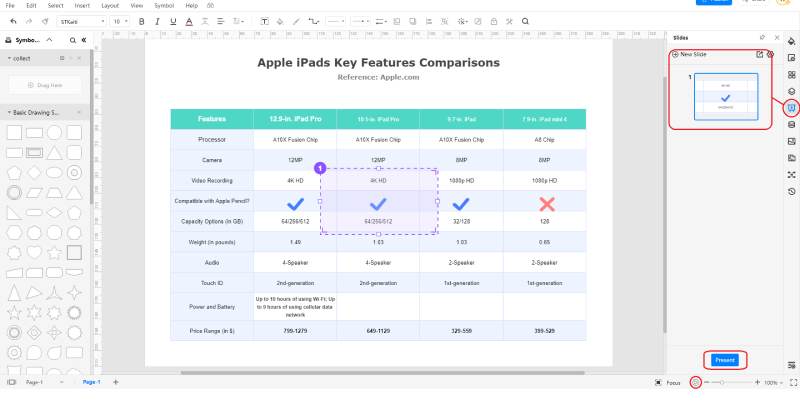
If you want to present your comparison chart right from the drawing window, go down to the bottom right corner and click on the small play icon. This will start a slideshow; where you can show the different pages of your file one by one. For coming up with a more customized presentation, you can use the 'Slide' feature. This can be accessed from the right menu bar. When you click on 'New Slide,' a purple selection box will appear on the canvas. You can move it around and change its size. To make a slide of a selected canvas portion, fit it inside the purple box.
4. Expert Tips for Making Comparison Chart
Decide the chart type wisely
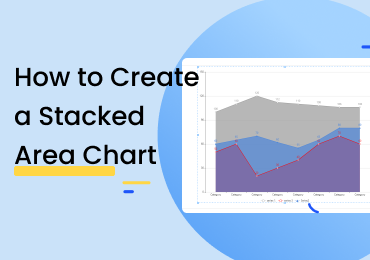
The key to deciding the type of representation for the comparison is in the number of included values. A line chart or a stacked area chart can be suitable for comparing two or three values. For ten to twelve values, a bar graph is the better choice. If, however, you are comparing just two items, but the points of distinction are numerous, you can draw a table instead.
Use the right colors
Generally, the advice for using colors in graphical representations is to use contrasting shades so that the different areas are easy to make out. But, if we are talking broadly about comparison charts, it should be understood that too much of a contrast won't always be the best way to go. For example, you're making two line graphs. One is for comparing the populations of two cities while the other is for comparing the average number of houses. What you can do here is place both these graphs side by side. In one of them, you can use two different shades of blue for differentiating the lines, and in the other, you can use two shades of gray. Since the nature of the measurements is the same in each graph, you can choose two colors with the same tone. So don't always use contrasting colors; use the right ones.
Don't hesitate to get a little creative
You can fetch the icon sets from different categories by clicking on the 'Add Shapes' button in the library. That essentially means that you can use all of the icons offered by EdrawMax Online in any single drawing. Thus, if you are drawing a comparison chart, you can add some clip art here and there to give the thing an artistic touch. But don't go overboard; otherwise, it's going to look childish and messy.
5. Key Takeaways
If you don't know how to create a comparison chart using EdrawMax Online, check out the above guide for a stepwise tutorial. Even if you are a total rookie, you can utilize the awesome features offered by the application to come up with professional-looking representations. Find more comparison chart examples.