How to Create a Stacked Area Chart
1. Introduction
A simple area chart is a representation that shows a fluctuating line on a Cartesian plane depicting the increase and decrease of a value. The area under the line is shaded. Similarly, a stacked area chart features not only one but multiple such lines and shaded regions. They are typically used for understanding the component breakdown of a data group. This guide will look at a stepwise tutorial on drawing the same using EdrawMax Online.
2. How to Create a Stacked Area Chart
Creating stacked area charts is usually required when we need to represent a particular value that is made up of different components and elements. Unlike overlapping area charts, the baseline for each shaded region is not the x-axis. Instead, the start of every part is taken from the region's point before it comes to an end. To understand this better, take a look at the below screenshot. The baseline for the red area is the x-axis. Thereafter, the base edge of the blue region will be taken as where the top of the red part is ending.
1. Note the total
It should be understood that the height of the top-most section represents the total value of the data. Once you are done making the chart, you have to check and see if the total conforms to the point where the end of the line is meeting. If it's not, you have probably erred somewhere when entering the values. Thus, it is essential to note the total before you begin the work for this double-checking.
2. Create a legend
As with many other similar graphs and charts, the distinguishing feature between the different regions is the color used to shade them. Be sure to add a legible key/legend to your work to help the reader understand it better. With area charts in general, the key is provided below the figure.
3. Pay attention to the order
When making a stacked chart with EdrawMax Online, you have to enter the particulars via a spreadsheet (more on this later). You should take special care to start with the smallest values and then work up to the higher ones. If you accidentally add a smaller region after a larger one, it will still show up, but the color will be affected.
If the video doesn't play, please visit it at YouTube.
3. How to Create a Stacked Area Chart with EdrawMax Online
You can start as a free user by default and access the basic features. To sign up, click on EdrawMax Online, and select the 'Create Account' option.
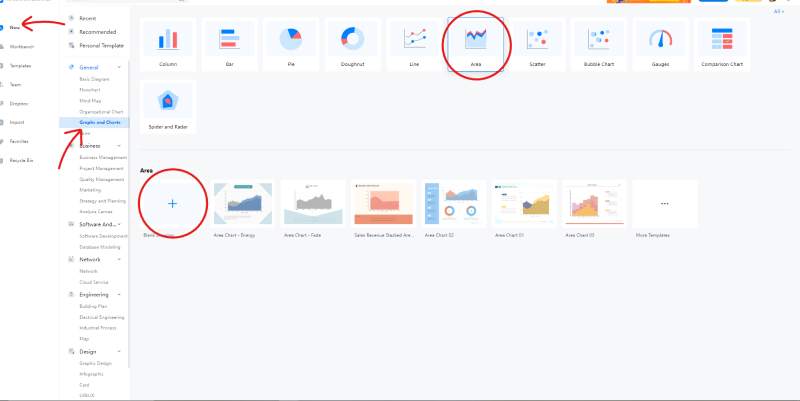
Once logged in, go back to the homepage and click on 'New' from the left-most menu. A list of categories will open up. Go to 'General' and select 'Graphs and Charts.' Click on 'Area' and then open up the empty canvas by clicking on the 'Blank Drawing' option underneath. (New > General > Graphs and Charts > Area > Blank Drawing).
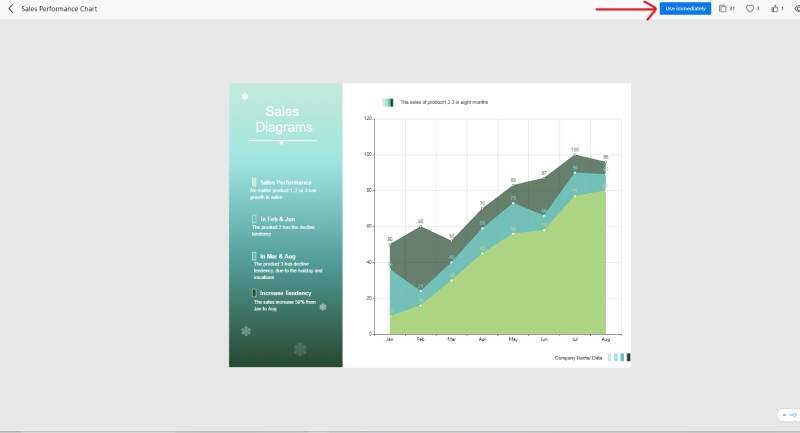
If you don't want to start working with a blank slate, you can use a premade template instead. Visit the gallery from the 'Template' option on the left menu. Search for 'Area chart' and choose your template by clicking on it. At the preview screen, select the 'Use Immediately' button to get it in your canvas instantly.
If you have opted to start from scratch, you will see that the library on the left has various charts in it. If you hover the cursor over any of them, the name will be displayed. You can click on your desired chart and bring it to the canvas with a dragging motion. Once it's there, you can edit it by selecting it double-click. A spreadsheet will open up on the right to change the series names and values etc.
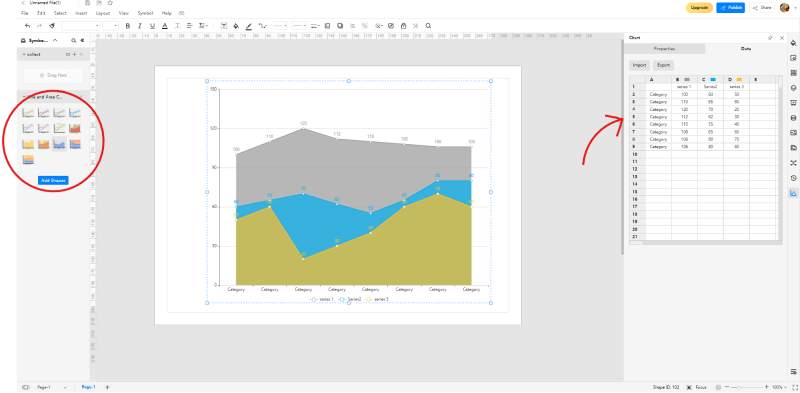
Suppose you want to change the color palette used in your graph, head over to 'Themes' on the right menu bar. You can change the color combinations and the background of the canvas to give your chart a unique look.
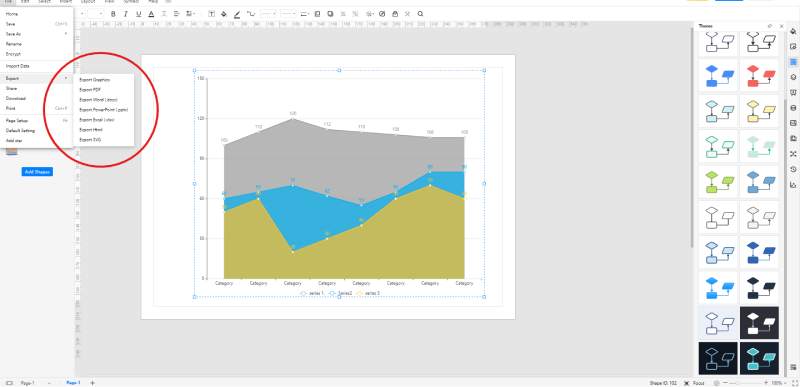
If you want to save your work to the EdrawMax Online cloud, use the 'CTRL + S' shortcut. This will save your file to your account, and you can edit it later on whenever you want. Doing a cloud save is a good way to leave off unfinished diagrams and resume them later. On the other hand, if your chart is done and ready, you can export/download it in a format of your choice. From the 'File' menu at the top left, select 'Export.' Choose your file type, and your download will begin. Note that exporting is only available for paid users.
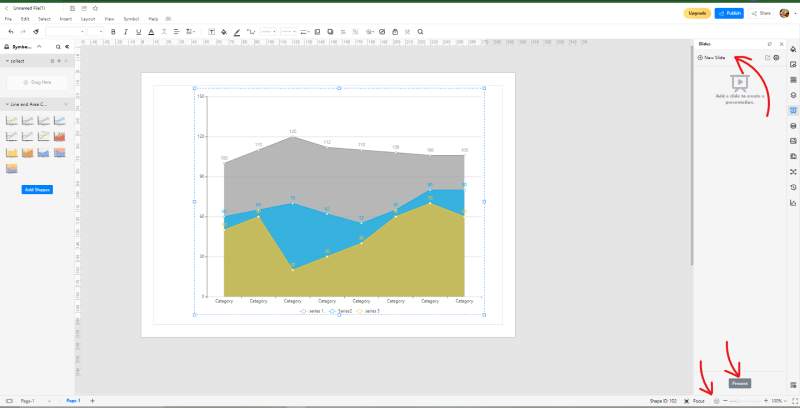
With EdrawMax Online, you can present your work to an audience without leaving the software. Instead of manually creating PPT slides, you can use the 'Slide' option on the right menu bar to develop a customized and tailored presentation. You can select which parts of your stacked area chart to include in the slide by adjusting the purple selection box. Alternatively, if you are looking for something even more quick and impromptu, start a slideshow by clicking on the play icon at the bottom right.
4. Expert Tips for Making Stacked Area Chart
Use your colors wisely
Whenever you have to distinguish between different sections or regions, use contrasting and vivid colors to help the reader make the differences.
Limit the number of sections
Remember, it's a stacked area chart, not a rainbow. Stacked charts are good for showing 4-5 sections. Any more than that could be a bit too complex.
Pay attention to the labels
During the whole coloring and shading process, you could lose sight of the chart for reading. The numbers, as well as the texts on both axes, should be appropriately sized and spaced.
5. Key Takeaways
While making a stacked area chart could be a troublesome task on paper, it is easy to use EdrawMax Online. Using the various tools and premade templates, any user with nil experience can develop adroit-looking graphs in a matter of minutes. The above guide illustrates how to create, edit, decorate, save, export, and present your charts with EdrawMax Online. Find more area charts examples.