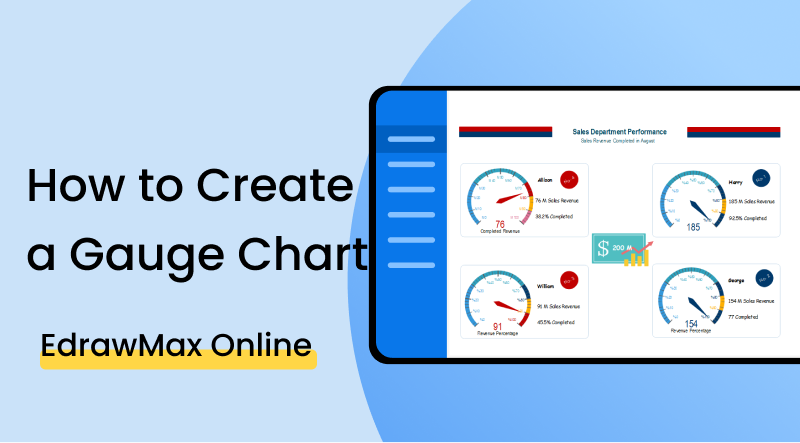
How to Create a Gauge Chart
1. Introduction
A gauge chart is a circular-shaped graphic in which the readings are shown by the needle placement along the arc or scale. The shape of a typical gauge chart resembles that of a speedometer. They are useful for comparing values or representing information as a reference to a fixed criterion. This post will look at a comprehensive, step-by-step guide on how to make gauge charts with EdrawMax Online.
2. How to Create a Gauge Chart
As mentioned earlier, gauge charts are needed to represent information referencing a fixed criterion. That could not sound very clear, so let's break it down slightly. You may have seen some gauge charts with their starting portions colored green, the middle part yellow, and the end section red. These colors indicate the danger/safety zones. A needle in the green part would mean that the reading is safe and good. If it is in the yellow part, the reading is normal, while the red zone would mean straight-up wrong and dangerous. The 'fixed criterion' is the three differently colored zones in this example. Similarly, numerals and percentages can be written along the edge to provide a scale to measure the readings. When making gauge charts, let's look at some points you should keep in mind.
1. Understand the different types
There are three main types of gauge charts: Linear, Speedometer, and Angular. All three of these are suitable in different situations, and it is up to you to decide which one is the right call for your particular project. In short, a linear gauge consists of a straight line rather than a circular dial. The needle is placed along the length of the line to denote the value. A speedometer gauge is, as the name indicates, similar to the speed dials found in automobiles. It has a fully circular shape. An angular gauge is a semi-circular representation, and it has the shape of a 'D' lain sideways.
2. Determine the number of values
You can also show multiple values with gauge charts on the same scale/arc. All you have to do is add some differently colored needles with a legend explaining what each of them represents. Therefore, before making your chart, you should determine the number of readings required from the data. Adding two or more needles on the same gauge is a good way to do a comparative analysis.
3. Use dedicated software
Once you assemble all the details, pick a diagramming application to get started. You should opt for some dedicated software because you can always change and edit the values during your work. In hard form, once you draw the needle, it will stick there unless you erase it (which brings about destruction and disfigurement to the paper). Similarly, with applications, you can add decorative touches to your work and tinker with the colors, which isn't very easily done in a manual drawing. Below, we will learn how to make gauge charts online with EdrawMax.
If the video doesn't play, please visit it at YouTube.
3. How to Create a Gauge Chart with EdrawMax Online
You can start as a free user by default and access the basic features. To sign up, click on EdrawMax Online, and select the 'Create Account' option.
Click on 'New' from the left menu bar at the homepage. Go to 'General' and click on 'Graphs and Charts' from the categories. Another window will open up showing different chart types. Select 'Gauge' and then bring your cursor down to the 'Blank Drawing' button. Clicking on it will open the drawing canvas in another tab.
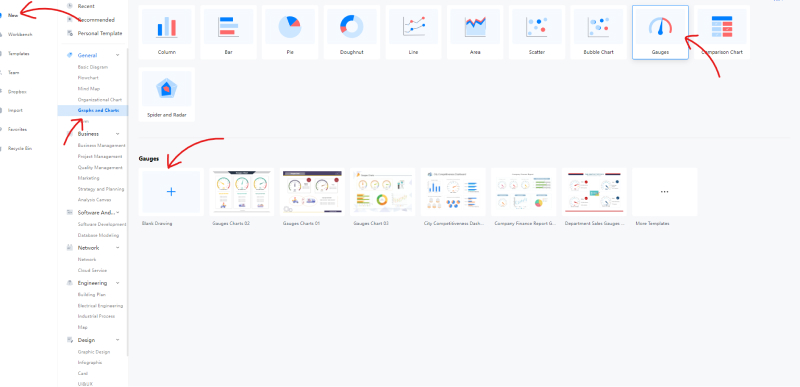
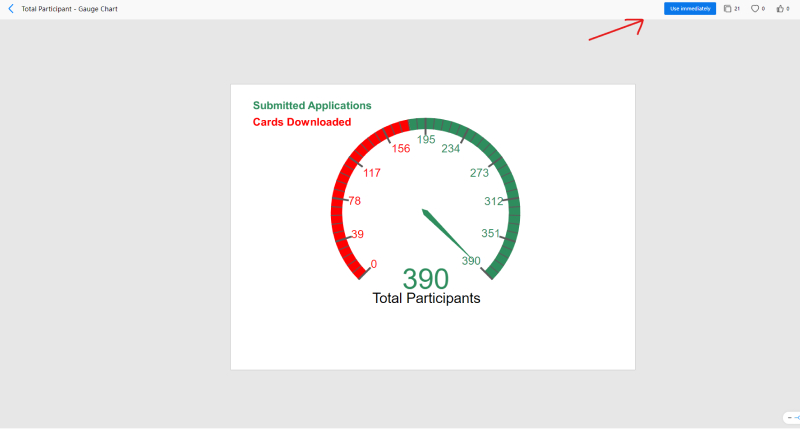
The above step will take you to the blank drawing board. Once you're there, you will have to do the rest of the stuff yourself. Consider using a template instead if you don't feel up for that or simply lack the time. After selecting a premade drawing from the template gallery, you can edit it and save it as your own. Head over to the homepage again and this time, click on 'Templates' from the left menu. The gallery will open up with a search bar on top and a list of categories to the side. You can manually search with the word 'gauge' to find the related drawings. Alternatively, you can go to the list of categories and click on 'Graphs and Charts.' A list will drop down to find the option marked 'Gauge.' Select that, and you will get all the available templates for this particular chart type. To import a template to your canvas, click on it and select the 'Use Immediately' option given at the top.
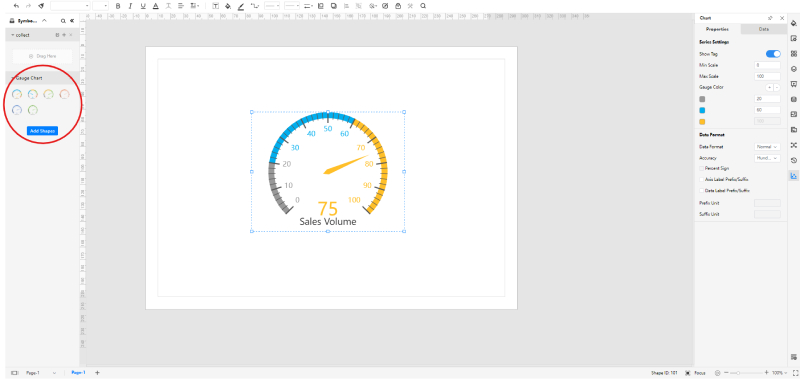
EdrawMax Online has a simple and easy-to-use interface for adding and moving shapes/symbols. All you have to do is head over to the library on the left and click on your desired icon and drag it over to the canvas. You have to make the same dragging gesture for moving anything on the board. Note that you don't have any icons in the library when making charts by default. You can only pick the type/layout of the graph. However, if you want to use icons and symbols, you can always import them from categories by clicking on the 'Add Shapes' button.
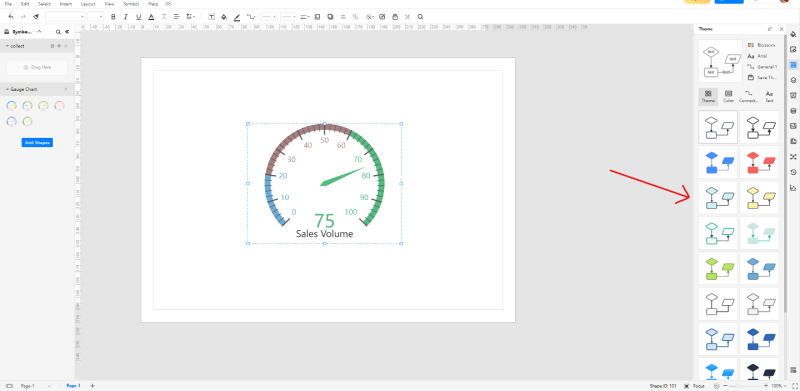
By changing the theme of your gauge, you can set the color tone to a combination of your choice. Take a look at the below screenshot, and you'll see that there are quite a few options in the menu on the right. A few of them even change the background of the canvas for a darker look. In other schematics and diagrams, you can even mess around with the connectors and text, but since those are not used in a gauge chart, you are left with the option of only editing the colors.
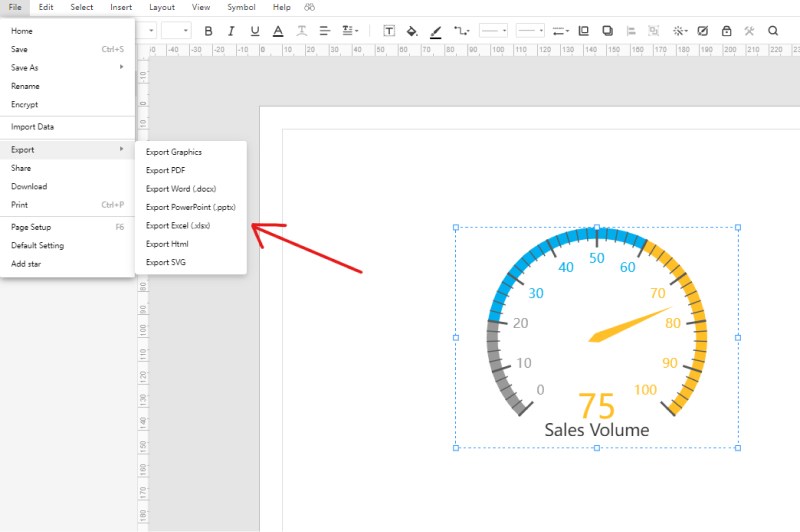
You can use the "CTRL + S" shortcut to save your file to the EdrawMax cloud. By doing an online save, you can leave off your work and then resume it by accessing the "Workbench" from the homepage. Alternatively, you can download the chart by using the "Export" feature. This basically lets you convert the drawing into a popular format such as PDF, SVG, .docx, .xlsx, and .pptx.
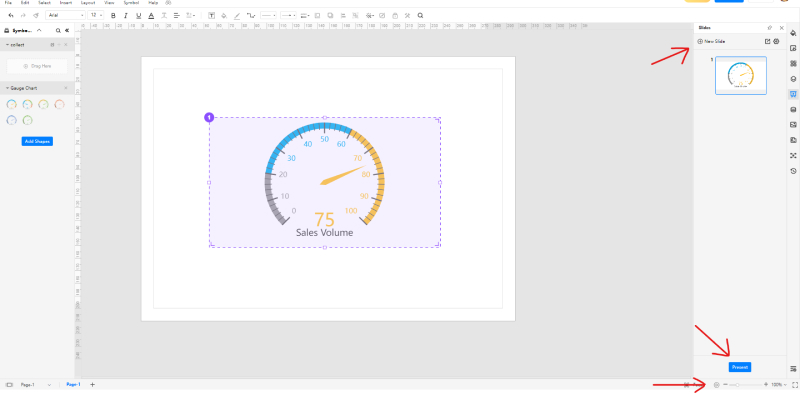
With EdrawMax, you can create customized slides using the 'Slide' tool from the right menu bar. A purple selection box appears on the canvas when you make a new slide. You can move and resize it. Whatever portion of the chart is included within this box will be made into a slide, and whatever is excluded from it will remain….excluded. If, on the other hand, you are looking to present your drawing a bit more quickly, start a slideshow by clicking on the play icon at the bottom right.
4. Expert Tips for Making Gauge Chart
Add imported icons to your chart.
This is quite a useful tip if you try to make your gauge look engaging and lively. When you open up the canvas from the 'Gauge' category, you will find just a couple of chart types in the icons library. But if you click on the 'Add Shapes' option, you can fetch the icon sets from literally any other category on EdrawMax. It is an excellent way to create diverse and information-rich charts if you are smart about this. You can add business icons to your canvas or touch them up with architectural symbols. The options are numerous.
Be careful about the colors.
Using contrasting and vivid colors is key to good readability. If you use monotone shades or matching colors to show the different regions, the reader may have to squint and peer at your chart to find the variations in the arc.
Remember the left-to-right rule.
As a rule of thumb, it is understood that the resting zero point of the needle is the left end of the dial. Thus, whenever you make a gradient or a scale, always keep the left portion of the gauge as the starting area and the right as the ending.
5. Key Takeaways
Gauge charts come in a variety of different types and forms. Before you embark on your project, it is necessary to understand which type conforms to your particular need. This guide went through a comprehensive stepwise tutorial on creating gauges charts with EdrawMax Online. The application has many categories and features, so it is easy to get a bit overwhelmed if you are a newbie. Follow the steps and consider the tips given at the end, and you won't have any trouble coming up with a professional-looking gauge chart. Find more gauge charts examples.