Can I Create Interactive Organizational Chart with JavaScript?
Is creating an org chart JS possible? Yes, you can create an organizational chart with JavaScript. The libraries and plugins to use are presented in this guide. Read more.
1. Introduction
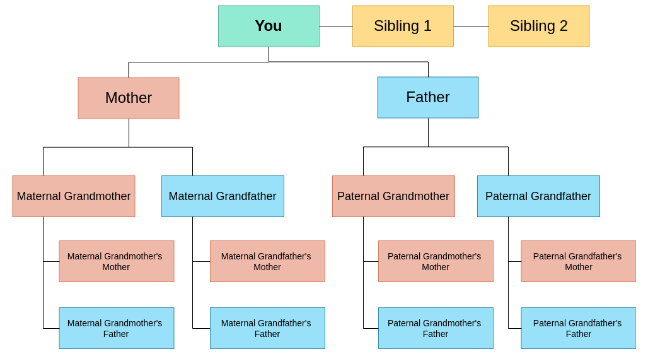
A diagram that represents the graphical representation of an organization is commonly called an organizational chart or org chart. In simple words, an org chart displays the complete hierarchy of an organization, presenting the relative ranks or relationships.
Hundreds of methods are available to create org charts, but this article specifically focuses on creating them with JavaScript. Several people ask whether or not they can create an org chart with JavaScript. Do you have the same thing in mind? If yes, ensure to go through the below discussion carefully. You will get a crystal clear answer to your query for sure.
2. Is Creating an Org Chart Possible with JavaScript?
This question is frequently asked on various online forums. You may have it a couple of times too. Didn’t you? Well, the answer to this question is a big YES. You can absolutely create different kinds of organizational charts (simple or complex) using JavaScript. In addition, you can also edit and modify org charts with this technology. However, people who don’t like using programming languages don’t feel comfortable with this approach.
3. The 5 Best JavaScript Libraries to Create an Organizational Chart
Below is a list of the top five JS libraries you can use to create interactive JavaScript organizational charts. They all come with a wide range of customization capabilities to benefit from. Let’s get into the detailed specifics.
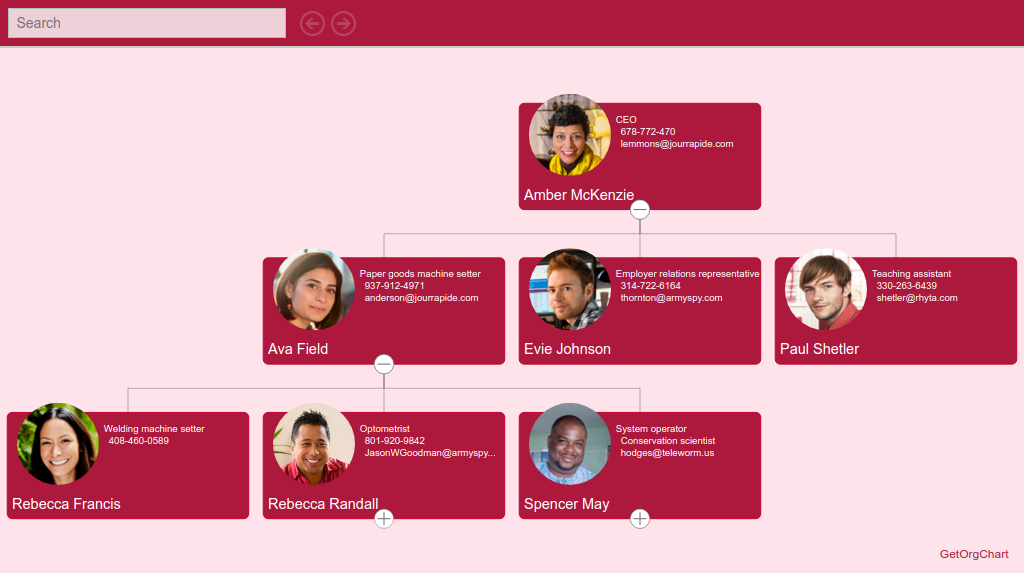
1. GetOrgChart
Site: https://balkan.app/
Well, this library helps you create neat and decent org charts. GetOrgChart offers support for three different programming languages, including JavaScript, HTML5, and CSS. As a developer, you can craft a customized interface for editing purposes utilizing server-side components. You can use default colors and skins to make your app unique. If you don’t want to use pre-built color pallets, this JS library allows you to create your unique set.
The search field acts as a helping hand in finding several items quickly. It saves you time when making complex charts. One more thing, if you don’t want to visualize your raw data, the table mode acts as your best friend.
As soon as you enter the edit mode, it enables you to make and edit org charts super easily. You just have to provide the name and some additional information, and GetOrgChart will do the rest for you. Don’t worry if you have to create a complex chart, as this library offers a zoom feature and allows you to use the navigation buttons to visualize the diagram.
Price: $0 (free trial), $399 (professional), $1,899 (premium), and $4,999 (enterprise)
2. yFiles for HTML
Site: https://www.yworks.com/products/yfiles-for-html
You can easily add diagrams or shapes to HTML 5 web apps with yFiles for HTML. It offers different user interface components to create and visualize diagrams and charts. With this library, you can make client-side apps that do not need server components or plugins. But if you need some components, you can use .NET or Java-based server components to get the job done. It will help you create charts that are intensive computationally.
yFiles for HTML is a genuine JavaScript library. It works perfectly with popular JS frameworks like React and Angular. It allows you to use TypeScript bindings and offers great support for ECMAScript 6 functionalities.
This library is good for creating every type of diagram, be it an org chart, a Sankey diagram, or a mind map. The documentation page provides you with the API reference and a step-by-step guide. The pricing plans are flexible. You can choose a suitable package depending on the number of developers in your team.
Price: $18,200 (1 developer and 1 domain), $36,400 (3 developers and 2 domains), $109,200 (unlimited developers and 4 domains)
3. DHTMLX Diagram Library
Site: https://dhtmlx.com/docs/products/dhtmlxDiagram/
If you are looking forward to visualizing the hierarchical data of your organization, there is nothing better than using the DHTMLX diagram library to make easily configurable organization chart JS. Along with org charts, you have the option to create a wide variety of diagrams, including but not limited to UML diagrams, network diagrams, mind maps, and decision trees.
You can create your diagram with either pre-built shapes or customized ones. If you want to introduce images, icons, text, or other similar components to your chart, you can do it with a few lines of code easily. You can also change these parameters later on with the user interface.
Price: $599 (1 developer and 1 project)
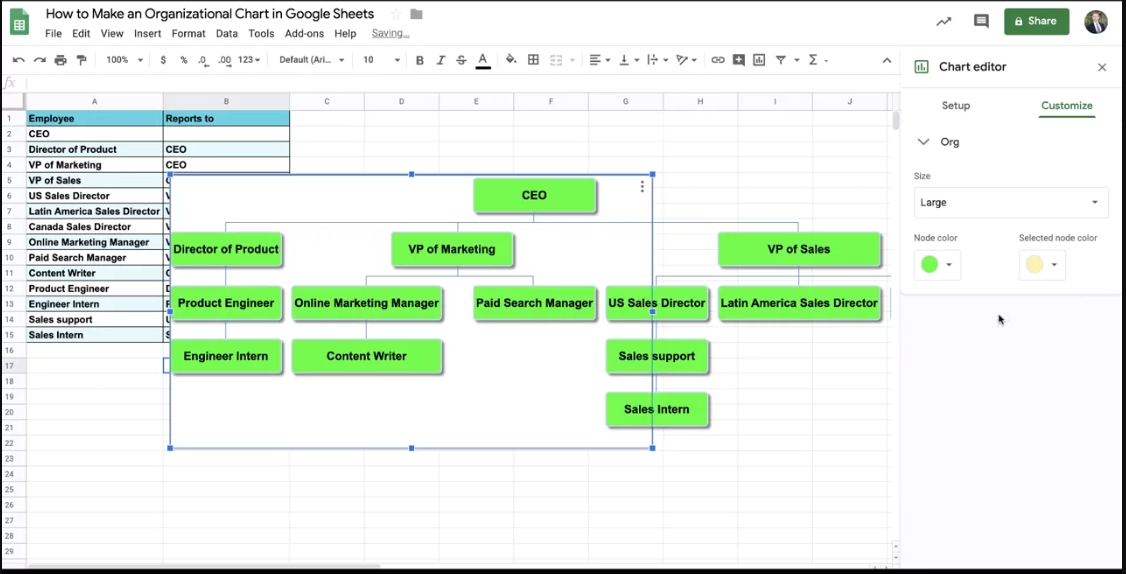
4. Google Charts
You can use Google Charts to make an elegant and easily understandable JavaScript org chart. It is equipped with numerous powerful and simple tools. Apart from creating organizational charts, the rich gallery allows you to create a variety of other shapes in parallel.
The best thing about this library is that every chart you create with it is fully configurable. You don’t have to install any plugin to use Google Charts. Furthermore, it is highly compatible with almost all the latest browsers. If you do not want to spend money on any tool to create an org chart JS, using Google Charts will be a perfect choice in that case.
Price: Free
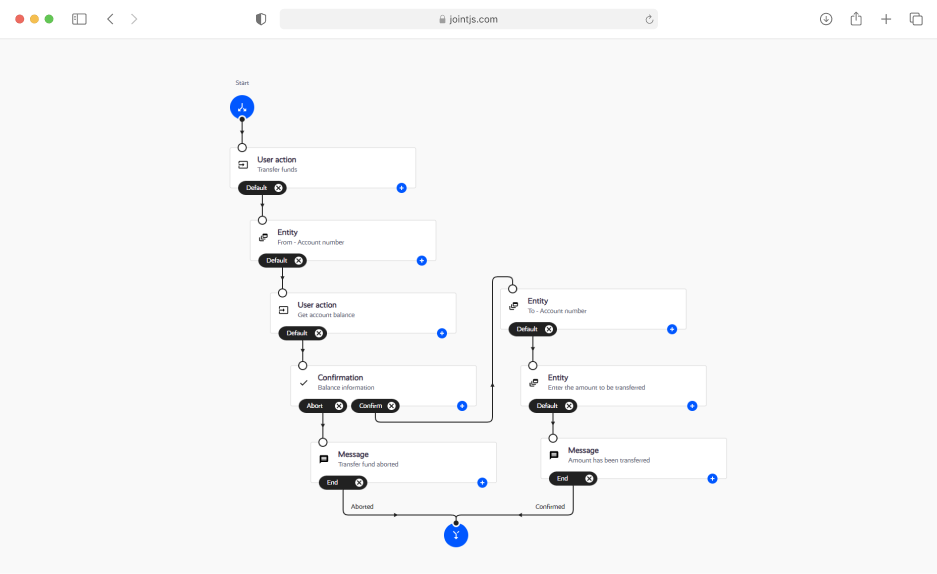
5. Rappid Diagramming Framework / JointJS
Site: https://www.jointjs.com/
JointJS was previously known as Rappid Diagramming Framework. With this framework, you can build various applications that help you make organization chart JS and other diagrams. This library assists you in providing access to charts to different users. The good news is that the user interface of JointJS is fully customizable, allowing you to create any type of diagram. It works fine with all back-end technologies. Moreover, you can integrate it with all online apps.
With Rappid Diagramming Framework, you can create interactive organizational charts, floor planners, and other similar diagrams. Using SVG and HTML5, this framework allows you to visualize your data in 2D. It is highly compatible with popular JS frameworks, including React, Angular, and jQuery.
You can build complex visualization applications with JointJS, as it comes with a wide selection of supportive plugins. Exporting your chart in multiple formats is possible. The file formats this framework supports include; SVG, JPEG, PNG, and JSON.
The best thing about this framework is that a number of detailed tutorials are available on the official website, which makes it easy for developers to benefit from it.
Price: $2,490 (standard support subscription) and $3,990 (premium support subscription)
4. The Top 5 JavaScript Plugins to Create an Org Chart
Plugins are installed to enhance the features of a program without affecting its regular performance. A list carrying the five best JavaScript plugins to make organizational charts is attached below.
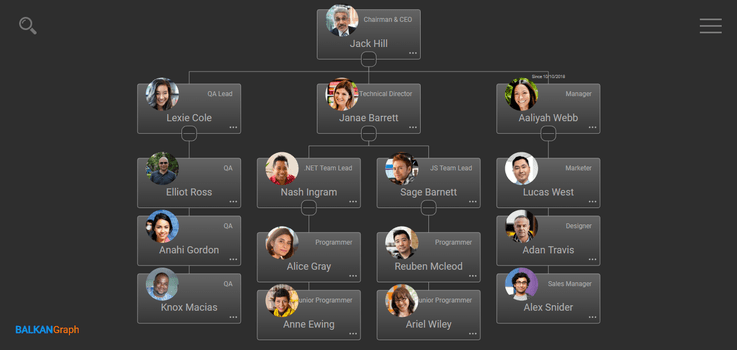
1. OrgChart
It is a fully customizable, highly flexible, and super simple plugin designed to create interactive organizational charts to present the complete hierarchy of your business. It offers profound support for both remote and local data and provides you with fully customizable nodes and structures. In addition, OrgChart features on-demand data loading and transition effects based on CSS3. Support for avatars is also available in this plugin.
2. OrgChart JS
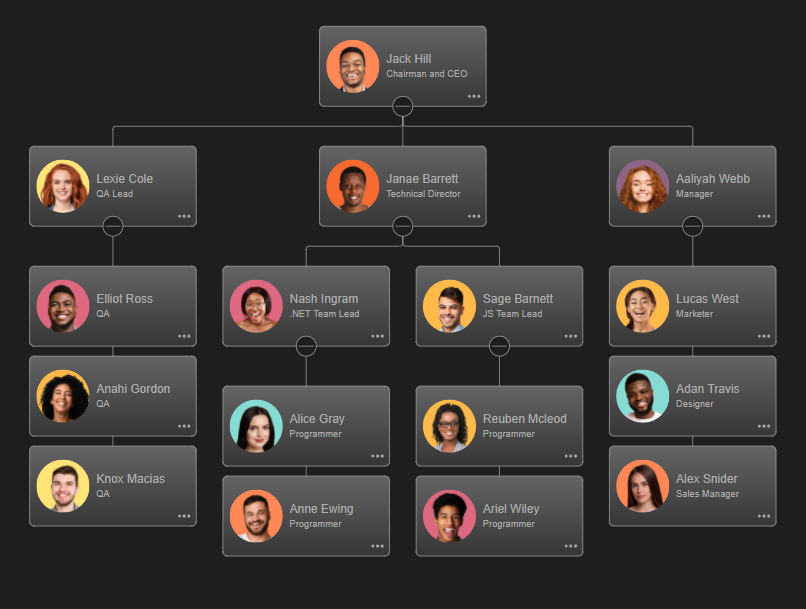
If you want to present the structure of your company and the designations of employees in an eye-catching way, look no further than OrgChart JS. The prominent features of this plugin include drag and drop, zoom, scroll, editing, expand collapse, search, and node customization. The big names in today’s market, like DELL, Sony, Fujitsu, Nestle, Siemens, and United Nations, have used OrgChart JS plugin to make their organizational charts.
3. JS-OrgChart-2
This JS library is used for multiple purposes. If you are looking forward to creating an org chart JS on your web page, try using js-orgchart-2. You will be super amazed to see the final diagram. This plugin helps you make fully customizable charts and other diagrams. The code for this plugin is written in pure JavaScript, and you don’t need any external library to use it. Furthermore, you have the option to create unlimited child nodes.

4. ftree.js
It is purely developed using JavaScript. ftree.js is designed to help you create organization chart JS and family tree diagrams. It uses the HTML5 canvas element to create all diagrams. All you need to do is to create a canvas element and put the desired data, and ftree.js will do the rest automatically.
5. jH Tree
With this one-of-its-kind plugin, you can create a draggable and animated org chart JS to present the hierarchical data of your organization. This plugin assists you in making themeable and collapsible family tree diagrams and charts. The zoom feature enables you to clearly visualize every component, even if your chart is complex.
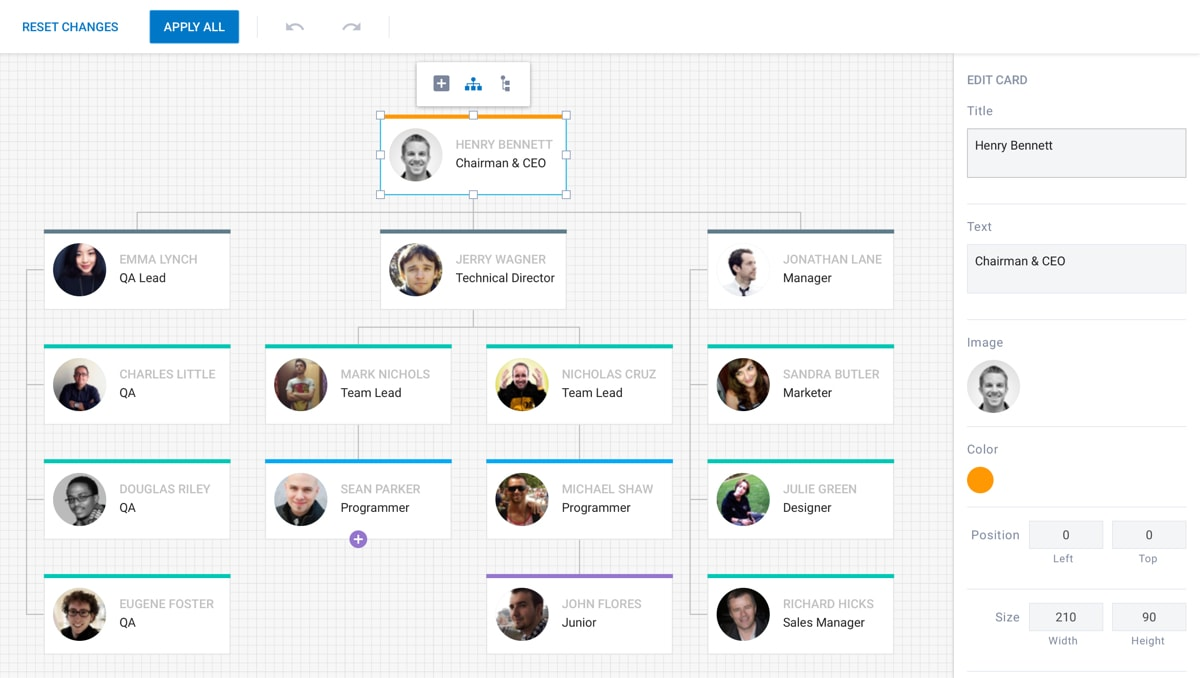
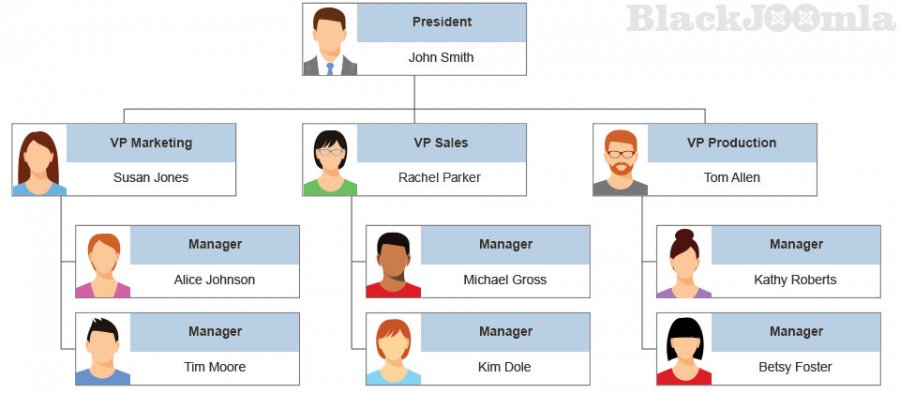
5. Create an Org Chart More Conveniently using a 3rd Party Tool - EdrawMax
Are you looking for an easy-to-use utility to create interactive organizational charts in no time? Searching for a reliable tool that keeps your important data secure? EdrawMax - an all-in-one diagramming software - will surely be your helping hand in this regard.
With a decent selection of pre-built templates, creating an org chart becomes simple, convenient, and elegant. Connecting various symbols with your organizational chart is super easy in EdrawMax. Furthermore, the import feature lets you upload the data of a huge number of people.
Once you are done with making your organizational chart, you can export it in different file formats, including PNG, MS Word, MS Excel, MS PowerPoint, JPEG, HTML, and SVG. The introduction of a cloud facility in EdrawMax has enhanced its productivity and accessibility. Now, you can use this utility to work with anyone sitting anywhere around the world. You can create different teams for different regions of the globe.
It is compatible with Windows 7, 8, and 10 (both 32 and 64-bit operating systems). A free trial with limited features is available. You can use it to give its basic features a try. Don’t worry about your important data, as EdrawMax respects your privacy and uses advanced security protocols to protect your confidential information.
Advantages of Using EdrawMax Over JavaScript
The biggest advantage you can get from EdrawMax is that you don’t need to use any library or plugin to create an organizational chart. Moreover, you can create your org chart easily even if you don’t have any programming knowledge, etc. This is one of the biggest reasons why EdrawMax has more than 25 million active users. Apart from individual users, market-leading brands like Toyota, Walmart, Harvard University, Total, Shell, Deloitte, Facebook, and Amazon, have also trusted this tool.
6. Final Words
There is no better way of presenting your organizational hierarchy and employee relationship than creating an org chart. Hundreds of ways are available to draw these charts. Creating organizational charts with JavaScript technology is one of them. Many users ask whether they can use JavaScript to create org charts. The discussion above has presented a detailed debate on this matter. The top JS libraries and plugins are also part of the above discussion.
If you are on the hunt for a cost-effective, dependable, efficient, and secure tool to make organizational charts, try EdrawMax. It provides you with a complete diagramming package and full control over customizing your charts and diagrams. Millions of people are already enjoying its features. Be part of this happy community and see the miracles happen. Good Luck!