Pepsi BCG Matrix
Pepsi Cola has the best product that any brand can have in the category they are in. It is a leader in its category and is number one. In this article, we will discuss the BCG matrix of Pepsi's beverage business to understand which segments of the product mix are driving growth and the potential areas of future growth and opportunity for the brand.
1. Introduction
The BCG Matrix is a tool to help marketers determine where they should spend their money to maximize profit. BCG is an acronym for Boston Consulting Group. Every business needs a marketing plan. Without a plan, you will waste money, miss opportunities, and confuse people with things they don't care about. Businesses that plan their marketing well know that their plans have a high probability of success. They understand how much competition exists in their market and the entry price. The BCG matrix helps you determine your competitive advantage, what makes you unique and better than anyone else, and how much money you can spend to achieve those goals. In this article, we will be discussing the Pepsi BCG Matrix.
Background of Pepsi
Pepsi-Cola was created by Caleb D. Bradham in 1876. Hoping to replicate the recent success of Coca-Cola, Bradham named his carbonated, cola-flavored soft drink Pepsi-Cola. The drink once proved so popular that in 1902 Bradham incorporated the Pepsi-Cola Company. After multiple years of moderate prosperity, the company faced hard times after World War I. It was reorganized and reincorporated several times in the 1920s.
PepsiCo's goal was to create an inexpensive carbonated soft drink. They thought that their brand would need to be unique to achieve success. The company believed that its consumers were loyal to brands they liked. They did research and learned that many consumers enjoyed consuming a product that could be associated with athletes.
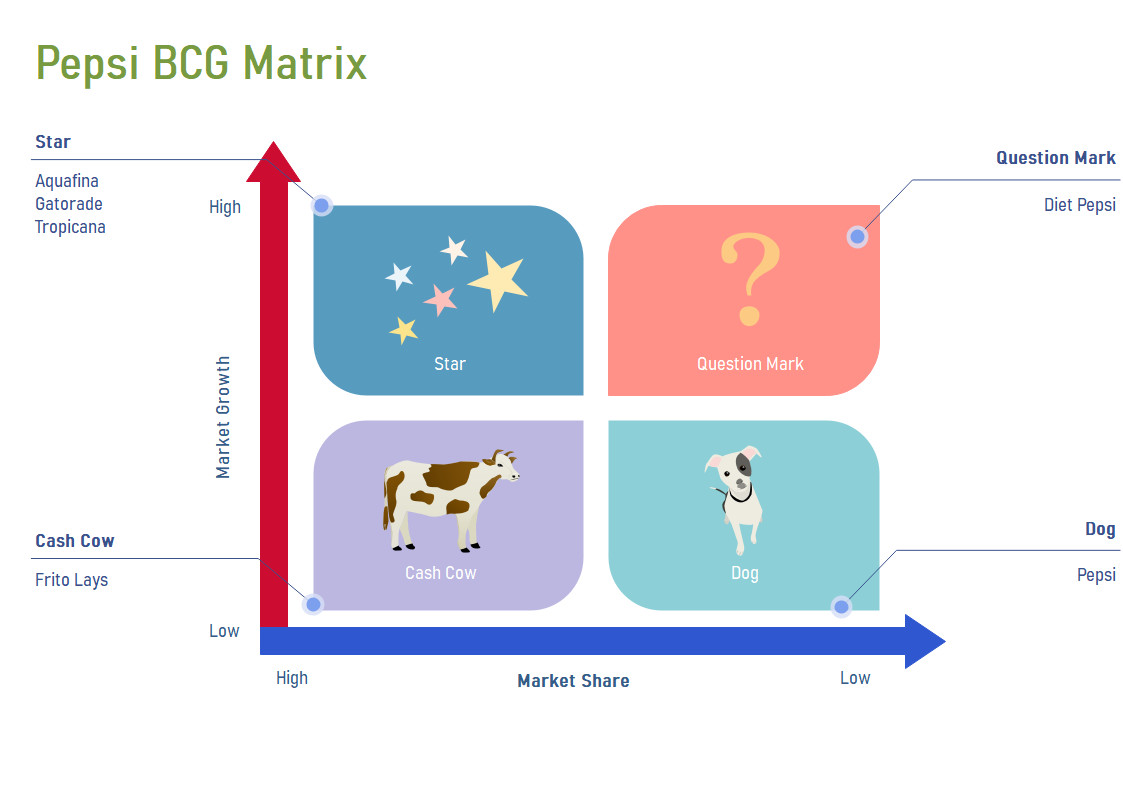
2. Pepsi BCG Matrix
If you have visited a store ever that sells Pepsi products, chances are you've noticed a number of familiar logos. The most recognizable ones are likely to be Lay's potato chips, Doritos, Cheetos, Gatorade, Pepsi-Cola, Mountain Dew, and Quaker Oats. These familiar and much-loved brands not only have made millions of people happy, but have also helped drive sales at PepsiCo, which is a multi-billion dollar corporation that sells and distributes a wide variety of food and beverages. The company's primary source of revenue mainly comes from the production and distribution of various foods, beverages, snacks, and health care products.
Market Growth Rate
The market growth rate of PepsiCo was 5.25% in the second quarter of 2022. In 2020 the company planned to invest approximately USD 19.3 billion. On an annual basis, Pepsico is expected to increase its investments by approximately 6.7%.
Relative Market Share
PepsiCo reported net income for its second quarter of 2022 at $5.6 billion, below the consensus estimate of $5.8 billion. The earnings decline stems primarily from a 3.7% drop in revenue to $15.6 billion. PepsiCo attributes the revenue weakness to weaker demand for beverages in the second quarter, which fell short of expectations, and a challenging market environment for the company. On a per-share basis, PepsiCo recorded earnings of $1.61 for the second quarter, compared to $1.65 for the same period last year. Several one-time items negatively impacted earnings.
PepsiCo's market share in U.S carbonated soft drinks was 25.9 percent in 2022.
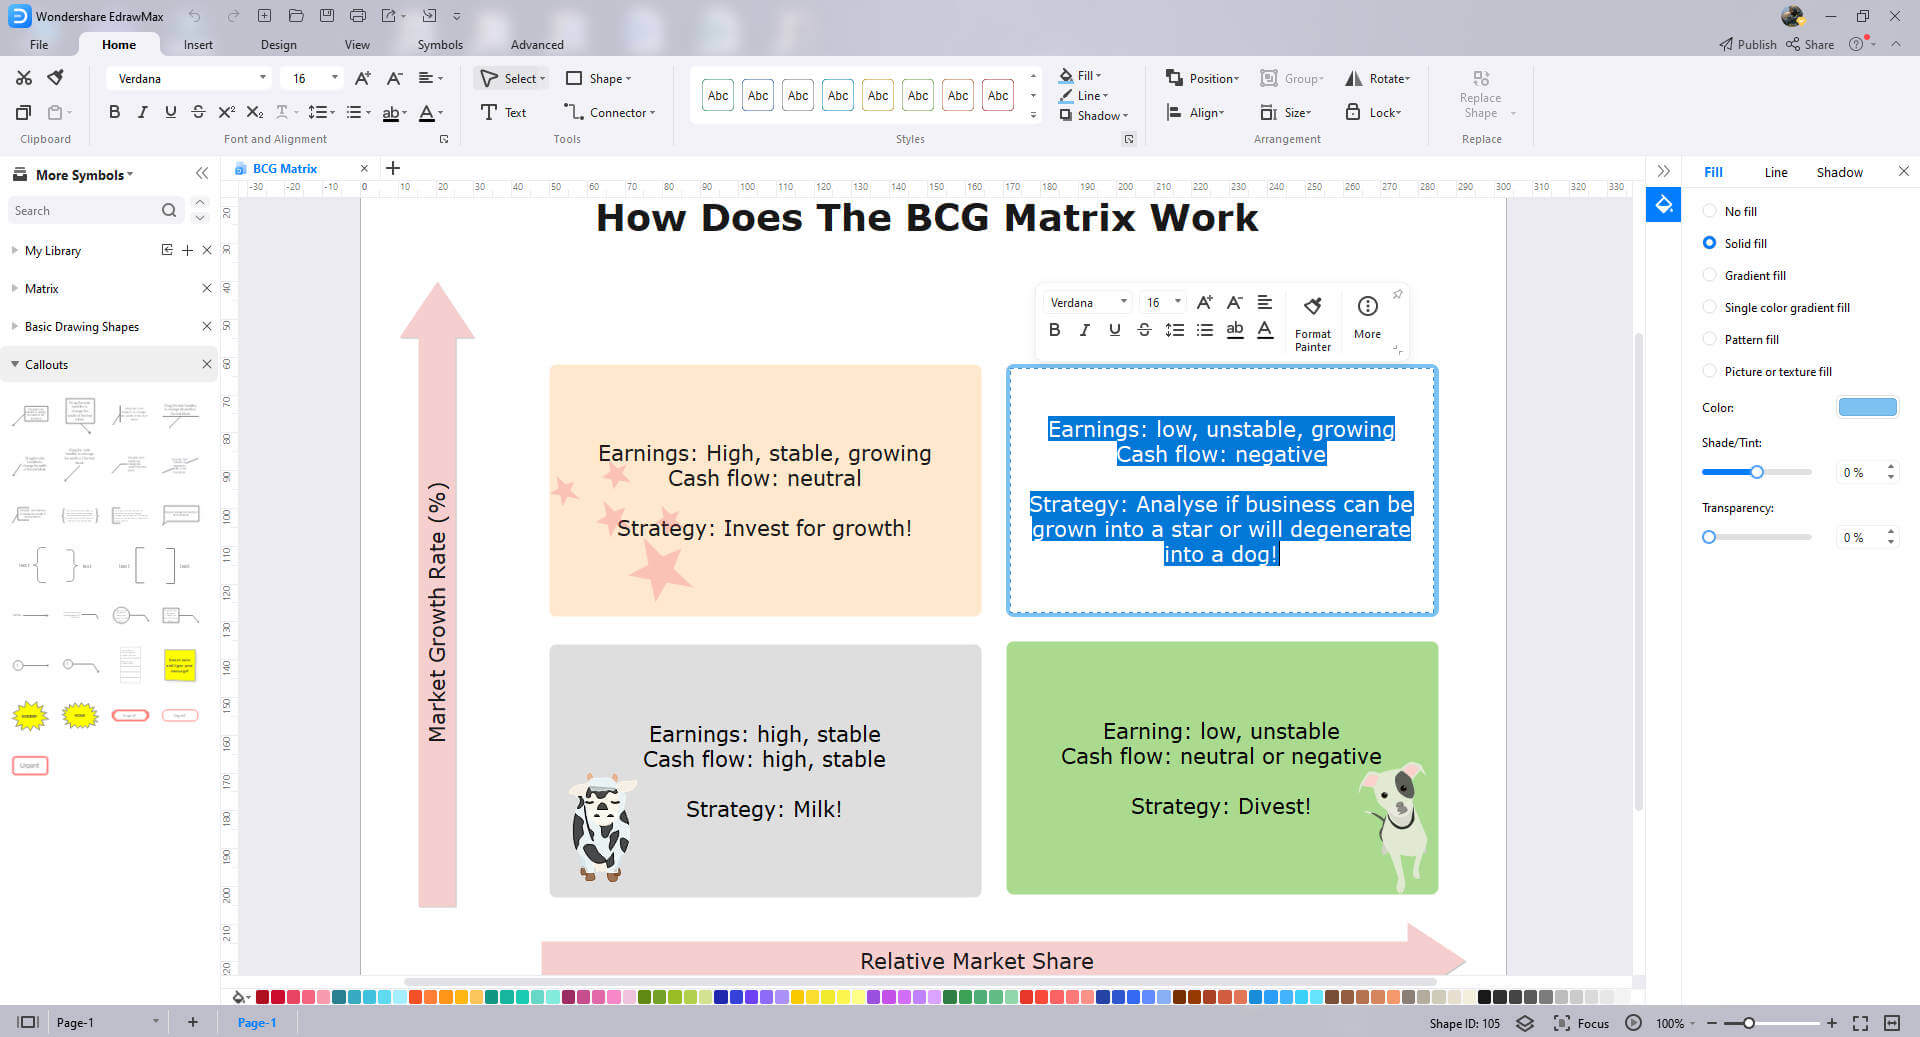
BCG Matrix has four components:
- Cash Cow
- QuestionMark
- Dog
- Star
Cash Cow
For the company, Frito Lays is undoubtedly the cash cow. The following biggest manufacturer of savory snack products is Kellogg's, with a 7% market share, followed by Mondelez, with a 5.6% market share. Frito Lay has a dominant 72.4% market share in the chip segment, but its main competitors are Doritos with 7% and Tostitos with 8.7%. The product requires a little investment to maintain its market share, as its sales don't fluctuate significantly with new products.
Question Marks
Not many people associate the term "Diet soda" with PepsiCo. The company launched Diet Pepsi to take back a portion of the market share it had lost to Coca-Cola and recapture the consumers' attention. In its initial launch, Diet Pepsi captured just 5 percent of the market, but soon after, it began losing market share to Coca-Cola's diet version.
7-UP Nimbooz was not a great success. The brand was launched in 2009 in the Indian market. 7up Nimbooz was not able to gain significant market share due to tough competition from the likes of Sprite, Thums Up, and Kool-Aid.
Dogs
These are low growth or low market share products. There are few chances that they will be profitable, so investors must be careful to decide whether to invest in such companies.
Investing in these businesses requires a good understanding of their strategies and prospects. Likely, these businesses won't pay much of a return for your money.
The present and future trends suggest that Pepsi will shift from Star to Dog quadrant. The segment share of Pepsi has dropped from 10.3% to 8.4% due to increasing demand for low-calorie and healthy beverages and snacks.
Stars
The organization's stars are the products or business units with high market share in high-growth industries. When the organization's stars are the products or business units with high market share in high-growth industries, Pepsi falls in the Dogs quadrant of the BCG Matrix. Coca-Cola has an annual advertising budget that's almost twice as much as that of Pepsi's. Because Pepsi wants to maintain its market share, the company spends millions of dollars on marketing and advertising. People are increasingly turning away from sugar-sweetened beverages and calorie-filled beverages. In response to stiff competition and shifting consumer preferences, Coca-Cola sees a shift from the STAR quadrant to the DOGS quadrant. Aquafina is another brand that we can place in the star quadrant; Aquafina holds 15% of the bottled water market share and is second to Bisleri, which has a 36% market share. The trend for carbonated drinks has decreased significantly as consumers move away from sugar-laden sodas. Gatorade is now the market leader in sports drinks with 77% share of the market, up from 63% a year ago. Powerade has a 20% share of the market. With rising health trends and emerging markets, the brand is investing huge amounts of money into healthier foods and beverages, making a bigger dent in the soft drink category.
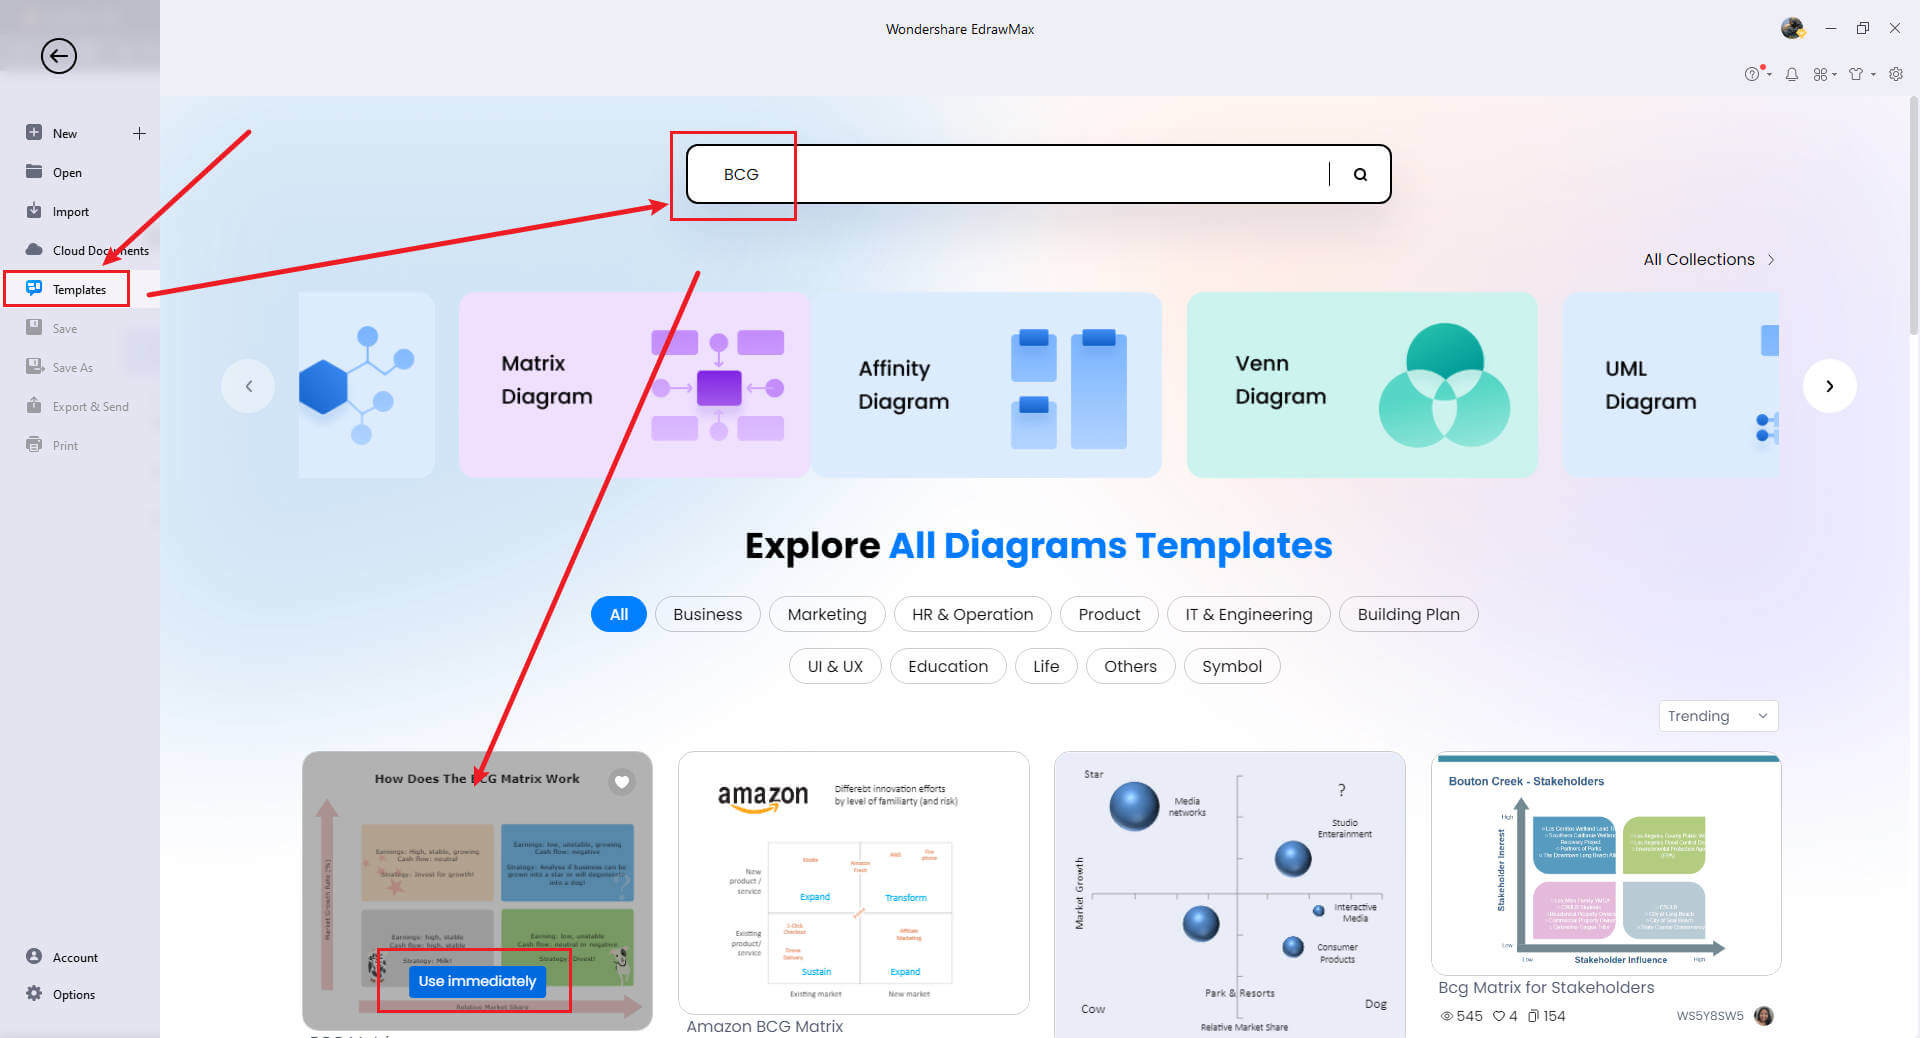
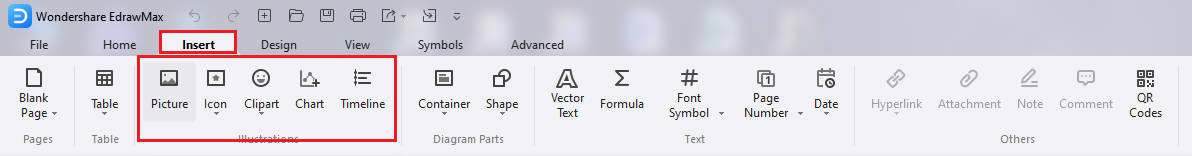
3. How to Draw Pepsi BCG Matrix Online?
EdrawMax is a complex graphics application that allows users to create many different graphics files and then save them as documents. It can help us create graphical templates, charts, and business charts. This tutorial will show you how to create a BCG matrix using EdrawMax Online.
The 5-step process for creating a BCG matrix starts with outlining.
Step 1: Preparation (Gather information, open EdrawMax, and login)
Gather information to start with the matrix. Before beginning, identify the keywords and descriptors that describe your customer groups. Be aware that a keyword can represent multiple descriptors.
Step 2: Select a Template or Create from Scratch
For most companies, designers prefer modifying existing templates or creating a new design from scratch. The first choice is based on the type of product or service you're selling. You can get the templates from EdrawMax Community.
Step 3: Add Textual Information
The typeface (font) you use will affect how your content looks. For example, changing the font size to 10px will take up ten times as much space. Make sure to leave some breathing room!
Step 4: Add other components/ Customize Your Work
You can use shapes to draw tables, type in the text box directly, or use the shape tool to create custom text. You can also use the logo and slogan tools to draw a logo and tagline.
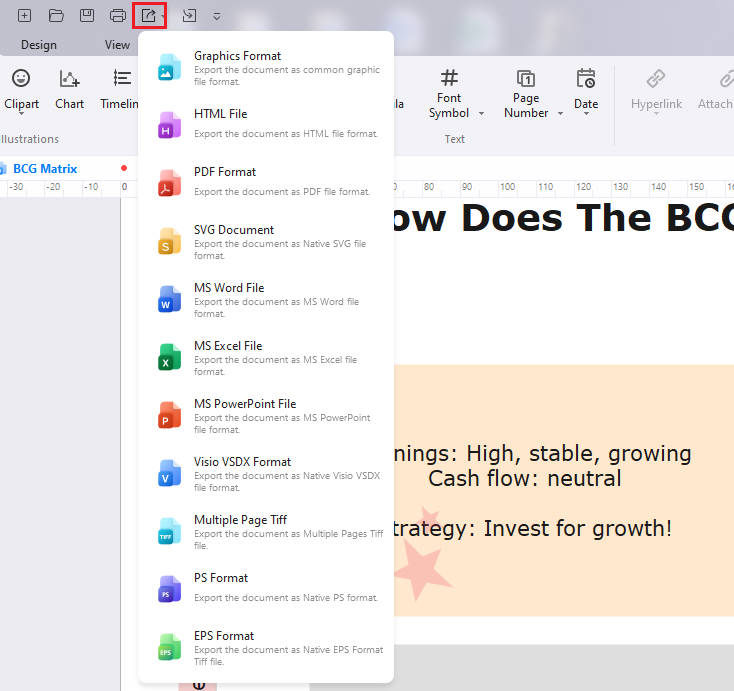
Step 5: Save and Export
This feature allows users to save their work and export the required file in multiple formats.
4. Key Takeaways
Pepsi is known to be the leader in carbonated beverages. For many years, Pepsi maintained its leading position because of its focus on innovation. However, that focus was too rigid, and the market began to change. Pepsi needed to innovate and adapt, but it had little choice.
The Pepsi BCG Matrix shows Pepsi's brand value and positioning in the market, along with Pepsi's performance against its rivals. EdrawMax is a professional diagramming tool and will save you a lot of time and money because it is an easy-to-use software in case you want to draw a BCG Matrix. EdrawMax is more than a diagramming tool. It also provides other features, such as flowchart, network, matrix, drawing map, Gantt, timeline and schedule management, etc.
5. References
PepsiCo Limited. (2017). PepsiCo, Inc. Annual Report 2017 Form 10-K. New York: PepsiCoLimited.
Harshil. (2014, September 15). Product Life Cycle of PepsiCo. Retrieved May 10, 2018, fromJugookushal Wordpress: https://jugookushal.wordpress.com/2014/09/15/product-life-cycle-of-pepsi/