Free Editable Timeline Infographic Examples
A timeline graphic organizer Keeping in mind the flow of events or their chronological order and presenting them before an audience is never easy. That is where timeline infographics kick in. In this article, we will share the basics of these infographics and some such infographic examples.
1. What Is a Timeline Infographic
An infographic is the graphical presentation of information. When the presented information is based on the flow of events with time, it is called a timeline infographic. In other words, it is a graphical presentation that displays information with the progress of time. As a graphical presentation, an infographic helps understand information more conveniently. And when the timeline of events is added to that graphic, it gets easier to grasp the whole scenario at a time. Also, when presenting the infographic, the presenter can easily relate to the consequences of an event with time. That is why these types of infographics are quite common in marketing content, presentations, and a variety of other occasions.
2. The Timeline Infographic Examples
Infographics with a timeline help understand the flow of events in an easy manner. However, creating such an infographic is never easy. That is why timeline infographic templates can be of extraordinary help. Here are some such infographic examples that you can try.
|
|
|
| Timeline Infographic PPT | Timeline Infographic Design | Horizontal Timeline Infographic |
|
|
|
| Project Timeline Infographic | Company Timeline Infographic | Timeline Infographic Example |
|
|
|
| History Timeline Infographic | Vertical Timeline Infographic | Process Timeline Infographic |
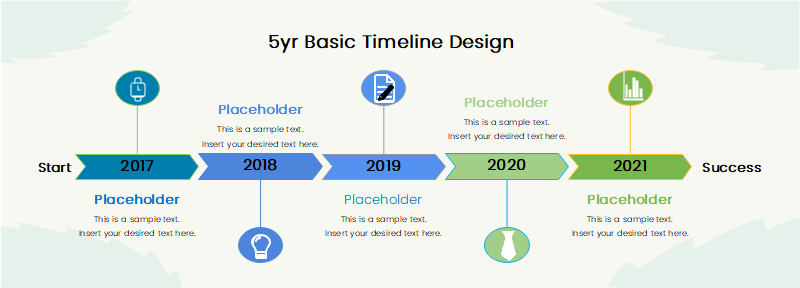
Example 1: Timeline Infographic PPT
Timeline designs are quite common in PowerPoint presentations. In order to make the audience understand the flow of events, presenting them through timeline designs in ppt can be an easy way. Based on the design of the other slides in your ppt file, the timeline design will vary. A common design can be to put the flow of time in the middle and the events surrounding them. Then, connecting the events with the time flow by straight lines will do the rest.
 Source:EdrawMax Online
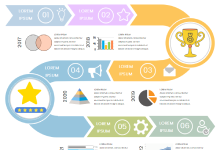
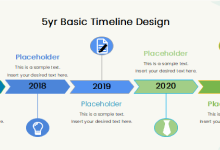
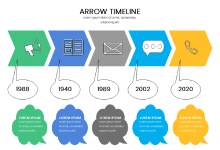
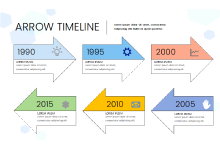
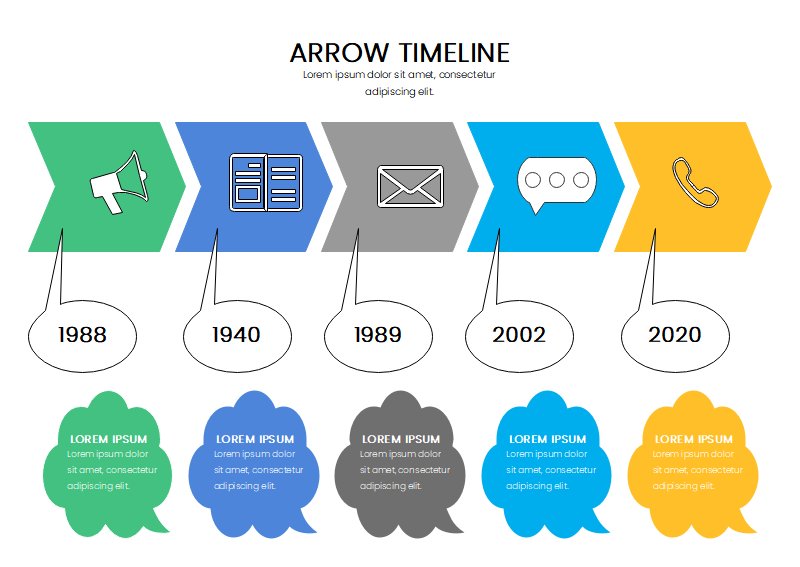
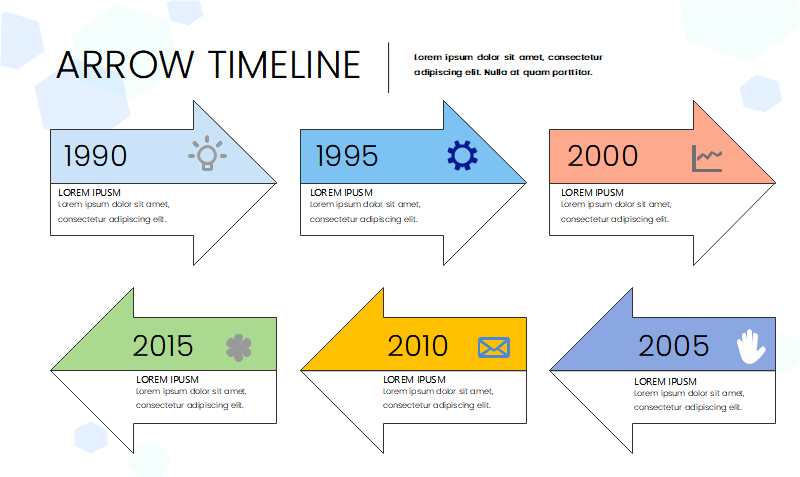
Example 2: Timeline Infographic Design
A common timeline infographic design is the arrow timeline. As the name suggests, the flow of events is presented in the form of arrows. The pointed end of the arrow indicates the direction of the flow. The type of event may be presented in the form of diagrams and/or symbols. In such cases, the time of the event taking place is included just below the corresponding symbol. And the description of the event is presented below the symbol and the time.
 Source:EdrawMax Online
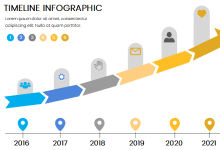
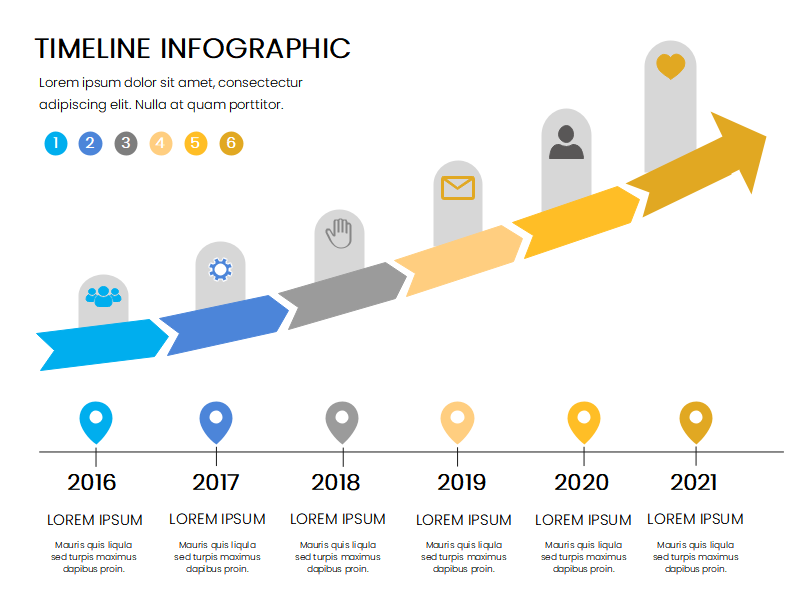
Example 3: Horizontal Timeline Infographic
Most timeline infographics are horizontal in terms of presentation. In most cases, the flow of events is presented from left to right. If the number of events is more than what can be placed in a row, the events can be placed in two rows. The flow of events can be presented in the form of arrows where each of the arrows will include the time of the event’s taking place and the name of the event.
 Source:EdrawMax Online
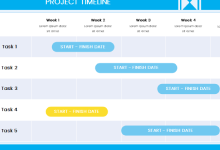
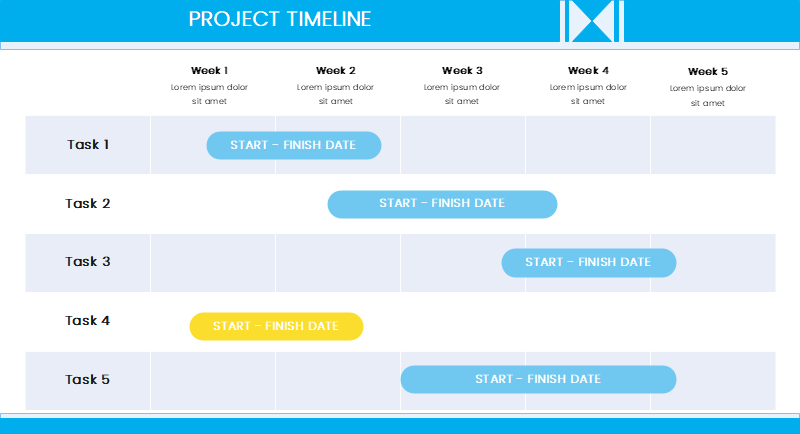
Example 4: Project Timeline Infographic
A project involves a number of events taking place one after another. That is why such infographics for projects are an important part of perfectly accomplishing the project. As the project involves several tasks while each of them takes place at different times, you can easily organize them that way. For example, you can have the very first task put in for the first week. For the second week, the corresponding task and so on. This way, the project timeline can easily be presented through the infographic.
 Source:EdrawMax Online
Example 5: Company Timeline Infographic
A company timeline infographic may involve different types of information. For instance, the infographic can include different parts of the company based on the time they were established. Also, it can denote different services provided over the years. In the case of the latter one, each service can be presented with bars, in which case, the height of the bars indicates their qualitative or quantitative amount. The flow of services or events can also be numbered in one corner of the infographic.
 Source:EdrawMax Online
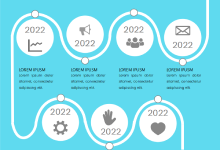
Example 6: Timeline Infographic Example
This is a very creative timeline graphic organizer that shows a vertical timeline divided into yearly milestones. The graphics can be customized, and relevant images may be used for clarity purposes. This particular organizer represents the history of technology starting from 1970 going up to 2010. Using EdrawMax, you can use the icons from the vast media library to find relevant graphics for your story. You can summarize your history in five specific events and represent them here in this template to show your events creatively.
 Source:EdrawMax Online
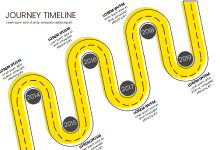
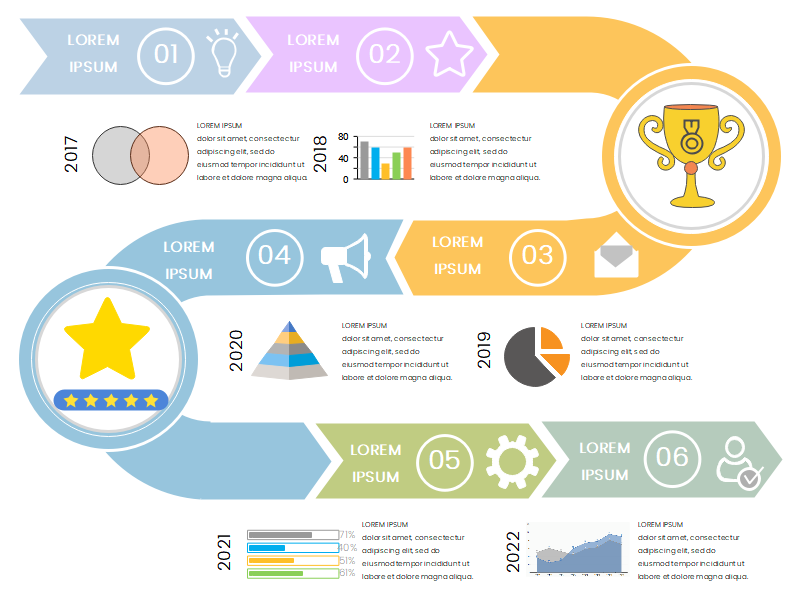
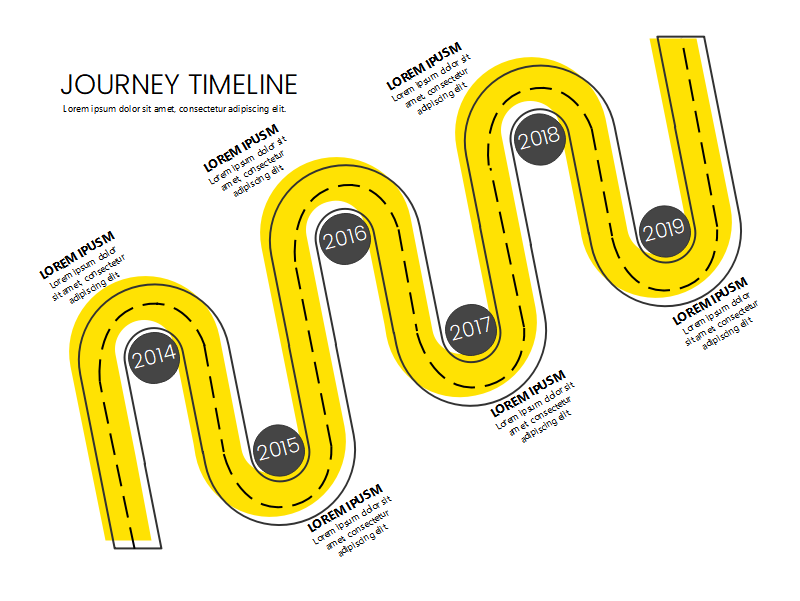
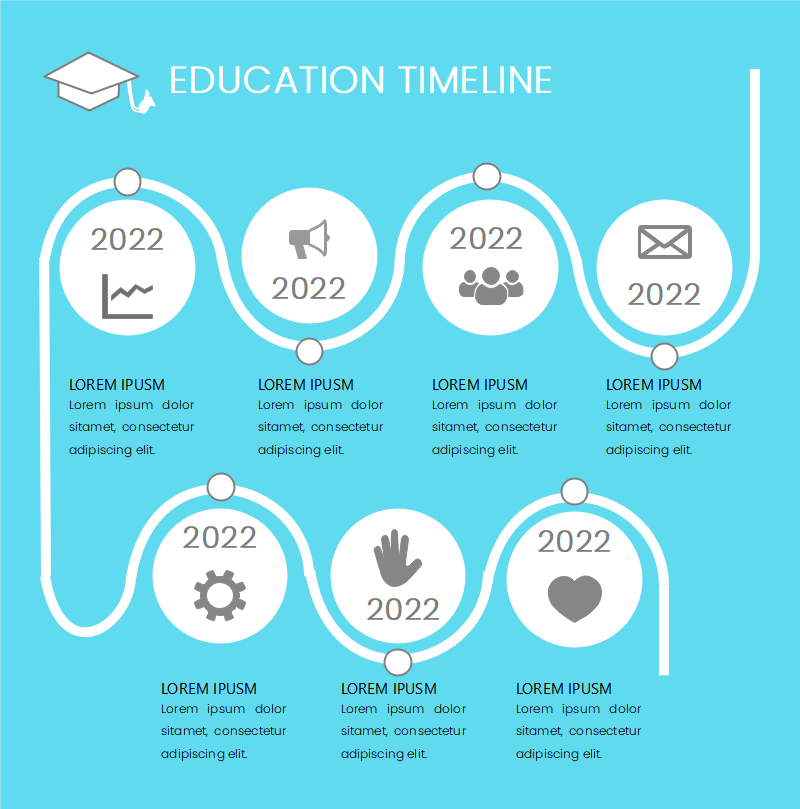
Example 7: History Timeline Infographic
History timeline basically talks about the events taking place over the years. Usually, these events are interconnected. In some templates, such infographics are presented in the form of roads. Based on the type of information and the audience, the formation of the infographic will vary. Some infographics even include pictures to present the historical events more graphically. Some parts include a description of the event where and if necessary.
 Source:EdrawMax Online
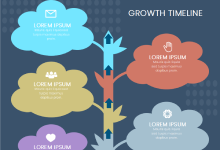
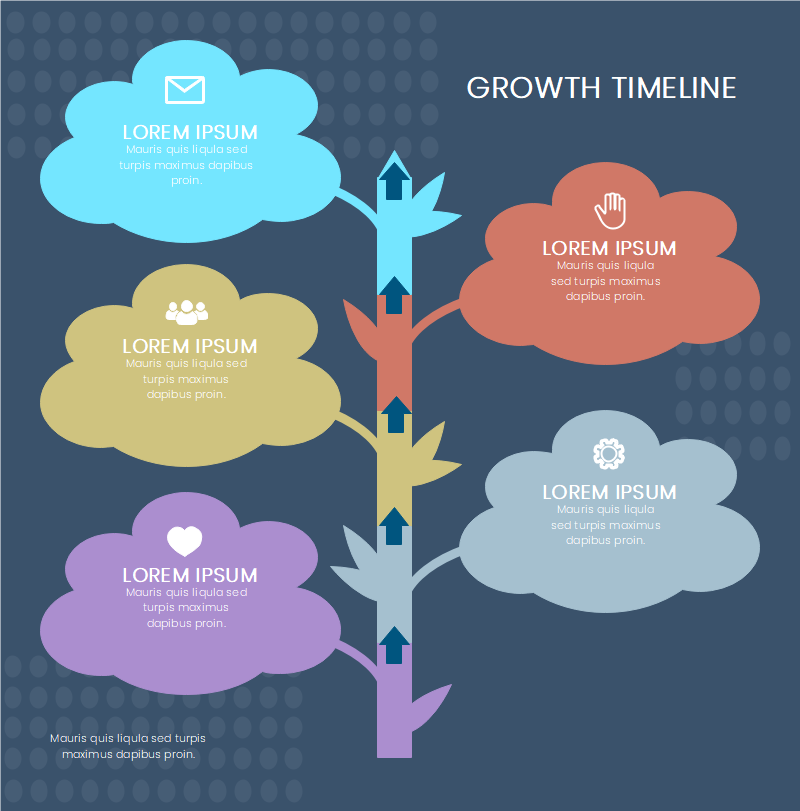
Example 8: Vertical Timeline Infographic
While the common type of timeline infographics is horizontal, they can sometimes be vertical. Especially when the infographic denotes growth, they tend to be vertical to have a better understanding. Based on the number of events or follow-ups these infographics include, they can be sorted in a single row or double row. These infographics often resemble trees. The trunk of the tree denotes the flow of events, while the leaves and branches denote different events.
 Source:EdrawMax Online
Example 9: Process Timeline Infographic
Such types of infographics include the flow of events that are numbered and directed in the proper direction. This flow may include images in its pathway to make things more understandable. Other than that, the different parts of the process are described in brief within the infographic. The time of the event taking place, which can be the exact time, or month of the year, or only the year, is also mentioned in the process infographic.
 Source:EdrawMax Online
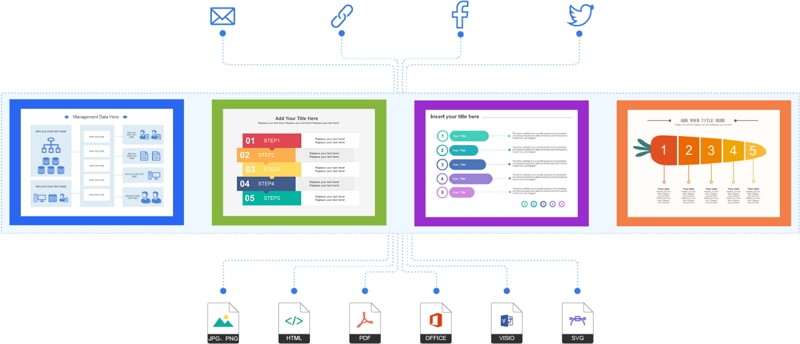
3. Online Timeline Infographic Maker
As you want to present chronological events, timeline infographics are the best way to do it. However, creating such an infographic on your own is not even close to easy. That is why taking help from the best online timeline infographic maker is the right option. And that is where EdrawMax Online comes in handy. EdrawMax helps you visualize your stories and plans in any timeframe while allowing you to create all other types of infographics and 280+ types of diagrams. You can create your timeline in minutes with the help of plenty of templates available. Besides, as it is an all-in-one diagramming tool, it will make sure all your needs are fulfilled.
Why Choose EdrawMax Online
- Create over 280 diagram types
- Supports team collaboration
- Personal cloud & data protection
- Print, share and download
- Powerful template community
4. Key Takeaways
In terms of understanding the chronology of events better, there is no alternative option to a graphical presentation like timeline infographics. Hopefully, when there are online tools like EdrawMax Online, dedicated for creating such infographics, you don’t need to worry. From plenty of templates, you can just choose the one that matches your stories perfectly. Additionally, you can find various timeline infographics templates at templates community for a quick start at creating these infographics.


