What Is an Energy Pyramid Diagram
1. What is an Energy Pyramid Diagram?
Also known as the Pyramid of Energy or the Trophic Pyramid, it provides a graphical representation of how energy (or biomass) is transferred through different levels in an ecosystem.
The concept was initially introduced by Charles Elton in 1927 as an Eltonian Pyramid and was later expressed for biomass by Bodenheimer in 1938. Though, as of now, the concept is conceived as a flow of energy, and it was first interpreted by G. Evelyn Hutchinson and Raymond Lindeman in 1942.
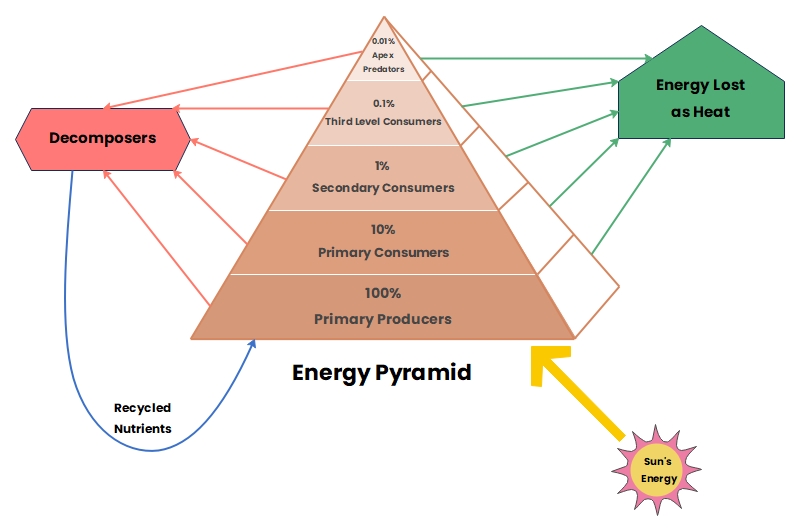
As you can see from the overall representation of an energy pyramid, various trophic levels are depicted in the diagram on how they consume or produce energy. The sun is the initial source of the energy, and it is harvested by primary producers (plants). Ideally, 10% of the energy is being transferred from one trophic level to another (like primary to secondary consumers).
One of the major benefits of an energy pyramid diagram is that it helps us explain how energy is transferred from one level of the ecosystem to another.
2. The 5 Major Levels in an Energy Pyramid
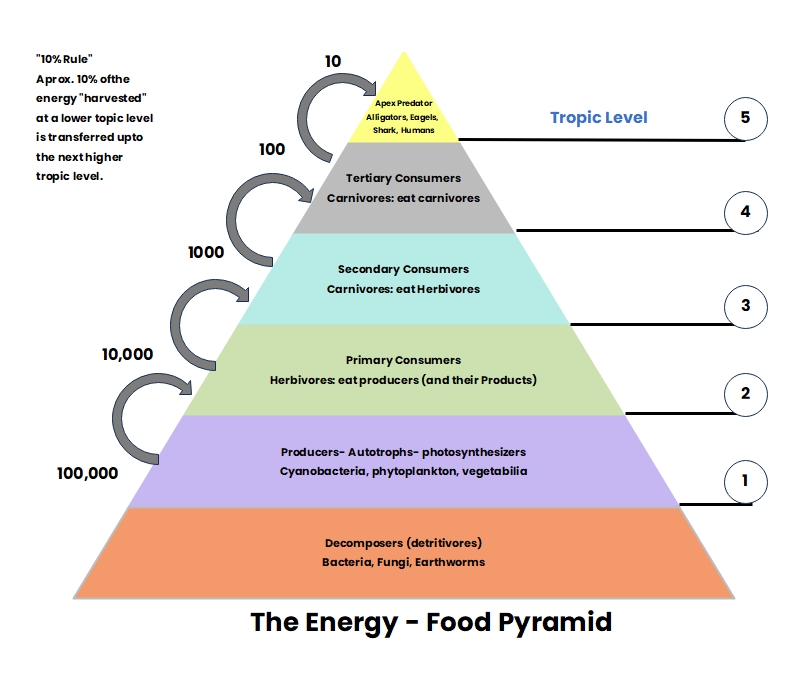
As listed above, an energy pyramid mostly consists of 5 different levels. While the producers and decomposers form the initial layers, the top 4 layers are depicted by consumers. Also, a pyramid of energy follows a general rule in which around 10 of the energy that is harvested at the bottom level is transferred to the higher level (and so on).
Producers and Decomposers
This is the first and the most important layer in an energy pyramid diagram that is represented by the major producers of biomass. In this, plants, algae, and phytoplankton would absorb the sunlight to produce energy. A lower layer is also depicted by decomposers (that could be bacteria, fungi, or earthworms).
Primary Consumers
This is the second layer in the diagram that depicts direct consumers of the energy-producing units. In this, mostly herbivorous animals are covered as they rely on plants as their energy source.
Secondary Consumers
The third layer is depicted by secondary consumers (carnivorous) that rely on herbivorous animals (the secondary consumers) as their energy source.
Tertiary Consumers
In this, we have high-level consumers (omnivorous and carnivorous) that can consume carnivorous or herbivorous beings as their energy source.
Apex Predators
The top level of the pyramid is depicted by the most apex predators like snakes, eagles, alligators, humans, etc. that are present at the top of their ecosystem.
3. The Key Benefits of Energy Pyramid Diagrams
Ideally, an energy pyramid can help us provide vital pieces of information and understand the overall ecosystem, with the following benefits:
- Most importantly, it helps us understand the flow of energy at various trophic levels in an ecosystem.
- Apart from energy, it can also help us study the flow of biomass and the dependency of various trophic levels.
- We can understand the available energy value at different levels and how it is produced, consumed, or transferred.
- A pyramid of energy can also help you distinguish consumers and predators at different levels.
- Furthermore, getting to know about the decomposition of biomass and the wastage of energy is a vital part of the diagram.
4. How to Create an Energy Pyramid Diagram?
If you also want to come up with a visually appealing energy diagram, then you can simply take the assistance of Wondershare EdrawMax Online. It is a user-friendly professional tool that can help you create 280+ different styles of diagrams.
Without any prior design experience, you can come up with visually appealing diagrams via drag and drop actions on EdrawMax. You can use its freely available online tool or can simply download its desktop application to meet all your diagramming needs in one place. Here’s how you can also come up with an informative energy pyramid diagram with EdrawMax in a jiffy.
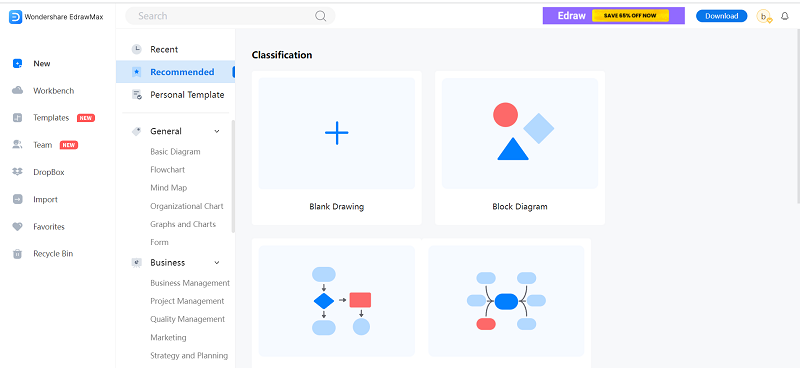
To start with, you can just go to the official website of EdrawMax Online and simply sign in to your Wondershare account. From its home, you can choose to work on any blank canvas by clicking on the “+” button or search for any existing project type.
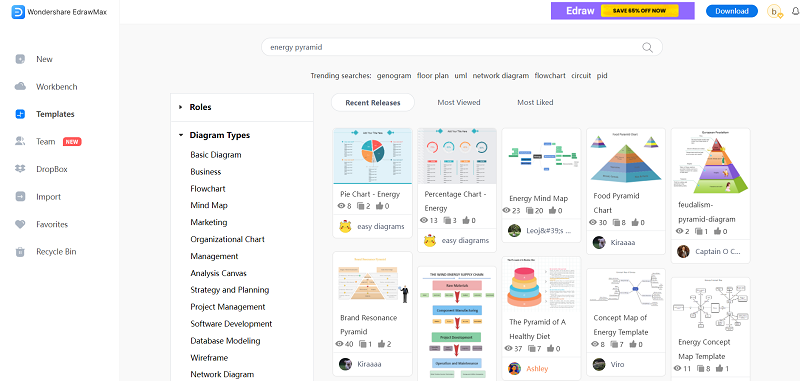
Besides that, you can also go to the “Templates” section from the side to browse the wide range of user-generated content and load any customizable template to your canvas.
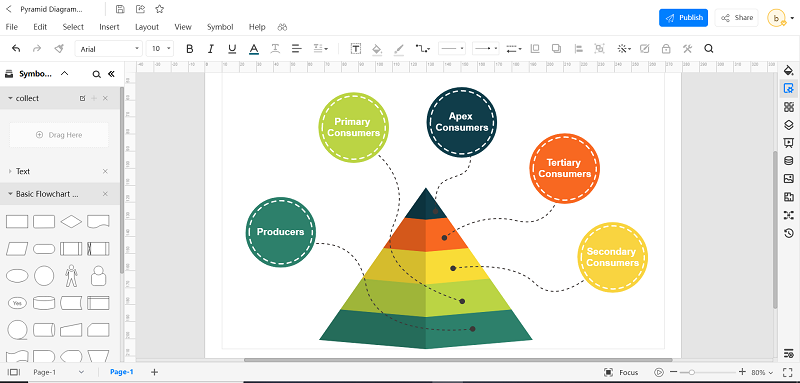
Now, using the inbuilt features of EdrawMax, you can come up with an energy pyramid diagram. You can drag and drop any design element from the side and can further work on any existing template however you like.
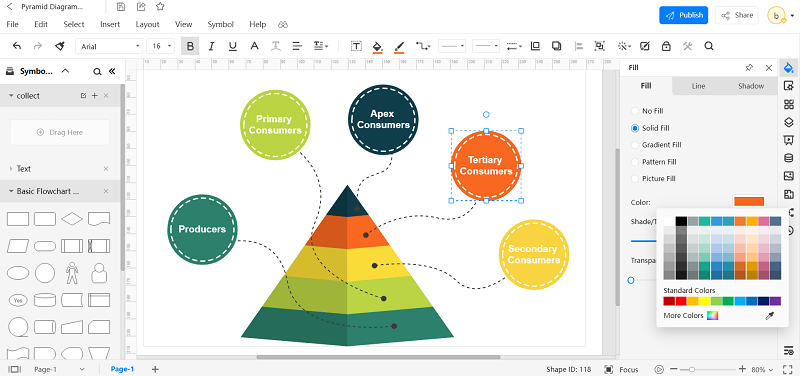
Once you have worked on the overall structure of the energy pyramid, you can select any element. On the side, you will get dedicated options to change the overall look and feel of the energy pyramid diagram.
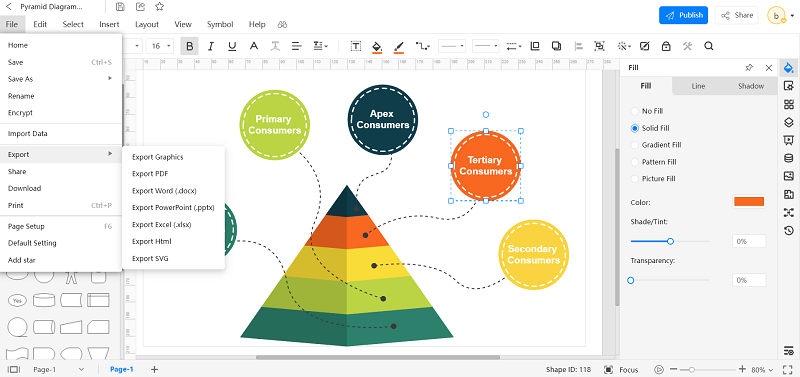
That’s it! Once you are done working with the pyramid of energy diagram, you can go to its File > Export feature, and save your diagram in a preferred format.
5. Energy Pyramid Diagram Examples to Learn From
To further understand the concept of the energy pyramid, you can explore the following examples:
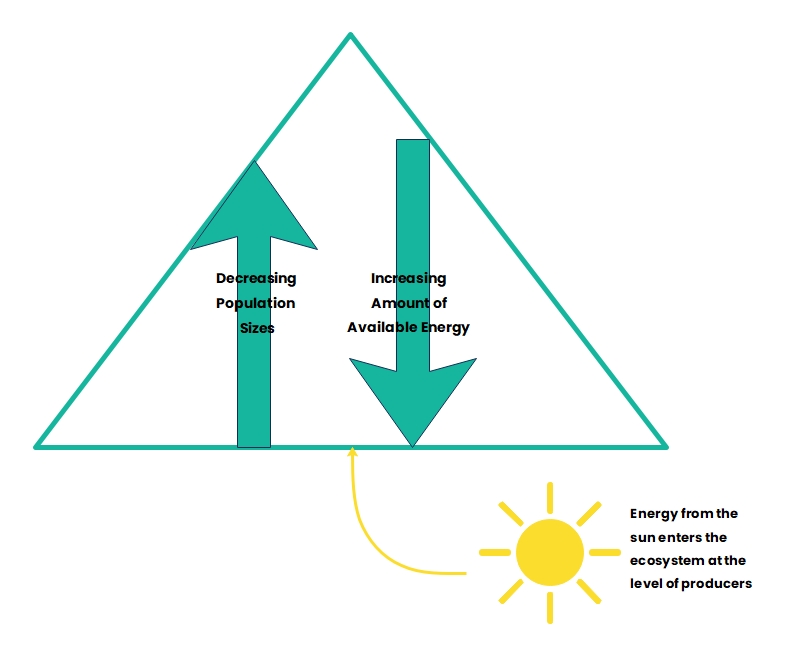
Example 1: Flow of Energy
In this energy pyramid diagram, you can simply see the flow of energy across different levels in the ecosystem. The amount of energy at the base level is more and it keeps on decreasing as we move up. Similarly, when we consider the size of the population, it also decreases as we climb different levels in the pyramid.
 Source: EdrawMax Online
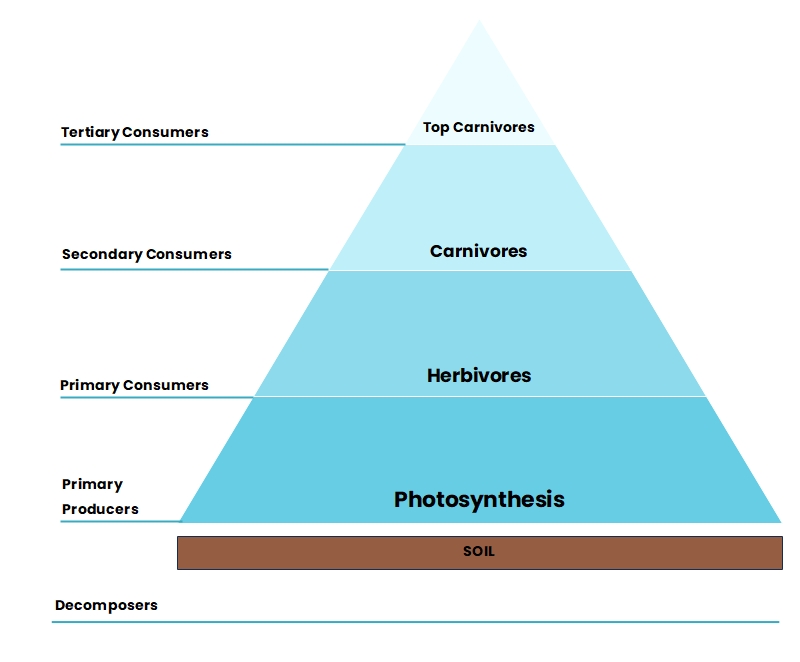
Example 2: Energy Pyramid Trophic Classification
This is another simplistic energy pyramid diagram that depicts the classification of various trophic levels. While soil consists of decomposers, primary producers can form energy via photosynthesis. The energy is subsequently transferred to herbivorous, carnivorous, and other predators.
 Source: EdrawMax Online
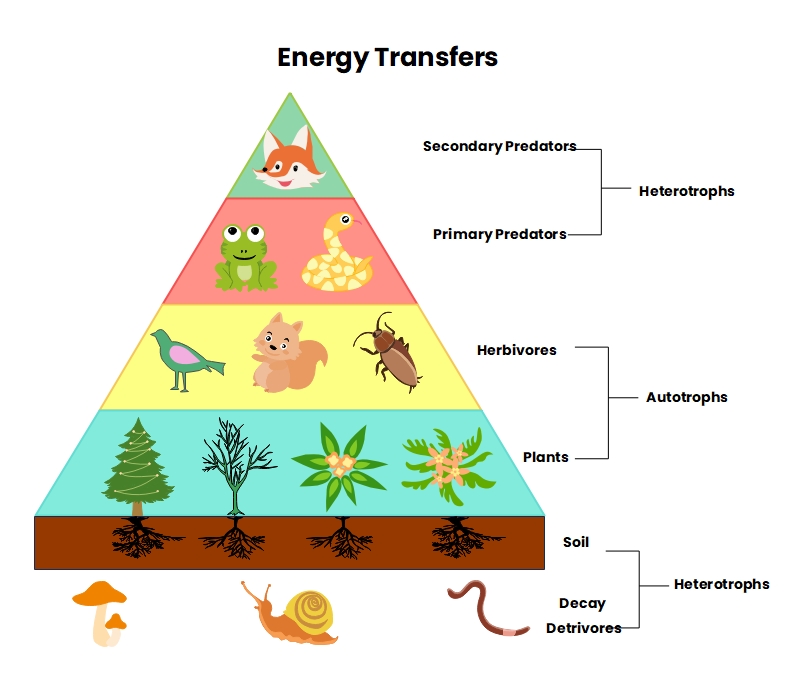
Example 3: Realistic Energy Pyramid Definition
Lastly, you can also go through this pyramid of energy in which various levels are explained by their examples. Each level of the energy pyramid is depicted by various producers and consumers to help us understand their role in the ecosystem and the flow of energy across various trophic levels.
 Source: EdrawMax Online
6. FAQs About Energy Pyramid
Which energy pyramid cannot be inverted?
The Pyramid of Energy diagram can’t be inverted as it depicts the flow of energy that is always upright. At every trophic level, the value of energy is lost, and the population size is also shrunk.
Which environmental factor does the pyramid of energy incorporate that inhibits it from being inverted?
The population size across various trophic levels is the most vital parameter in the energy pyramid. The population size decreases as we go up in the pyramid that prevents it from being inverted.
Why do quaternary consumers occupy the top position in the energy pyramid diagram?
In an energy pyramid, quaternary consumers occupy the top position as they are at the top level of their ecosystem and are mostly not consumed by other entities. They also consume the least amount of energy in the system.
7. Key Takeaways
This brings us to the end of this extensive guide on energy pyramid diagrams, their meaning, usage, trophic levels, and so much more. To help you come up with a stunning pyramid of energy diagram, I have also listed a stepwise tutorial. As you can see, with an interactive tool like Wondershare EdrawMax Online, anyone can come up with an informative energy pyramid. The online diagramming tool is extremely easy to use and features a wide range of options to come up with hundreds of diagram types without any unwanted hassle.
Create and share 280+ diagrams with EdrawMax Online