Bar Chart - Examples, Types & How-tos
Create a Bar Chart on Edraw.AI Online Free Free Download Free Download Free Download Free DownloadWhat is the Bar Chart?
A bar chart is a type of graph that is used to represent or summarize data using bars or rectangles of equal width but different heights or lengths. They can be either vertical or horizontal to graph data, more accurately measured data.
These data are generally measures of frequency, number, or other means such as mean, median, mode, etc. The data is usually graphed along horizontal and vertical axes, along with various labels and scales to represent measurable values either in numbers or in percentages.
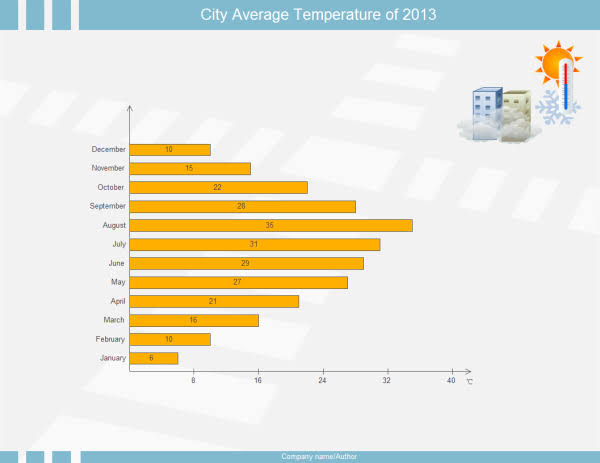
Image Source: gstatic.com
The first use of a bar chart is to represent a summarized data in the form of measures so that the user can compare different values easily and draw a conclusion very quickly about the described data.
Bar Chart vs. Histogram
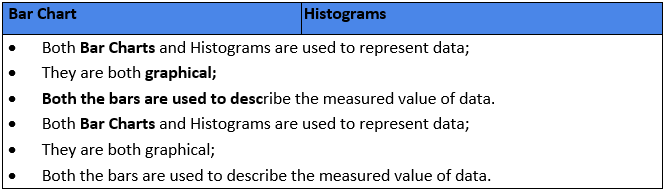
People often confuse between a bar chart and a Histogram. They seem to be the same thing. Their uses are usually along the same line. But there is a significant difference between these two forms of graphical data representations.
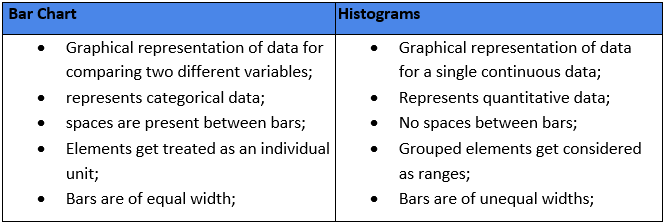
To understand these two, you need to know about the Histogram. Histograms are graphical representations of data used for a better understanding and secure comparison for the said set of data. However, unlike a bar chart, these data relate to a single continuous variable, the former being for two different variables.
Similarities:
Differences:
When to use a Bar Chart?
Since bar charts are used to represent a comparative study of summarized categories of data, it is best advised to use bar charts in such situations. These charts are straightforward to interpret, which makes it even better a choice to interpret comparative data.
There are four cases where a bar chart is the best option:
Eg. I: Spontaneous viewing of values for each category
In this case, you need to know the ratio, quantity, and frequency of each class, use a single bar chart.
Eg. II: More than five categories of data are present
Horizontal bar charts are the best option when you have more than five types of data; vertical bars make it difficult to view the labels.
Eg. III: Comparative study of data is needed
While comparing the data for a group of categories, it is best to use the clustered bar chart(s).
Eg. IV: Inter-relation within a category is needed
Inter-relation refers to the relation of a part to the whole of the group. Stacked bar charts are the best in this case(s).
Types of Bar Graphs
As we saw just now, different types of bar charts are useful for different scenarios. There are many different kinds of bar charts/graphs, but we will consider the three most widely used forms, namely:
Bar graphs can be drawn using both vertical and horizontal bars of equal width. In the case of the former, the higher the bar, the more significant is the value of that category. However, with horizontal graphs, the same theory gets applied, but the difference is that the height becomes length while measuring. They are generally useful in case of more than five categories and when a vertical graph cannot accurately represent the data.
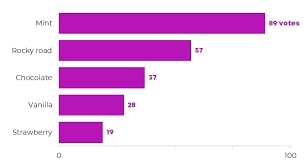
Image Source: gstatic.com
This type of bar graph helps you represent data regarding the different sub-groups present in the primary group or category. Separate bars are used to define the different sub-groups and are color-coded or patterned for differentiating them. In a grouped bar graph, you will always find a key or legend that describes each of the bar relating them to the sub-groups.
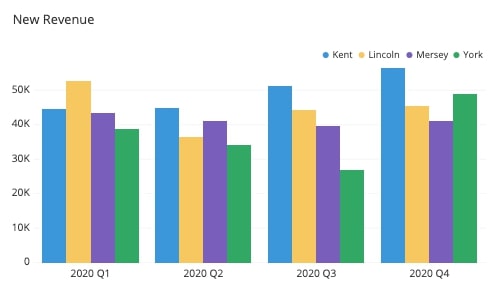
Image Source: gstatic.com
A stacked bar graph is much like a grouped one. Except that the bars are not set side-by-side instead of stacked on top of the other (for vertical bars). The total height of the bars represents the full value of the category. And each of the stacked parts defines the contribution of each of the sub-groups w.r.t., the whole group.
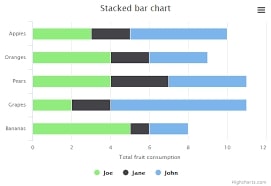
Image Source: gstatic.com
Examples of Bar Graphs
Here we will look at three different models of the types of bar graphs we discussed above. We will take the problem statement and see how the graphs can represent the data given there.
1: Number of students passed in a test comprising of five different subjects.
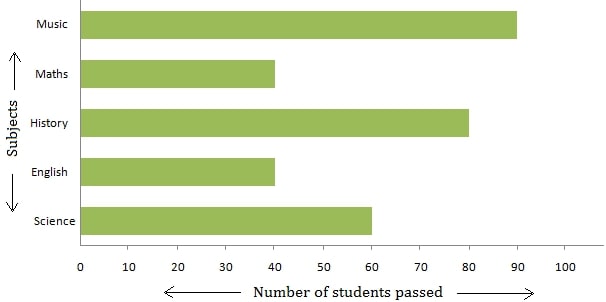
Image Source: gstatic.com
- The graph used: Horizontal Bar Graph
- X-Axis: Number of students passed
- Y-Axis: Subjects (English, Maths, Science, History & Music)
2: Sales of five different furniture for the years 1993 & 1994.
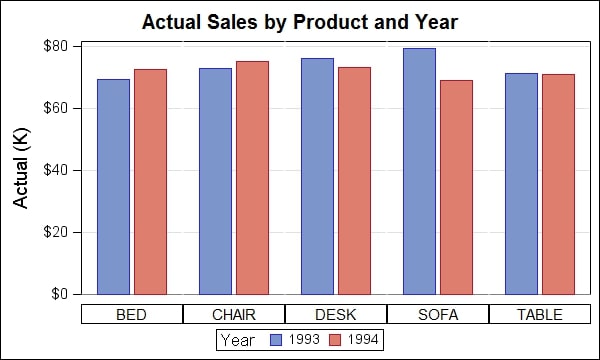
Image Source: gstatic.com
- The Graph used: Grouped Bar Graph
- X-Axis: Furniture types (Bed, Chair, Desk, Sofa & Table)
- Y-Axis: Sales figures in USD
- Color-coding: Blue for the year 1993; Red for the year 1994
3: Quarterly sales of a product in the four geographical locations of a country in the year 2016.
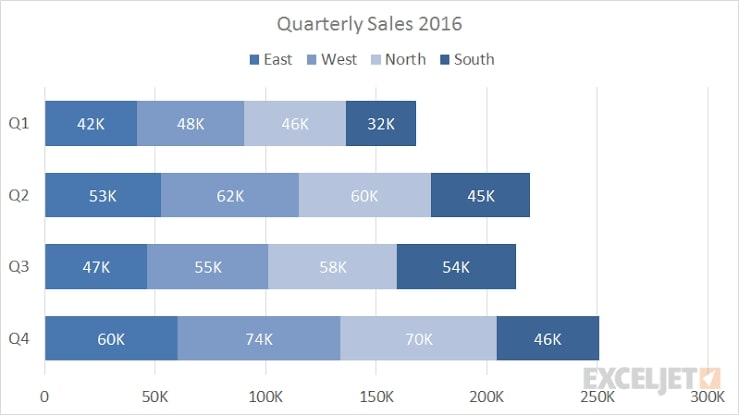
Image Source: gstatic.com
- The Graph used:Stacked Bar Graph
- X-Axis: Sales figures
- Y-Axis: Four Quarters of a year
- Stacking-order: East > West > North > South
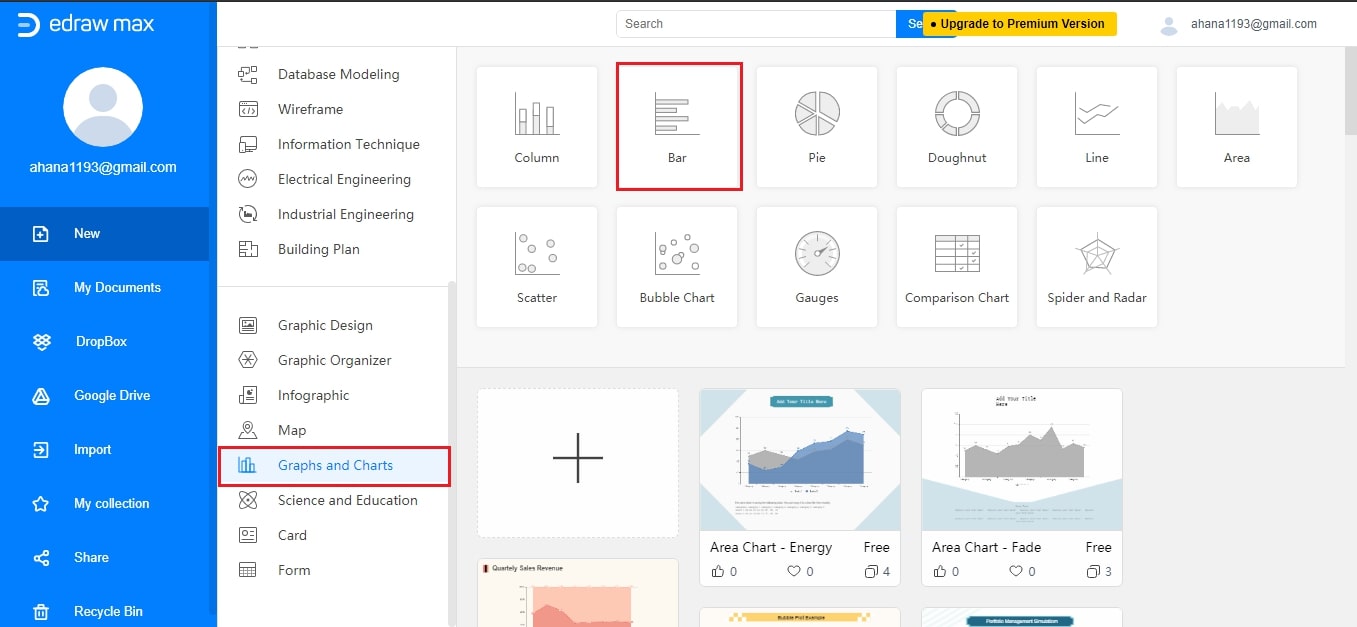
How to create a Bar Chart with EdrawMax Online?
Initially, the bar chart got made with pen and paper, but nowadays, you can use online tools. One such easy-to-use online tool is the EdrawMax Online, one of the best diagramming tools.
There are a few necessary steps which guide the concept of drawing a bar chart:
- Read the problem statement thoroughly and understand the underlying variables;
- Study the data values and choose the scale accordingly;
- Mark the data categories on the vertical Y-axis and the benefits on the horizontal X-Axis;
- Draw the bars for each of the data categories taking into account their values;
- Label the graph with the appropriate title and mention the scale and legend (if applicable).
So now, let us see how we can use this concept to draw a bar chart with EdrawMax Online:
You can now add titles and scales and save your project on the cloud or your device.
Limitations of Bar Charts
Even though a bar chart can skillfully represent data, but there are a few limitations to its practical application.
- It cannot explain the inter-dependencies of the included variables in a study.
- Also, it does not indicate the progress of work, thus nullifying its use as a control device.
- Estimations play a significant role in creating a bar chart, and as such, any deviation in the estimated values would disregard a bar chart created with error-filled values.