How to Make a Graph or Chart in Excel
Whether in ordinary study or work, we always have to deal with different kinds of graphs or charts. Graphs and charts help us visualize the data to make it easier to interpret information. Thus, it’s also important to know how to make a graph or chart in data process program like Excel.
Differences between Graph and Chart
As for graph and charts, we usually say that they are similar but with a few differences. Charts visualize the information in the common form of tables, diagrams and graphs and graphs will focus on presenting the mathematical relationships among series of data.
In other words, the group of charts is included all types of graphs so that graphs are a kind of charts for presenting mathematical relationships upon most occasions.

Image Source: Pixabay
Graph and Chart Types in Excel
Excel provides a lot of different types of charts for users and some frequently used types of graphs such as line graph, column graph and bar graph are also offered in this program.
In Excel 2016, there are 9 main categories of charts or graphs and these categories can be divided into 15 subcategories according to the usage purposes.
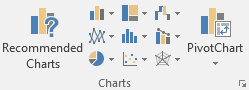
Go to Insert tab, find Charts group and you will see the nine chart icons, which represent respectively:
- Column or Bar Chart
 : to visually compare values across a few categories, including column charts and bar charts.
 - Hierarchy Chart
 : to compare parts to a whole or when some columns of categories from a hierarchy, including treemap and sunburst.
 - Waterfall or Stock Chart
 : for waterfall chart, it’s to show cumulative effects of a series of positive and negative values; for stock chart, it’s to show the trend of a stock’s performance over time.
 - Line or Area Chart
 : to show trends over time (year, month and day) or category, including line graphs and area charts.
 - Statistic Chart
 : to show statistic analysis of data, including histograms and box and whisker plots.
 - Combo Chart
 : to highlight different types of information with mixed types of charts or graphs.
 - Pie or Doughnut Chart
 : to show the proportions of a whole, including pie charts and doughnut charts.
 - Scatter (X, Y) or Bubble Chart
 : to show the relationships between sets of values, including scatter charts and bubble charts.
 - Surface or Radar Chart
 : for surface chart, it’s to show trends in values across two dimensions in a continuous curve; for radar chart, it’s to show values relative to a center point.
When you select the data division in the worksheet, click Recommended Charts, the Insert Chart window pops up and you will see the recommended charts provided by Excel for the selected data, which is convenient for users.

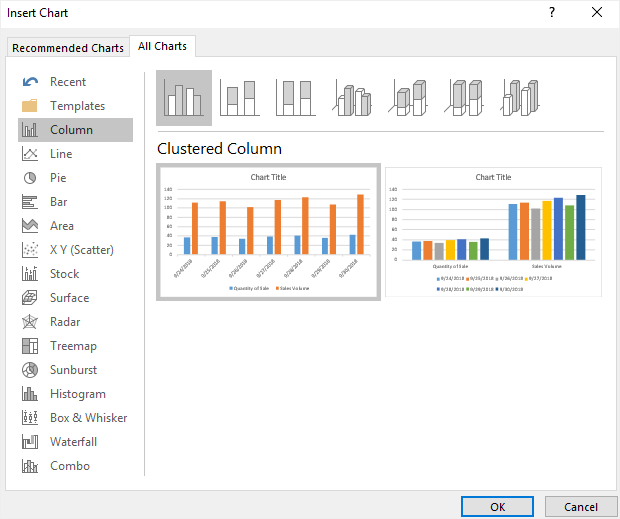
In addition, you will see the 15 subcategories of charts or graphs in All Charts window. You can choose the desired types of charts or graphs according to your purposes of data visualization and you can pause the point on the icons to see a preview of your document.
How to Make a Graph or Chart in Excel
In this section, we will show you how to make a graph or chart in Excel with the example of making a column graph.
Step 1: Enter Data into a Worksheet
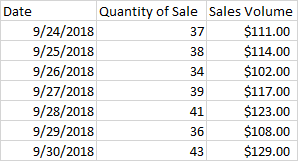
Open Excel and add a new worksheet. If the data that you will input is not really huge or complicated, you can enter the data manually.
If not, you can go to the Get External Data group on Data tab and find the suitable importing option to import your data into Excel.
Step 2: Select a Chart Type
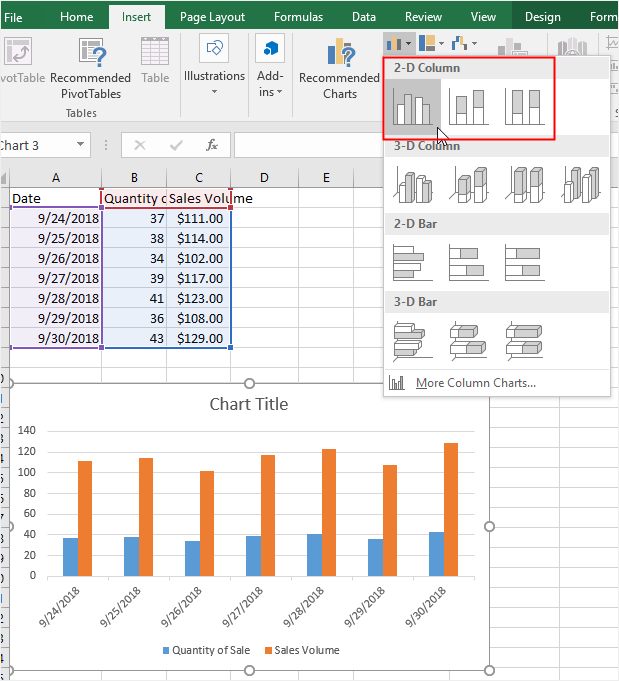
Go to Insert tab, and choose the desired chart type in Charts group or open Insert Chart window to find the desired chart type in chart type list.
Today, we will make a column graph to visualize the sales data, so we will choose the desired column graph type in Column or Bar Chart option and the corresponding example chart will show on the worksheet.
Step 3: Create Your Chart
After you choose the favored chart type, click the icon and Excel create the column chart automatically.
To rename your chart, you can double-click the Chart Title textbox and enter the new name for the column chart.
Step 4: Format Your Chart
When you created your chart or graph on the worksheet, you can format your chart or graph with multiple formatting tools.
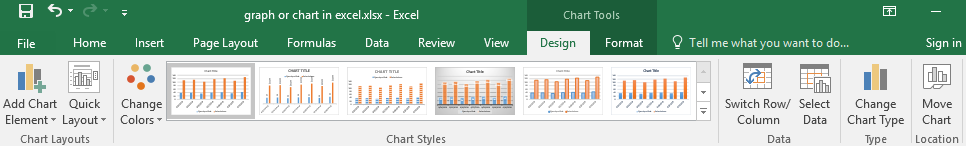
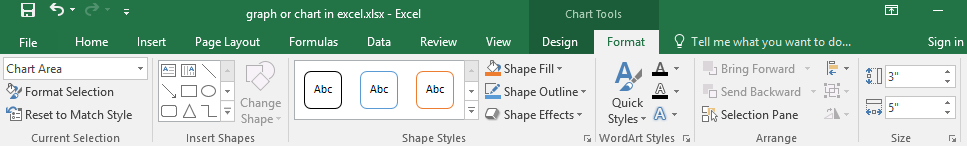
a. Chart Tools
Chart tools includes Design tab and Format tab and you can use them to modify the formats of your chart and text. Please note that the specific options on the two tabs will change when you create various charts or graphs.
In Design tab, you can add chart elements, change chart layouts quickly, change chart colors, modify chart types (for example, make a column graph turn to a line graph).
In Format tab, you can change the current selection area (from the whole chart area to one of the series), modify formats and alignments of inserted shapes and text, etc.
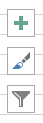
b. Floating Buttons
Select the column chart and the floating buttons will pop up on the worksheet. The plus icon is Chart Elements, which has the same options with Add Chart Element button. The pen icon is Chart Styles, which is to set a style and color scheme for your chart. The filter icon is Chart Filters, which is to change the visibility of data categories and names on your chart.
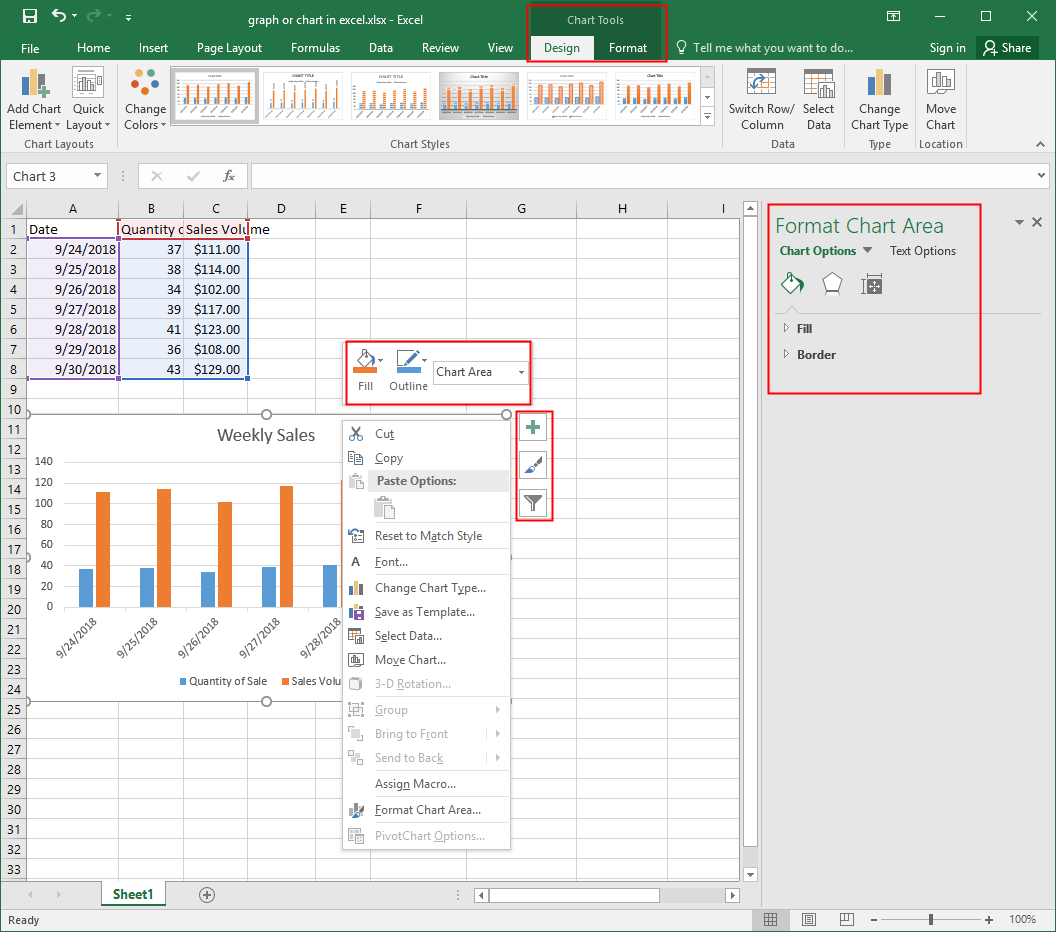
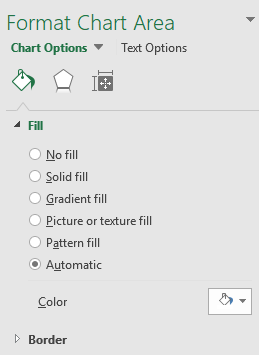
c. Format Chart Area Pane
Click Format Selection button on Format tab to open Format Chart Area pane. In this pane, there are various chart options and text options so that you can carefully change the styles, effects, sizes of charts and text (boxes) at any time.
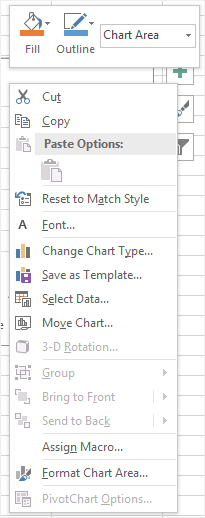
d. Contextual Menu
Right-click on the chart and the contextual menu will appear on the worksheet. On the contextual menu, you can change fill color and outline color of the chart quickly, and are also able to modify the selection area of the chart.
Besides, you can choose to change chart type, save your chart as a local template or click Format Chart Area… to open the right pane.
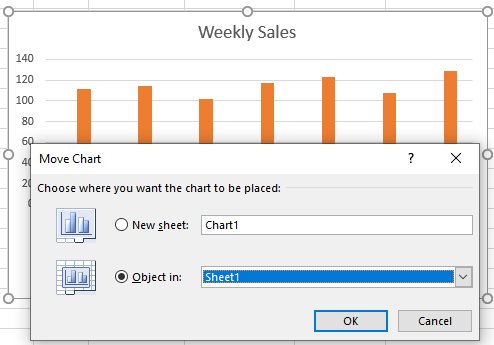
Step 5: Move Your Chart
Click Move Chart on Design tab or the contextual menu and the Move Chart dialogue box appears. You can either create a new sheet for the selected chart (New Sheet option) or place the chart into another sheet of the document (Object in option) and click OK.
How to Make a Graph or Chart in EdrawMax
Step 1: Select Chart Type
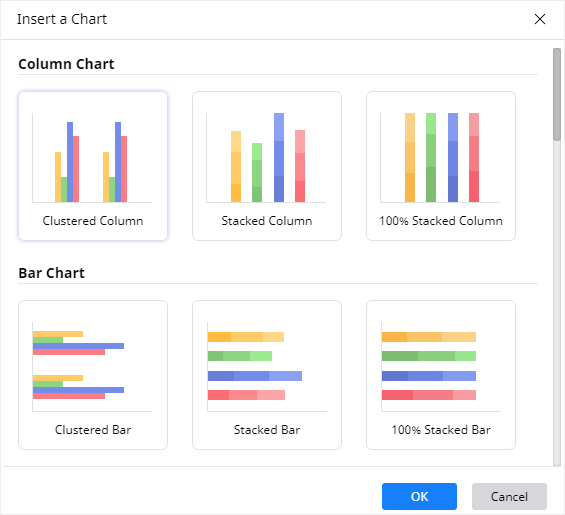
When you open a new drawing page in EdrawMax, go to Insert tab, click Chart or press Ctrl + Alt + R directly to open the Insert Chart window so that you can choose the desired chart type.
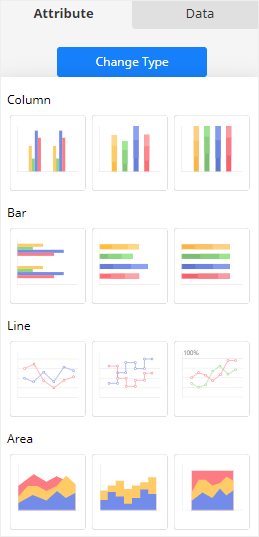
In the pop-up window, you can select any chart type that you like, click the icon and then click OK. In EdrawMax, there are 9 kinds of graphs and charts, including
- Column Chart
- Bar Chart
- Line Chart
- Area Chart
- Scatter Chart
- Radar Chart
- Pie/Doughnut Chart
- Gauges Chart
- Funnel Chart
Step 2: Create Your Bar Graph
After you select the desired graph or chart type and click OK, the example graph or chart will appear on the drawing page with the Chart pane. Here we choose to insert a basic clustered column chart into the page.
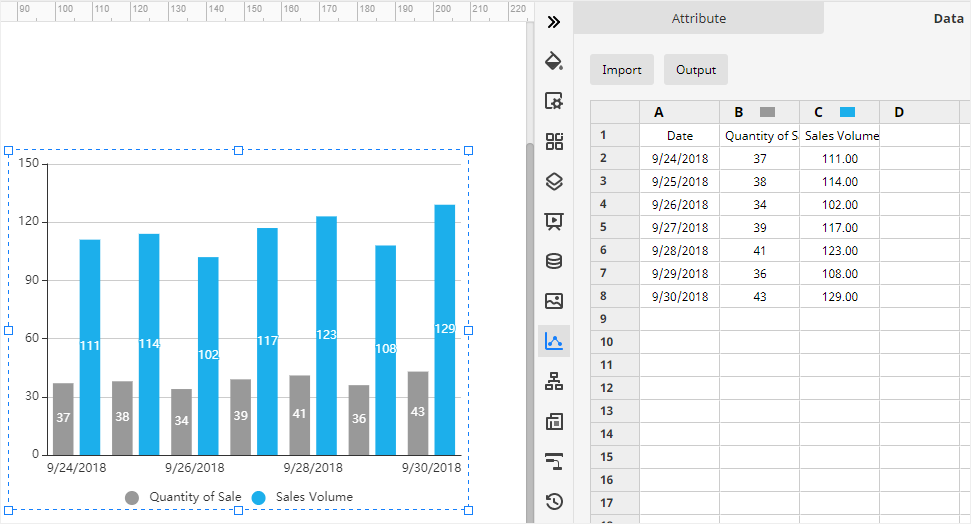
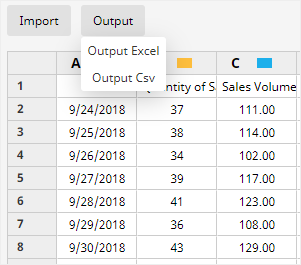
Then you need to import or enter the data for making the bar graph. EdrawMax supports users to import xlsx or csv files.
Go to Data pane, click Import, find the data file in the local storage and click Open. Then you will see the data that you want to use appear on the Data pane, and at the same time, the column chart on the drawing page will also be changed according to the imported data.
Note : the data of each series should not contain currency symbols or any other symbols in order to make sure the software can identify the specific numbers correctly.
Step 3: Format Your Graph or Chart
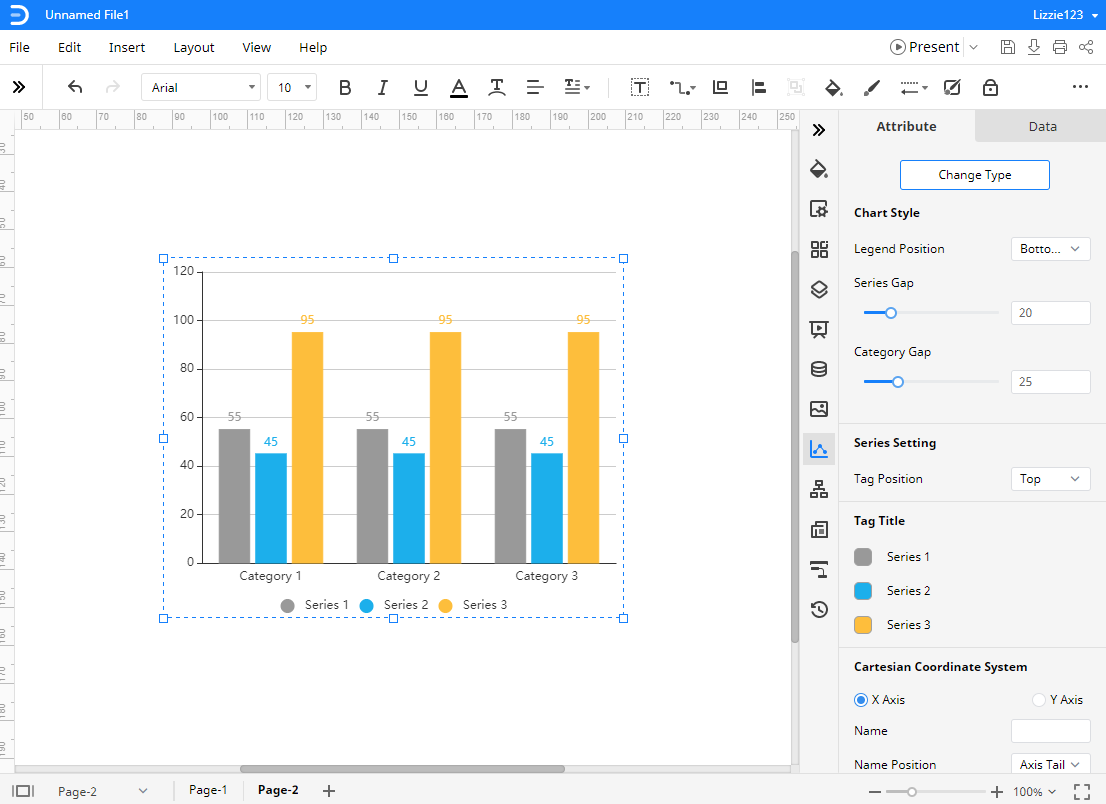
On the Attribute pane, you can change the format and various attributes of the graph or chart freely, which include Chart Style, Series Setting, Tag Tittle, Cartesian Coordinate System and Data Format. You can format the graph or chart as you like with the above formatting areas.
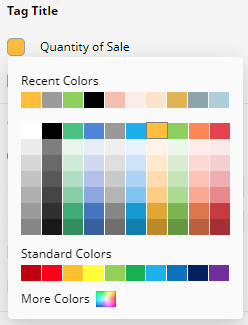
Especially, if you don’t like the color of the column, you can go to find Tag Title, click the color icon next to the labels and find the desired color on the drop-down menu.
Step 4: Change Graph Type
In addition, EdrawMax also supports users to change chart types.
Step 5: Export Data File
When you have to save the data used for making the bar graph in EdrawMax Online, select the graph, go to Data pane and click Output to choose the file type that you want. At present, EdrawMax allows users to export the data as the file types of xlsx and csv.
How to Export an EdrawMax Chart to Excel
When you finish making a graph or chart in EdrawMax Online, you are also able to save and export the graph or chart as an Excel file.
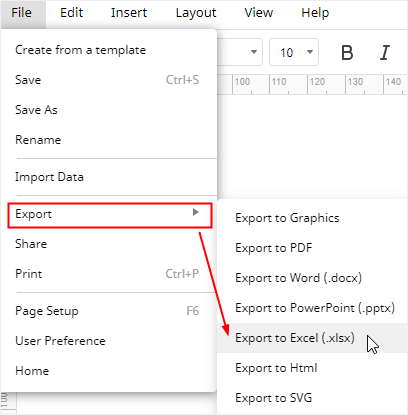
Go to File tab, click Export > Export to Excel, and EdrawMax will automatically save and download the created graph or chart as an Excel file. So you can get a graph or chart in Excel format. All the Microsoft Office files exported from EdrawMax are editable.
Thus, there will be less trouble or difficulty in creating a graph or chart with the help of EdrawMax, and you can freely share your graphs and charts made by EdrawMax with your colleagues or friends who don’t use EdrawMax.
In addition, you and your friends are able to edit and modify the exported graph or chart in Microsoft Excel (only for 2013 or above version) directly.