Repetition in Flowcharts: What Is It, Examples & How to Draw One?
Don’t you know what the repetition flowchart is? Read this guide to understand this idea with repetition flowchart examples. It also presents a credible tool for drawing flowcharts.
A flow chart is a diagram or a picture that presents a series of separate steps of a computer algorithm, system, or process in sequential order. This diagram uses a couple of symbols (like oval, rectangle, parallelogram, diamond, and arrow) to represent different functions. Every symbol has a unique function to perform.
Though there is a long list of steps in a flowchart, this article specifically focuses on what repetition in flowcharts is. In addition, it presents a few examples to understand this idea and how you can draw a flowchart with repetition easily. Let's get into the detailed specifics.
1. What Is Repetition in a Flowchart & Why Is There a Repetition in Flowcharts?
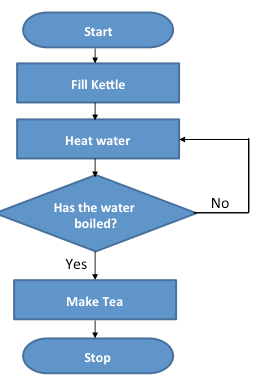
Do you want to continue a process in the flowchart until a specific goal is achieved? If yes, a loop is used to do this job. This is what is known as repetition. A flowchart with repetition is commonly called a repetition flowchart. A condition that determines how many times a loop should run is put into the diamond box. A flowchart depicting the process of making tea is shown below. In this chart, the loop will keep repeating until the water gets boiled.
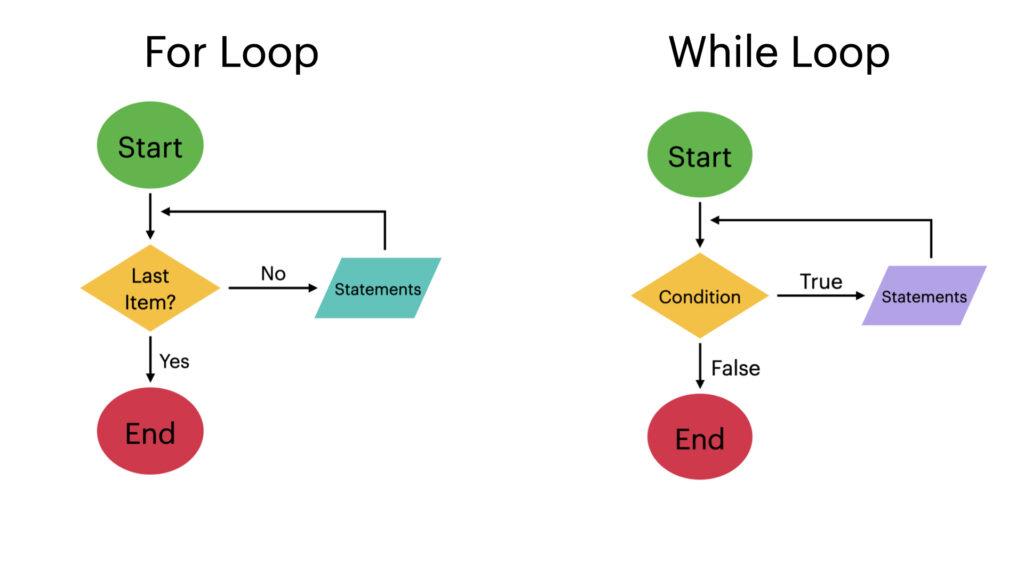
Now that you are familiar with the fact that repetition is used in flowcharts to repeat a particular function until the desired condition is met. There are two types of repetition loops in flowcharts, i.e., "for loop" and "while loop."
As far as the for loop is concerned, it keeps repeating the process until the last value in the range is used. On the other hand, while loop executes the statement as long as a condition is met. Both loops are presented below.
Let's now explore some examples to get into the details of how repetition flowcharts work.
2. A Few Examples of Repetition in Flowcharts
Below is a list of a few repetition flowchart examples. Make sure you go through them carefully to get a clear picture of how repetition in flowcharts plays its part in different tasks.
#1 Product Launch Day Plan | Dichotomous Flowchart
The word "dichotomous" refers to the situation where branches are created in two sections. In other words, branching in two directions until you receive a conclusion is known as a dichotomous flowchart or dichotomous key. This chart is commonly used in science education to reach a conclusion. For this, scientists design a couple of yes/no questions.
For example, you can use a dichotomous key to identify organisms that are further classified into different groups. Similarly, scientists often use a dichotomous flowchart to classify living things like fungi, animals, and trees.

 below.
  below.
 #2 Payment Flowchart
If you want to receive payments for your products or services, you can create a repetition flowchart to make the job easier for you. It will help you automate the overall process. The picture below shows a payment flowchart drawn in Wondershare EdrawMax.
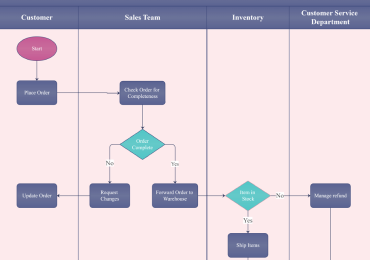
This chart is associated with a room booking service, as you can see below. The process initially requires customer information and notes down the check-in and check-out times of the customers. Later, it checks for whether or not a room is available.
If a room is available, the process moves toward selecting the most suitable room and collecting the payment for it. In case the room is not available, flowchart will repeat until the customer finds the room. This is how repetition works in this payment flowchart.

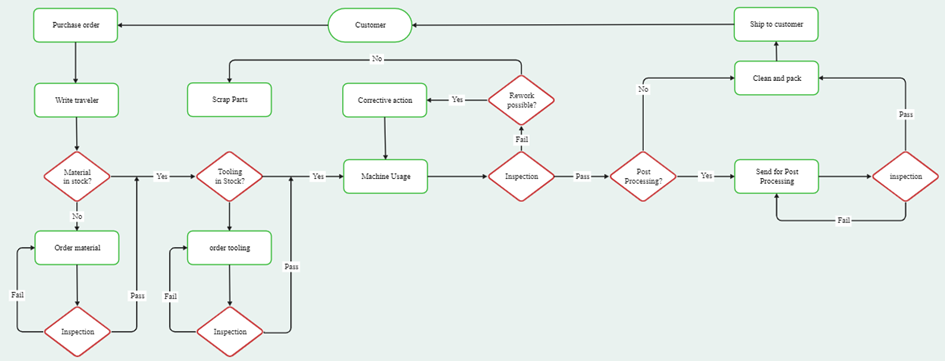
#3 Manufacturing Flowchart
The manufacturing flowcharts are prepared to present a complete step-by-step guide to how the end product is formed. They cover everything from raw materials reaching the manufacturing facility to processing phases and finishing the final goods.
The manufacturing process largely depends on what is going on in the current market. If the market has a good number of consumers and less stock to sell, the manufacturers work actively to meet the market needs.
If the raw material is available, the manufacturing team can start the process right away, but if it is not available, they need to order it first. This is where a flowchart repeats until the manufacturing material arrives at the facility. Below is a manufacturing flowchart created in EdrawMax.
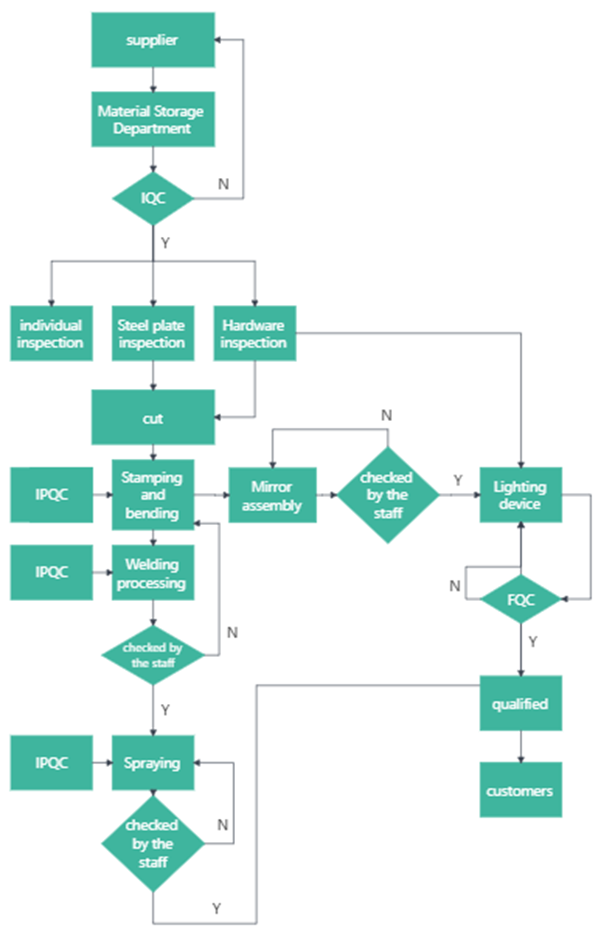
#4 Management Flowchart
As the name depicts, a management flowchart is a diagram designed to visualize and monitor how the management works on a project to achieve the desired end goals. The graphical representation of every important step helps the management clearly visualize the whole process.
While managing a project, the top phases the management takes special care of include; planning, staffing, organizing, controlling, and leading. Even if the project is completed, the management flowchart assists the management in determining the future scope of the project.
A management flowchart created in EdrawMax is shown below. You can see a couple of diamond-shaped boxes with arrows going upward. This is where repetition plays its part in assisting the management with what to do at a specific stage when managing a project.
Now, after going through a couple of repetition flowchart examples, you understand better what repetition in flowcharts is and how it helps people understand the complete process being carried out. The next section of this article will assist you in creating a flowchart with repetition.
3. Wondershare EdrawMax: An Incredible Utility to Draw Flowcharts with Repetition
Are you on the hunt for an efficient software or tool to make flowcharts with repetition? Concerned about protecting the secret information of your business? If yes, Wondershare EdrawMax is the utility you are actually looking for. You can use this tool online, which does not ask you to download any application. At the same time, the desktop version is also available.
What Makes EdrawMax a Source of Attraction
Being an all-in-one diagramming utility, EdrawMax offers hundreds of pre-built flowchart templates. Using the template saves you a lot of time and effort. All you need is to choose the desired template and edit it, keeping your requirements in mind. If you want to add every single detail to the flowchart by yourself, you can create it from scratch.
The flowchart is not the only diagram you can create with EdrawMax; rather, it enables you to make 280 types of diagrams. Furthermore, this tool is fully customizable, so you can upgrade the existing flowchart or create a new one that perfectly matches your needs.
Creating charts and sharing them in your social circle has become super easy with EdrawMax. It is available for Web, Windows, Linux, and Mac operating systems.
4. How Can You Create Flowcharts with Repetition using EdrawMax?
You can create a flowchart with repetition in EdrawMax both online and offline. A step-by-step guide presented below helps you make your flowchart online. All you need is to follow the below steps carefully.
- Step 1: Go to the official website of Wondershare EdrawMax Online.
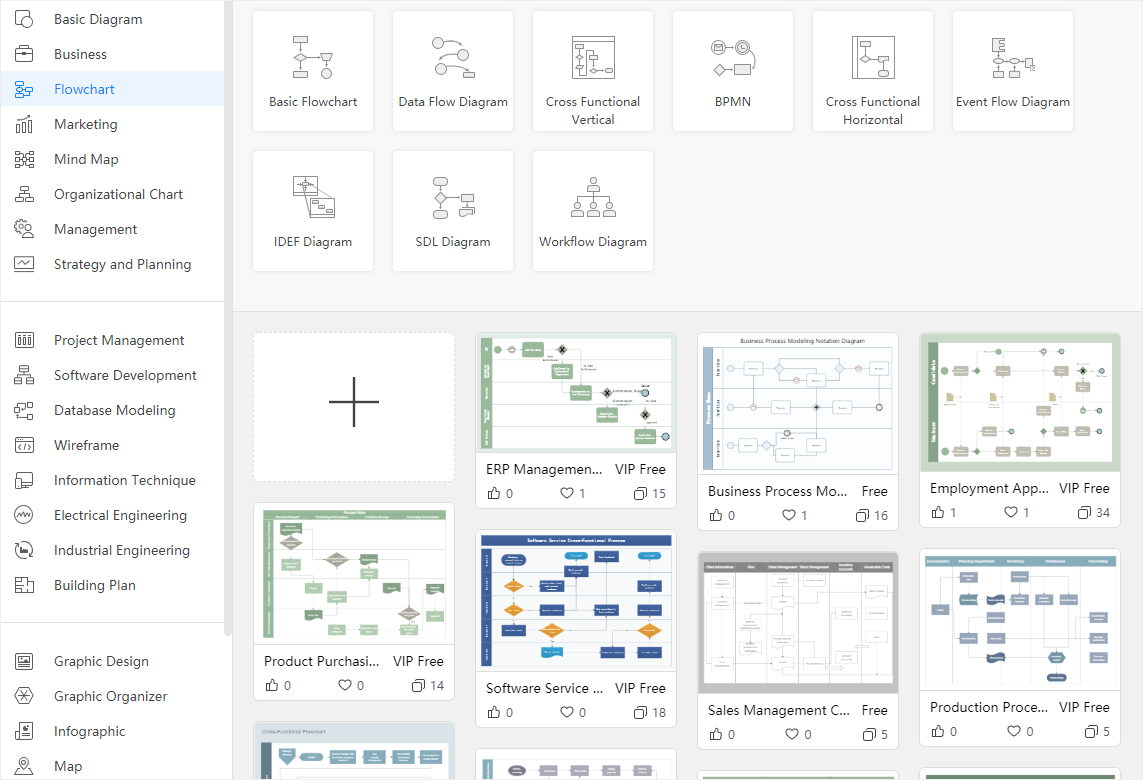
- Step 2: Go to the left panel and tap on "Flowcharts". Here, you will see a number of pre-made flowchart templates. You can use the suitable one to proceed with. If you want to make it from scratch, tap on the "+" button.
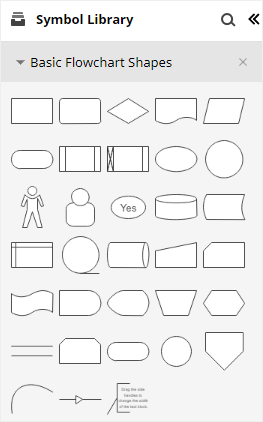
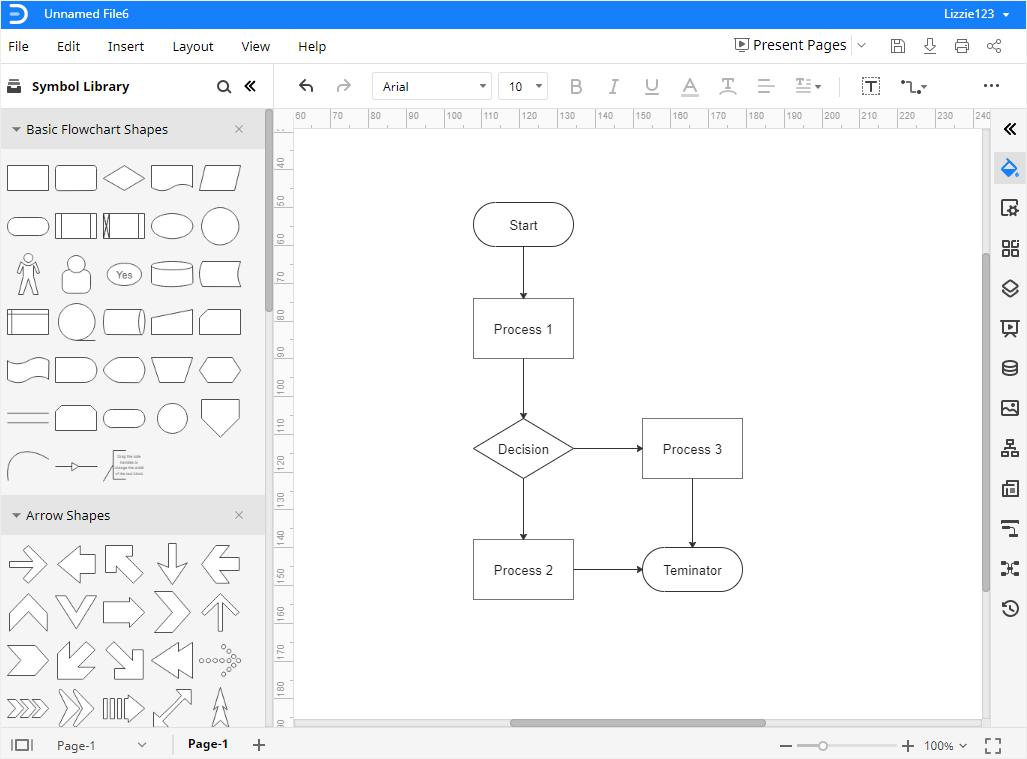
- Step 3: Now, go to the "Symbol Library" and select "Basic Flowchart Shapes", as shown below.
- Step 4: Hit the "Start/Terminator" symbol. Now, drag and drop this symbol on the drawing canvas. Once done, add more symbols you need to create the chart.
- Step 5: It is time to connect different symbols with each other. Tap on "Connector" and choose the connector type. Once you take connector lines close to the connection points of different shapes, they get connected automatically.
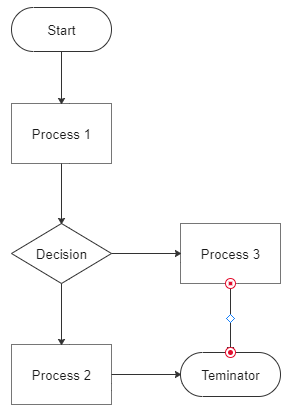
- Step 6: As soon as you add the desired symbols and connect them with each other, you will see a complete flowchart on your screen, as shown below. Now, you can customize the chart with different colors, font styles, and sizes.
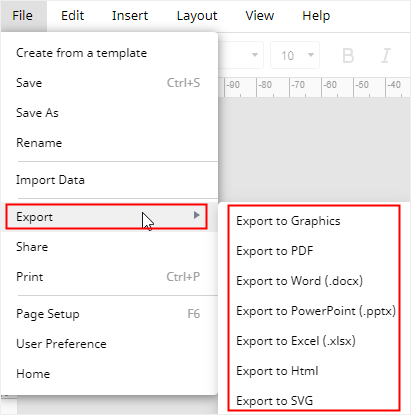
- Step 7: Now, go to the "File" menu, tap on the "Export" option, and choose your preferred file format. From the list, you will find SVG, HTML, Excel, Word, PDF, and graphics, as shown below.
You can also share your flowchart with others with a single click. All you need to do is to tap on the "Share" option and hit the "Share" button. You will find it in the upper-right corner of your screen. You can share your diagram with your friend even if he or she does not have access to EdrawMax.
Note: If you want to have the desktop version of EdrawMax, you can download EdrawMax from here. A free trial is also available to test all the basic features. The steps to follow to create a flowchart are pretty similar in online and desktop versions.
5. Frequently Asked Questions (FAQs)
Q: What is the repetition process called when drawing flowcharts?
A: The process of repeating a specific function to achieve particular goals is known as iteration. The more you repeat a process, the larger the number of iterations will be.
Q: What to use to repeat a process in a flowchart?
A: Well, a repeat loop helps you get this job done. Two types of loops, i.e., for loop and while loop, are available. You can select the one you find more suitable for your task.
Q: Which symbol is used two times in all flowcharts?
A: Though a couple of symbols can be used multiple times in a single flowchart, this is not true for every chart. However, the oval symbol is used twice in all flowcharts; one at the beginning and the second at the end. In other words, the starting point and the conclusion are displayed with oval symbols in all flowcharts.
Q: What if my flowchart is too long and occupies more than one page?
A: Long flowcharts make it challenging for most people to understand the complete algorithm or process. Therefore, it is always better to divide your flowchart into multiple small charts. Then, connect these charts with hyperlinks. The ideal flowchart should not be longer than a single page.
Q: Can flowcharts have multiple starting points?
A: No, make sure you draw your chart from one start point and end it on a single point too. However, a flowchart can have more than one endpoint.
6. Final Words
A flowchart is a diagram or a graphical representation of different steps (using various symbols) required to present a complete algorithm or process. These steps are provided in sequential order when drawing flowcharts. Every symbol has its functionality, and the diamond box is used with repeat loops for decision-making. Every repetition in flowcharts is called an iteration, and it continues until a specific condition is met.
Don't worry if you are unable to find trusted software to draw a flowchart with repetition. Instead, try Wondershare EdrawMax to do the magic for you. With a huge selection of built-in flowchart templates, your task becomes easier and simple at the same time. In addition, EdrawMax comes with enterprise-level security standards, so data protection is no more a problem. Give this utility a try, and you will surely be satisfied and happy with the outcomes.