How to Make a Funnel Chart in Excel
Funnel charts are often used to represent different stages in a sales or marketing process and show the amount of sales revenue or customer for each stage. In this article, you will learn two different ways to create a funnel chart in Excel.
How would you like to create your Funnel Chart?
Using an inbuilt Funnel Chart Template in EdrawMax
OR
Time to complete: 2 minutes
Manually create a Funnel Chart template in Excel
Time to complete: 30 minutes
How to Make a Funnel Chart in Excel
Using a Stacked Bar Chart
The first way to create a funnel chart in Excel is to use a stacked bar chart. You can follow the steps below.1. Open the Excel worksheet that you want to insert a funnel chart and input your data. Please note that the data in the column of Horizontal Space is essential. If you don’t add this column of data, the final chart may look strange.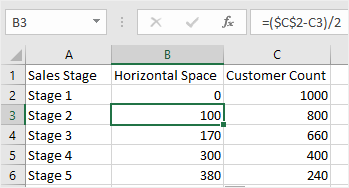 2. Select the data without the row headings (it’s A2: C6 in this example); go to Insert > Column or Bar Chart, select Stacked Bar.
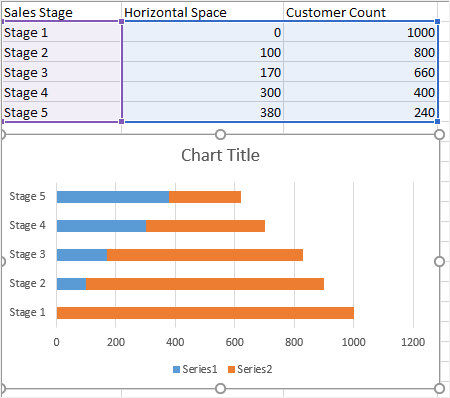 3. Right-click on the vertical axis, choose Format Axis on the contextual menu to open the Format Axis, then tick Categories in reverse order.
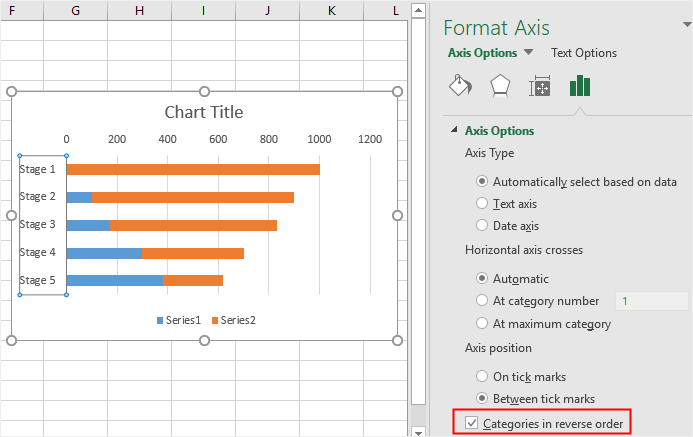 4. Right-click on the blue bar to select them all, choose No Fill on the contextual menu to make the blue bars invisible. Double-click on the chart title and type your own.5. Click on one of the orange bars to open the Format Data Series pane if you don’t close the right pane in Step 3. Then move the slider of Gap Width to 0%.
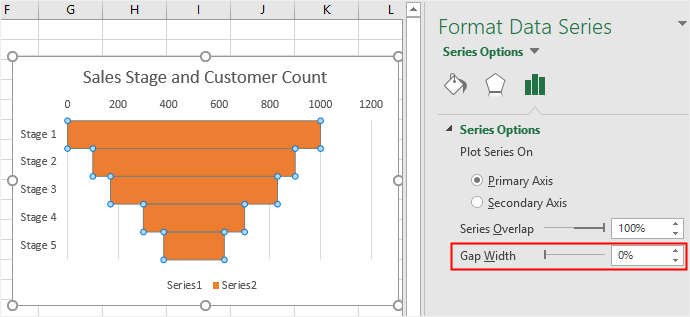 6. Similarly, you can change the fill color of the Customer bars. Use the Add Chart Element option next to the funnel chart to add data labels and delete legends
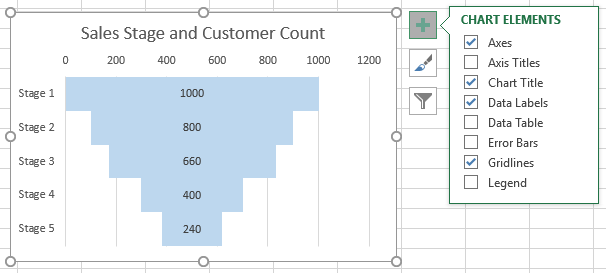 Using a SmartArt ShapeTo insert a SmartArt shape as your funnel chart, you can use an inverted pyramid from the SmartArt graphic gallery. Here’s how to do this with the following instructions.1. Go to Insert > SmartArt and select the Inverted Pyramid in the Pyramid2. Click the arrow icon to open the Text pane and input your data and information.
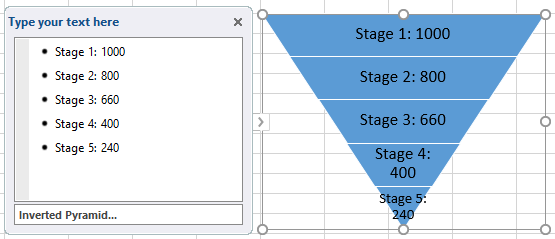 3. Select the chart and SmartArt Tools will show up on the ribbon. You can customize your chart with the editing options under SmartArt Tools, including Change Colors, Change SmartArt Styles, Add Shape, etc.How to Make a Funnel Chart in EdrawMaxNow, with (EdrawMax Online ), you are able to make a funnel chart more quickly with a few simple steps. Besides, after you sign up for EdrawMax, you can also use pre-made funnel templates in the template gallery freely.
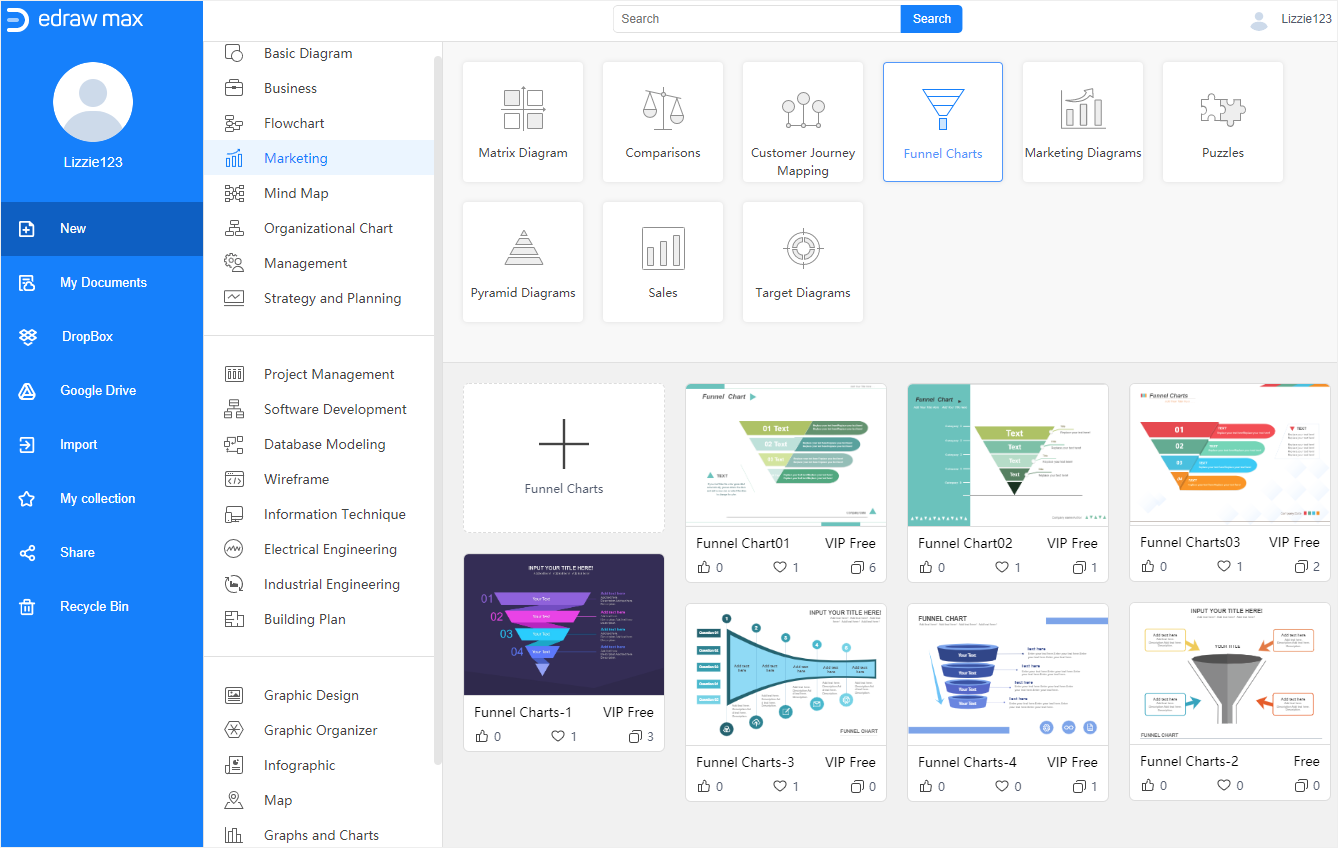 Here is how to create a funnel chart in EdrawMax from scratch. Just follow the steps below and it’s much easier than those in Excel.1. Enable (EdrawMax Online), click the plus icon on the template gallery and open a blank drawing page.2. Select Insert > Chart to open the Insert Chart dialog box, and choose the Funnel Chart.3. Select the example funnel diagram and change the example data with your own in the Chart (Data) There you only need to add stage titles and corresponding values.
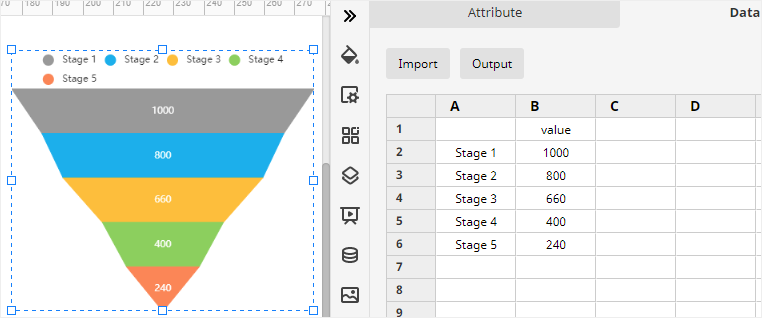 4. The formatting and editing tools in EdrawMaxOnline are mostly on the right pane and the toolbar. Users can try it several times and get familiar with the powerful drawing features in EdrawMax and then you will find a lot of surprises.
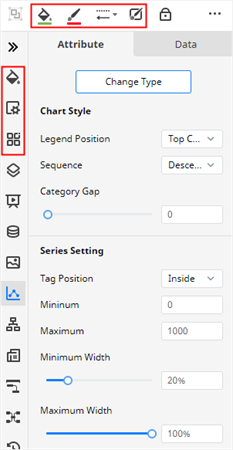 How to Export an Edraw Chart as an Excel FileWhen you complete your funnel diagram in EdrawMax Online, you can choose to save it in the cloud, export it in common formats or share it with others.Firstly, navigate to File > Save As and select to save your chart in Edraw personal cloud, Google Drive and Dropbox.Next, click Export, choose a format on the menu and the document will be saved on your computer automatically. Actually, EdrawMax allows users to export their documents as MS Office files and these files are all editable and printable in MS Office programs.
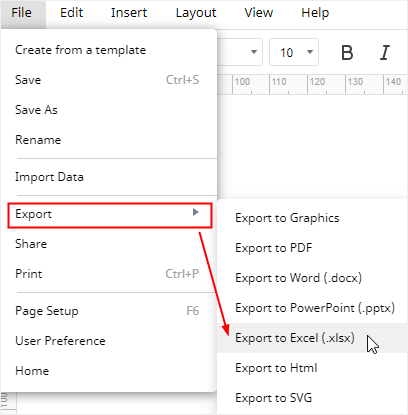 Finally, click Share on the menu or the upper right corner and then you can choose the desired way for sharing your funnel charts with others, such as a website link, a QR code and a piece of HTML code.
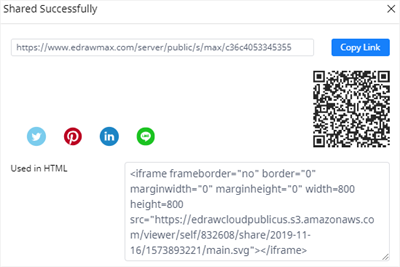 Try Free Online


