How to Make a Gantt Chart in Google Docs
Every time you have to track or discuss project processes, you may think that it will be great to have created a Gantt chart and share it with team members. There Google Docs would give you an answer, although the process can be tedious and a little complex.
How to Make a Gantt Chart in Google Docs
Step 1: Prepare Your Project Data
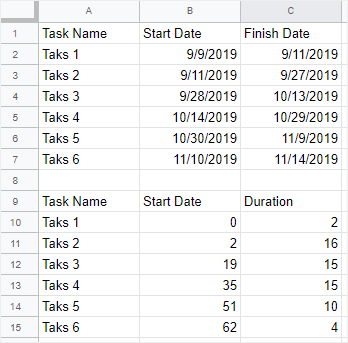
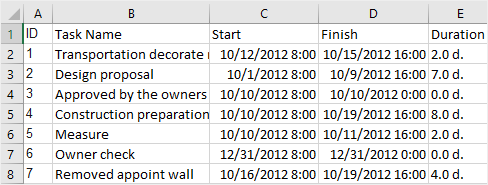
Before you make a Gantt chart, the first thing you need to do is to prepare the project data, which should at least include task names, start dates, finish dates and duration days. Then you can save the data in Your Google spreadsheet.
To know how to prepare the data, please (see the tutorial here).
Step 2: Insert a Bar Graph
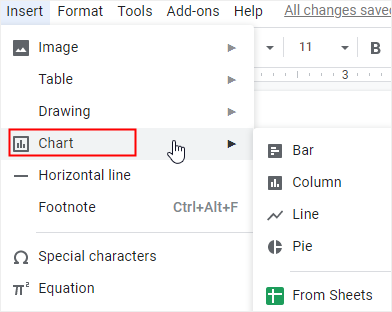
Open a blank Google document on Your Google Docs, go to the File tab, click Chart on the drop-down menu and choose Bar.
A bar graph will be inserted on the page, click the Open Source button on the upper right corner of the chart, an untitled spreadsheet is open.
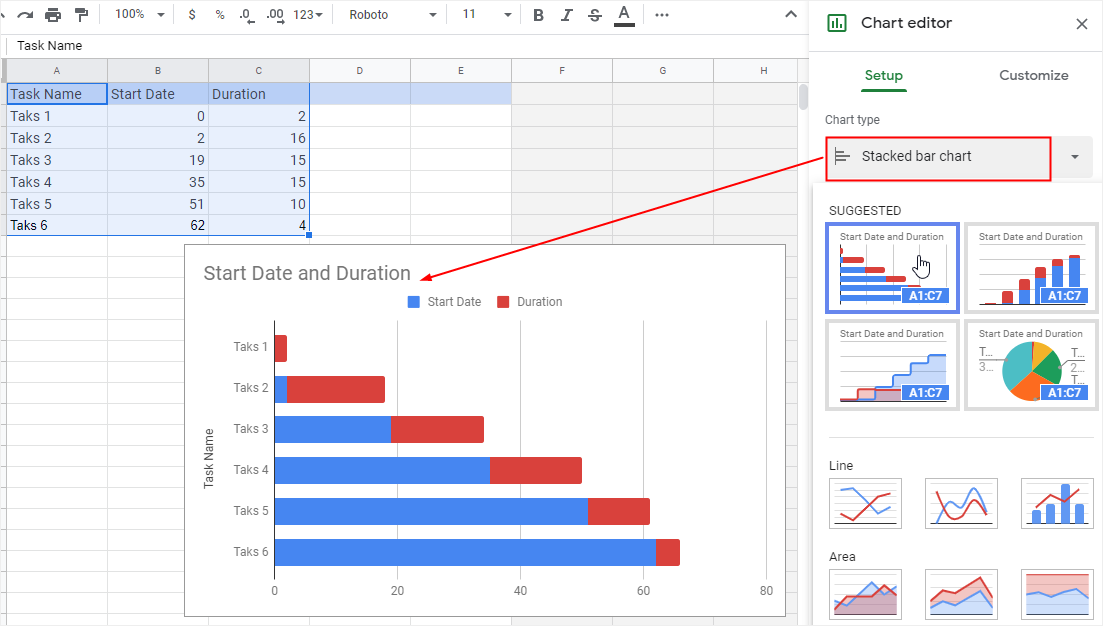
In the untitled spreadsheet, you need to paste the data (including task names, processed start dates and duration days) into the table, select Stacked bar chart on the drop-down menu. Thus, the example chart will become a stacked bar chart with the start date and duration.
Step 3: Transform the Bar Graph into a Gantt Chart
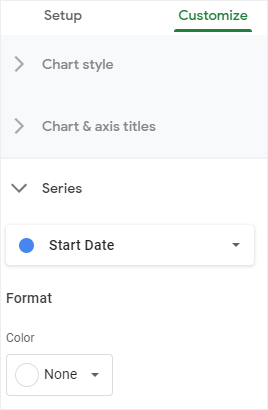
However, to make the bar chart look more like a Gantt chart, click to select all the blue bars (Start Date), go to the Customize tab on the Chart editor pane, then choose None on the Color option for the bars of Start Date.
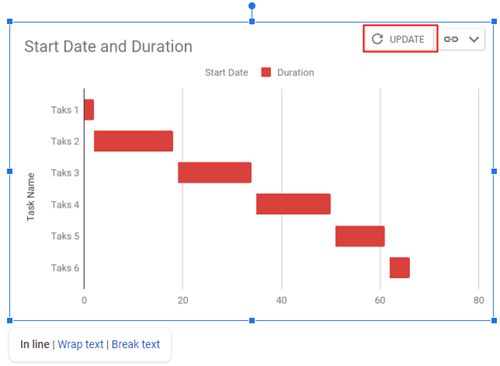
After all these instructions, you can go back to the document and you will see an update button on the chart. Click on the button, the original chart will turn into the Gantt chart you made.
Step 4: Insert a Chart From Sheets
Except for inserting a bar chart, you can also insert the Gantt chart from Google Sheets on the page directly.
Since you have to process the data in Google Sheets, you could (make a Gantt chart in Google Sheets) altogether.
Go to the File tab, click Chart > From Sheets. Follow the instruction, select the right spreadsheet, the Gantt chart would be imported into the page.
How to Make a Gantt Chart in EdrawMax
Frankly speaking, it’s a little bit troublesome to create a Gantt chart in Google Docs instead of Google Sheets or any project management software. Here we would tell you how easy it is to make a complex or large Gantt chart in EdrawMax, which is an all-in-one diagram maker.
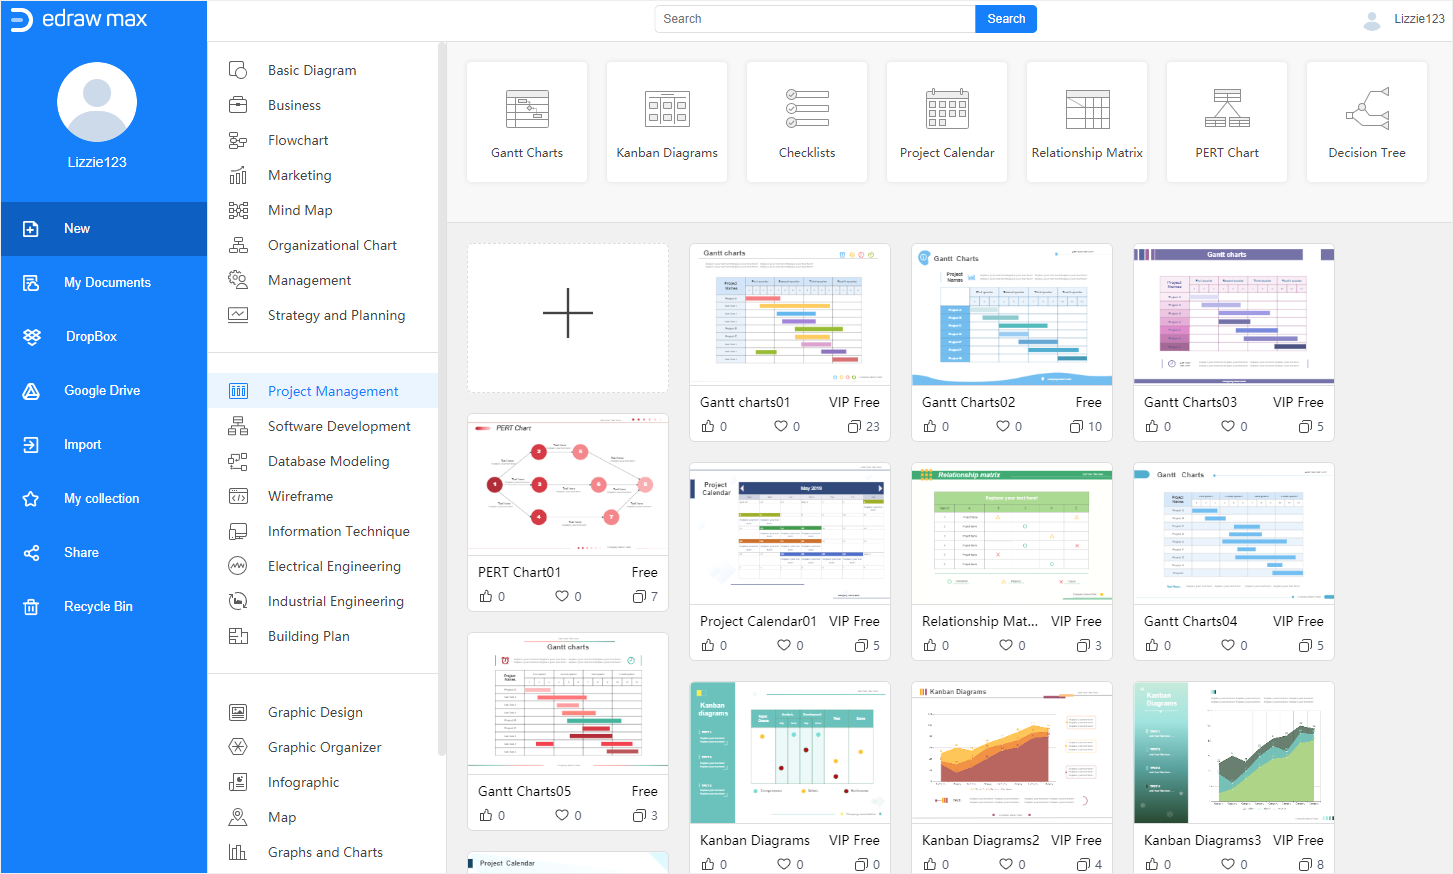
Step 1: Find Your Favorite Gantt Chart template
When you enter EdrawMax, you will find there are plenty of pre-made templates for users. Find a Gantt chart template that you like, click on the thumbnail to open the template, then you can type or paste text on the chart.
Step 2: Start From a Blank Template
If you intend to import your project data and let EdrawMax auto-create a Gantt chart, click on the plus icon and open a blank template.
Click on the Gantt Chart icon ![]() on the right sidebar, hit the Import button on the Gantt Chart pane. Follow the instructions to import the data and the Gantt chart will be like:
on the right sidebar, hit the Import button on the Gantt Chart pane. Follow the instructions to import the data and the Gantt chart will be like:
By the way, the data that you want to import should also include task names, start dates, finish dates, duration days, etc., as the below table is shown, so EdrawMax can identify the data of each task more correctly.
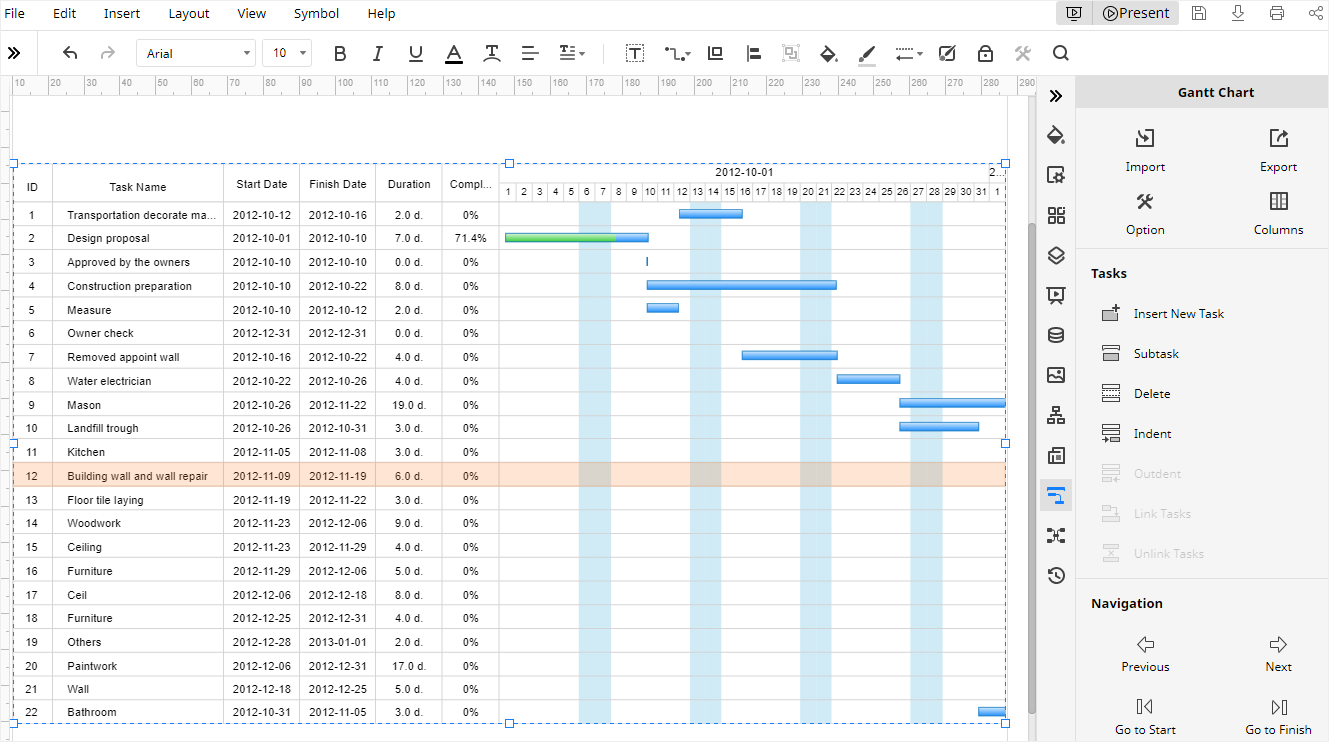
Step 3: Customize Your Gantt Chart
In EdrawMax, there are also lots of powerful formatting tools to help users customize Gantt charts or other kinds of diagrams.
If the Gantt chart is auto-generated by EdrawMax, you can go to the Fill/Line/Shadow pane (![]() ) and Gantt Chart pane for changing fill colors, line styles, shadow effects or modifying task information.
) and Gantt Chart pane for changing fill colors, line styles, shadow effects or modifying task information.
How to Export a Gantt Chart to Word
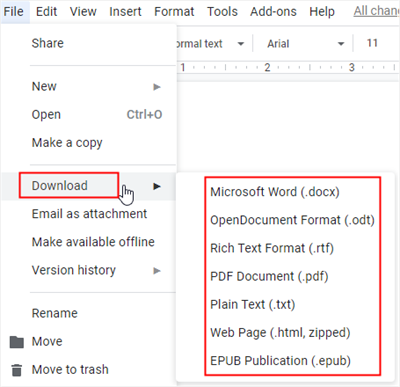
In Google Docs, you can download the Gantt chart as many common document formats. Go to the File tab, click Download on the drop-down menu and you can select Microsoft Word (.docx) on the menu, therefore, the Gantt chart will be saved on your computer as a Word file.
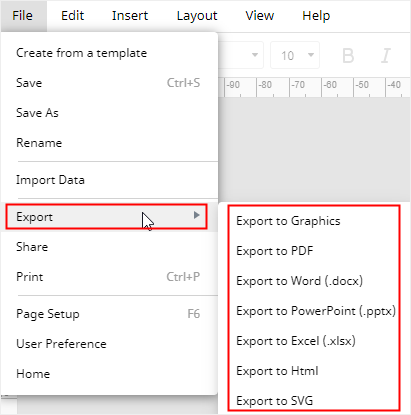
In EdrawMax, go to File tab, click on Export on the drop-down menu. EdrawMax supports to export EdrawMax diagrams into different file types like graphics (.png or .jpeg), PDF and MS Office file formats ( .docx, .pptx and .xlsx) .
What’s more, all the MS Office files exported from EdrawMax are editable and printable. So you don’t need to worry about that non-Edraw users can’t view or edit your Gantt charts.