Graphic Organizer Examples
Graphic organizers are handy tools by which learners can organize their thoughts and fill or build upon ideas using a diagram or visual map. Students will find that graphic organizer examples help to facilitate learning. Areas of focus are identified about a broad topic which can be a subject or a topic of any kind. Learners are able to make connections as well as structure their thinking. For such reasons, students can use graphic organizers to write their projects.
1. What is A Graphic Organizer
The graphic organizer examples are usually helpful tools for students, which act as visual learning strategic tools. These are usually applied across different curriculum and enhance learning as well as understanding of a certain subject matter or content. There are a variety of different formats available, depending on the task. These can act as tools of instructions or graphic organizer examples for elementary students.
Teachers can make use of graphic organizer to illustrate knowledge of a section in a text or topic, also showcasing which are the areas where one needs to improve. The forms of graph organizers are several such as mind maps, concept maps and webs like
2. Benefits of Graphic Organizers
There are several ways to benefit from using graphic analyzers in the learning and teaching processes. The graphic organizer examples are used in corporate training sessions as well.
-
Showcasing Relationship
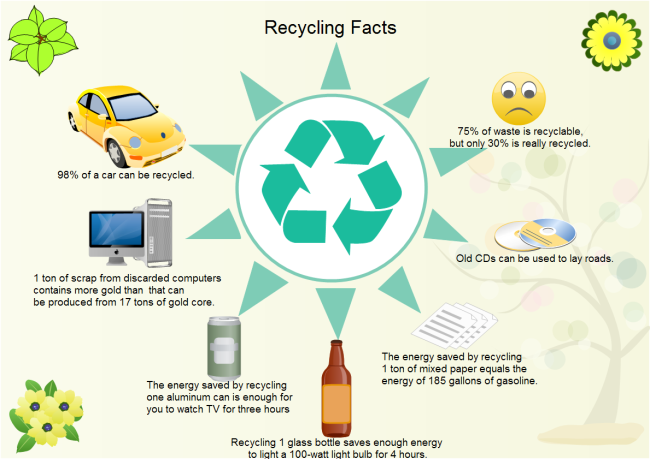
This is the key benefit of using such illustrations. The graphic organizer examples for elementary students are different tools provided to draw up diagrams using different symbols, connectors and shapes. These help to visualize the relationship among components on the map. An instance is Venn diagrams which help students to understand what the points are in common as well as differences that lie between the different components.
Other instances are cause and effect diagrams or mind maps that are helpful in showcasing causes and effects as well as helping to boost creative thinking in students. Flow charts are designed to present sequence relationships.
-
Simplify and Visualize
It is said that a picture is worth a thousand words. That is what graphic organizers can help in, by simplifying ideas that are complicated and help people to visualize them. Most ideas are learned better with visual aids.
-
Organizing Information
When information is large and scattered, it becomes difficult for a student’s mind to comprehend all at once. With such tools, information can be presented in a logical process and learning is easier and so is memorizing information. Structuring information in such analyzer tools also helps to remember chronological sequences much better.
3. Top 12 Popular Graphic Organizer Examples
These tools or visual diagrams are most used in high school education. Here are some popular and ready-made graphic organizer templates that are found easily and are effective for most educational and even professional presentations.
-
Flowchart
This is the most common yet effective way to show how things work or how a process flows. In such diagrammatic representations, operation sequences are shown which need to be performed in a step by step manner to find the solution to a problem. For any instance how to unclog a blocked drain. Find out more flowchart examples.
-
Venn Diagram
This is a diagram wherein relationships between different data sets, objects and groups are shown along with where the similarities lie. It is often represented by two or more circles that overlap and show logical relations between different sets. For any instance similarities and differences between two sets A and B. Find out more venn diagrams examples.
-
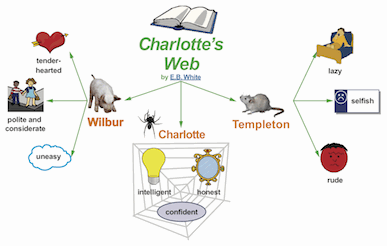
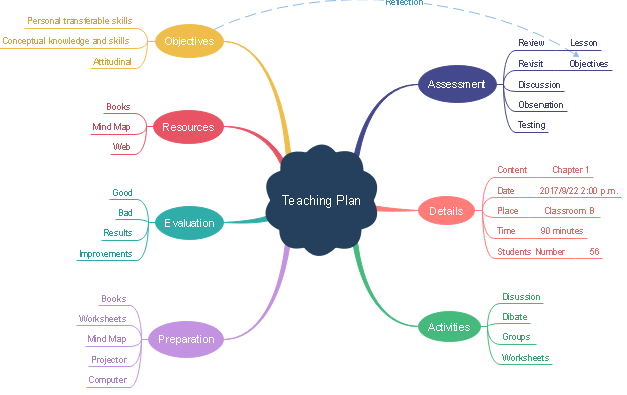
Mind Mapping
This is a way to represent notes, learning, creative ideas and tasks that are linked around a central idea or keyword. These are akin to notes that are taken around a brainstorming session or idea. It helps to showcase how creative ideas evolve around a subject. Mind maps are created around texts or single words that are put in the center and concepts, words and ideas evolve around them. Example, a corporate product, and its intended uses. Find out more mind mapping examples.
-
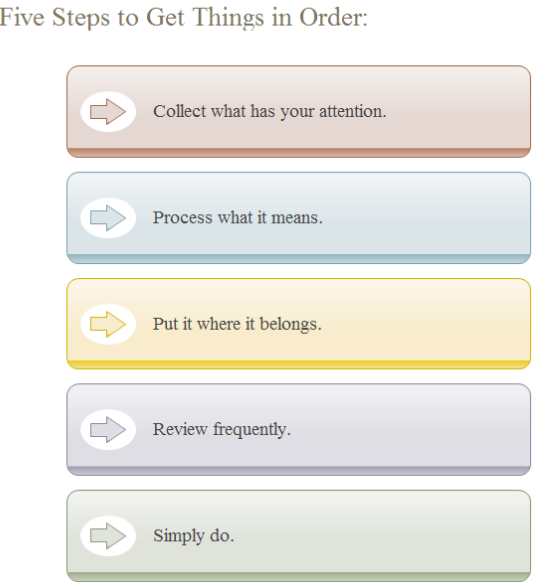
Step by Step Chart
In such a chart step by step procedures or changes are written down. It can comprise steps, topics or series in a certain order. Ticketing at a railway station can have procedures listed with such a tool and can act as graphic organizer examples for elementary students.
-
Sequence Chart
In such a diagram different processes and their flows are showcased. For instance, events or steps in a surgical operation are listed in order with such a diagram tool. Find out more sequence charts examples.
-
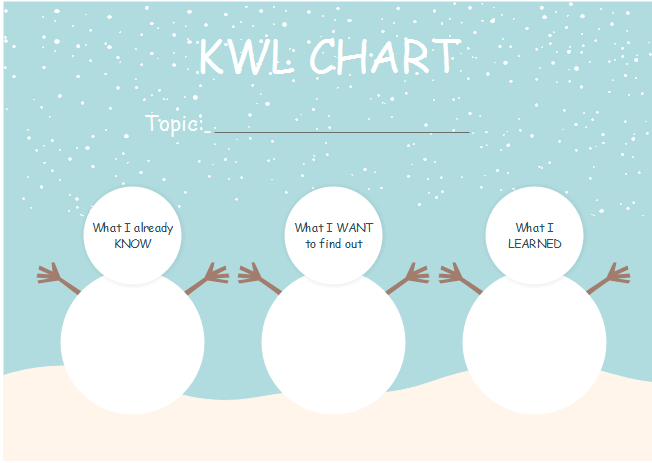
KWL Chart
In such a chart diagram one can show how to gather information, come up with a problem solution and think through a certain topic. For kwl chart example, it can help to track what a student is aware of, needs to know and what knowledge he or she has acquired about the topic.
-
Spider Chart
This showcases how a central idea can be linked to several ideas and sub-ideas that emerge from them. It is a tool that is effective when comparing different entities and their characteristics. One can think of a brand and how different products and sub-products can be linked to it in a spider map example. Find out more spider chart examples.
-
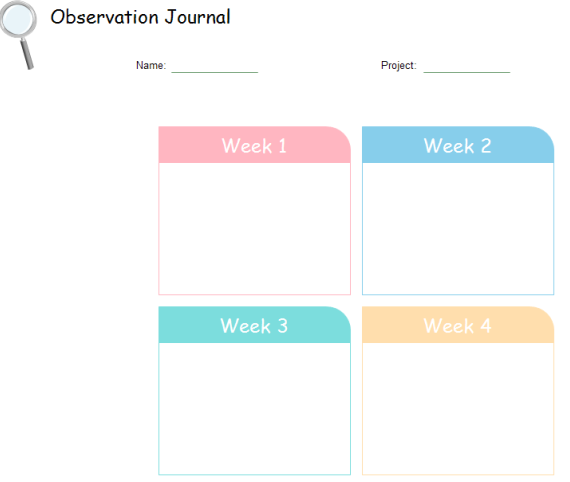
Observation Chart
This is a common visual tool that helps to plan out work for an investigation or how a creative assignment will be carried out for any instance of planning a scientific investigation.
-
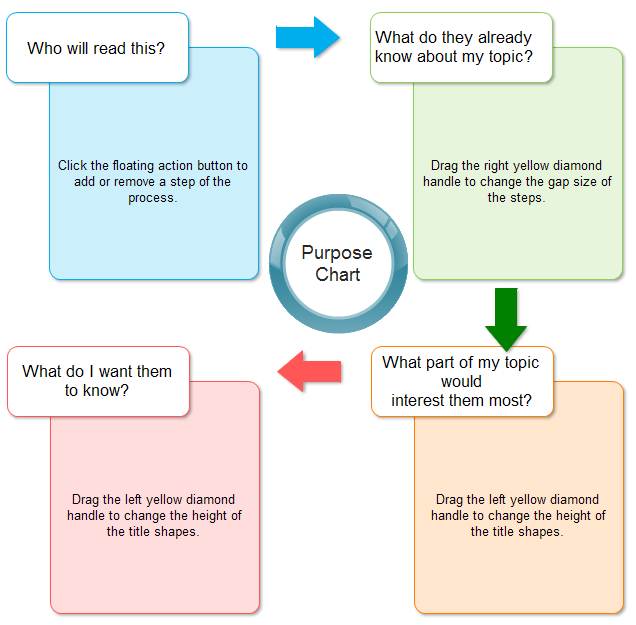
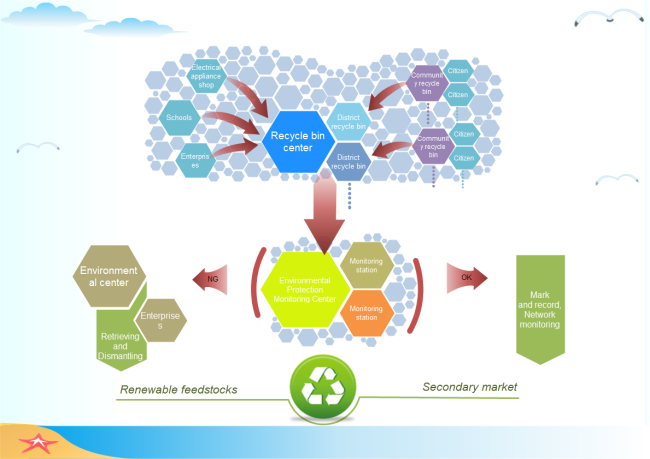
Problem Solution Chart
Such charts help students to focus on four main areas that are critical to solve a problem. It helps to isolate causes, list consequences or results and come up with solutions. For instance, if any community problem is being solved by a team coming together, listing out the major causes and proposed solutions with such a chart would help. Find out more problem and solution graphic organizer examples.
-
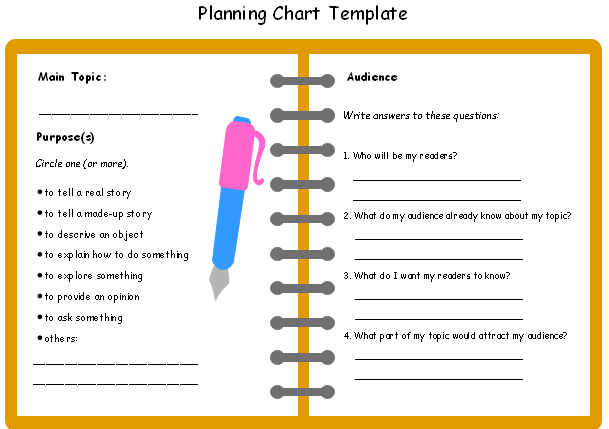
Planning Chart
In such a chart one can get started on planning a project. They can draw out a visual overview of a project, minimize risks and plan successful execution of the same for instance, how to tell a story. Find out more planning examples.
-
Four Column Chart
This is an effective tool that helps students to organize information and details about topics that they choose and help list out the main points of them. For any instance, listing out topics of a subject being read and highlighting main points in them.
-
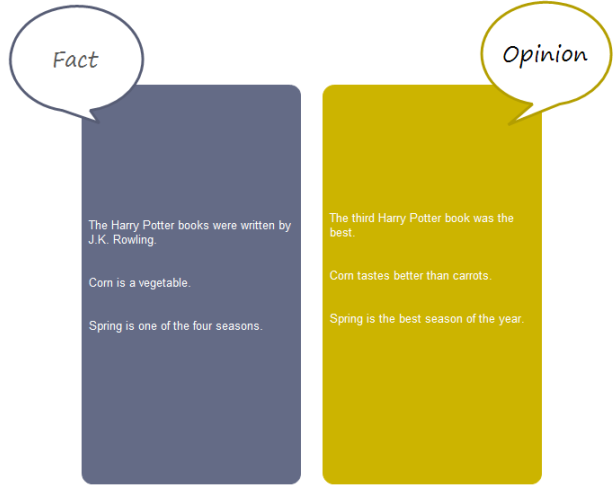
Fact-Opinion Chart
This is an illustrative tool that comes of use when determining what the facts are and what are the opinions in a certain text. Students can use this tool to determine facts and opinions in a work of nonfiction.
You can learn more about graphic orgnizer, there is a video about 12 Graphic Organizers You Should Know. If the video doesn't play, please visit it at YouTube.
4. How to Create An Eye-Catching Graphic Organizer?
There are easy ways to create an effective and visually appealing illustration or diagram, using any of the several tools mentioned above and more. Edraw Max is known to offer more than two hundred types of diagrams that can be used to create informative diagrams or illustrations.
The software suite that Edraw Max offers is a cross-compatible one that allows one to use it on mobile devices as well as on desktops. No matter which tool you choose, here are three simple steps to follow in order to create an appealing visual illustration.
-
Choose a Visualization Tool
This is the first step in creating a map in a diagram of your choice. The portfolio of offerings is a vast one, especially with Edraw, allowing one to make a choice as per the subject matter that one has in mind.
-
Adding Data
Once the kind of tool has been chosen, there are simple ways to input data. For instance, there would be data entry options on the sidebar. One can also choose to import data from spreadsheets that already exist in Google docs or in Excel.
-
Add in Creative Effects
The templates have several customization options. Hence, one can add on different colors, effects add or delete certain boxes or steps to complete the visual presentation of one’s data.
5. Conclusion
The above graphic organizer examples showcase the different ways one can showcase or illustrate steps, processes and other vital information. The tools are varied and it is easy to incorporate data in these different diagrammatic illustrations.
EdrawMax is the easiest diagramming tool, which enables you to creat any kind of graphic orgranizer diagrams by choosing eye-catching built-in templates and keeping customizing until you're satisfied.