How to Create an Area Chart in Excel
An area chart is a chart that uses the area under a line graph to represent data quantitatively. If you see an area chart, you’ll observe that the area below the line is filled with different colors. Each color represents a specific category. Area charts are often used for various purposes, e.g., you might also have used an area chart back in your physics class to determine distance from speed and time!
You can create an area chart in Excel easily. This article is a helping guide about how to create an area chart in Excel and EdrawMax. To learn how to create an area chart, follow the steps below.
How to Create an Area Chart in Excel
Let’s go ahead and learn how to create an area chart in Excel!
Step 1: Open Microsoft Excel and insert your data
Open Microsoft Excel on your computer. Insert your data in a table form. If you have a file for which you want to create an area chart, you’ll need to open the file in Excel first.
To open the file, click the File tab on the upper left corner of the Excel. Then, click the Open tab. From the dialogue box, go to the location where your file is placed, and select the file and select Open.
Step 2: Select the range
After you have inserted your data in the sheet, select the data range using the cursor for which you want to draw an Area chart. Select the range and click the Insert tab.
Step 3: Select your Area Chart
From the Insert menu, click the Area tab in the Chart section. Then, you will have the option of choosing a 2-D chart and a 3-D chart. You can select whichever you want.
Click the chart type you want to display, and the chart will show up. You can see an Area Chart for the selected range in the image below.
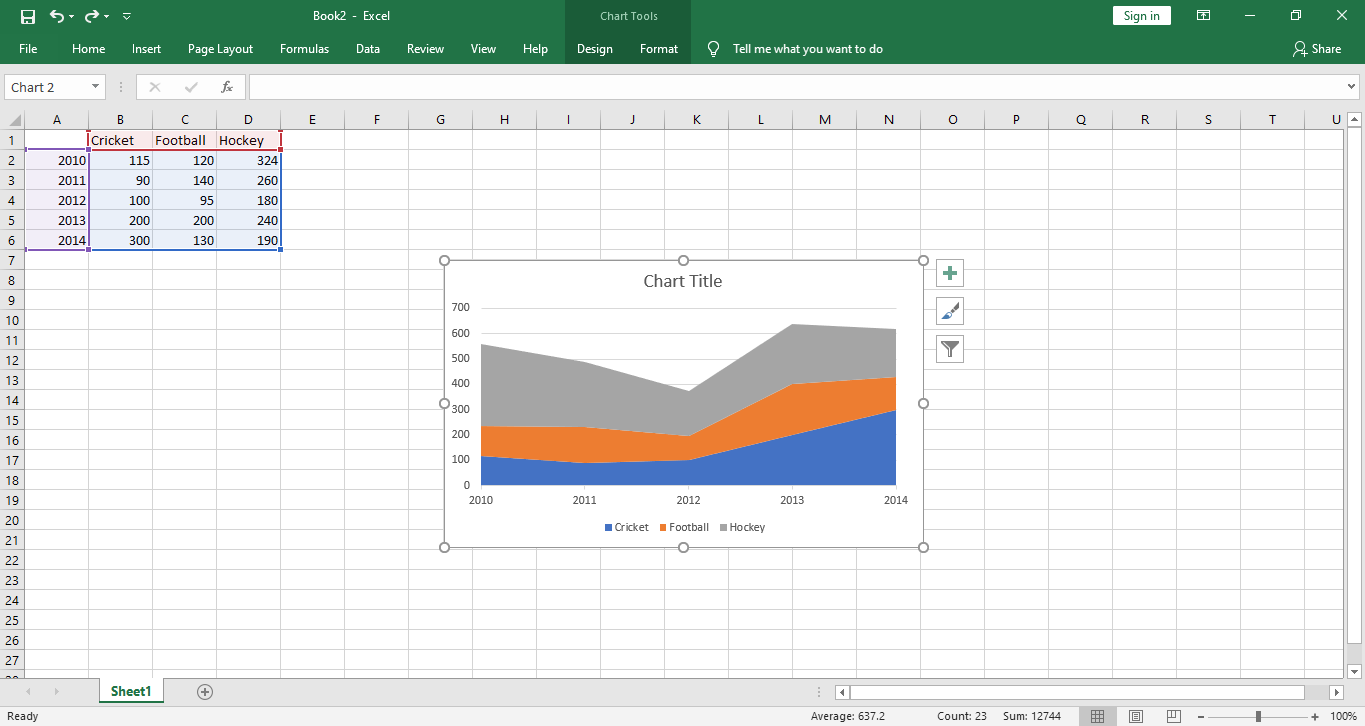
You can find different types of Area Charts in Excel. There are two primary types which are 2-D and 3-D and then you get further classifications like Stacked Area, 100% Stacked Area in both 2-D and 3-D formats.
How to Create an Area Chart in EdrawMax
Step 1: Log in
Log in to your EdrawMax account. EdrawMax is an online tool for graphics designing and can be used as an online Area Chart maker.
If you want to create an Area Chart and don’t have an account on EdrawMax, Sign up first.
Step 2: Go to Graphs and Charts
After you have Logged in to your account, find the New tab on the left column. Click the New tab and a menu will open. Select the Graphs and Charts tab. You can see the Graphs and Charts menu in the below picture.
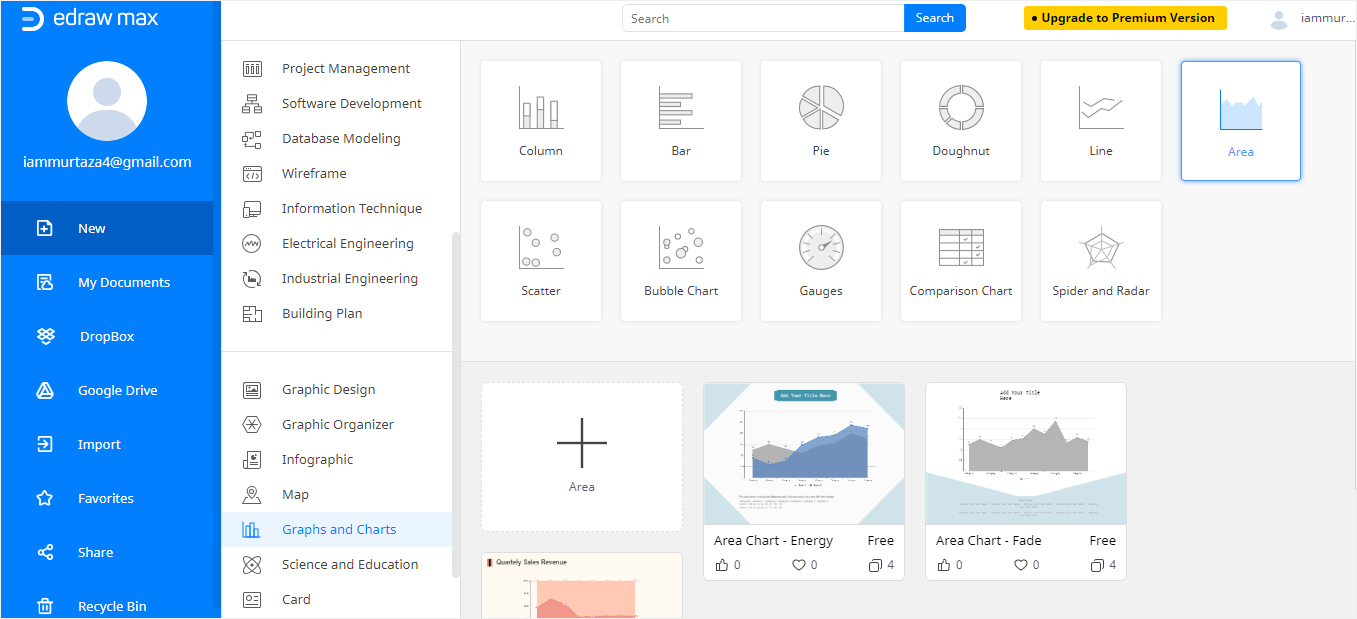
Step 3: Select Area Chart
Now, select the Area tab. Some Area chart templates will appear. If you don’t want to use a template, then you can click the large + sign to create an area chart from scratch. Thus, in EdrawMax, you can create an Area chart using a template or you can make an area chart from scratch.
You can see an Area Chart template in the EdrawMax online editor below.
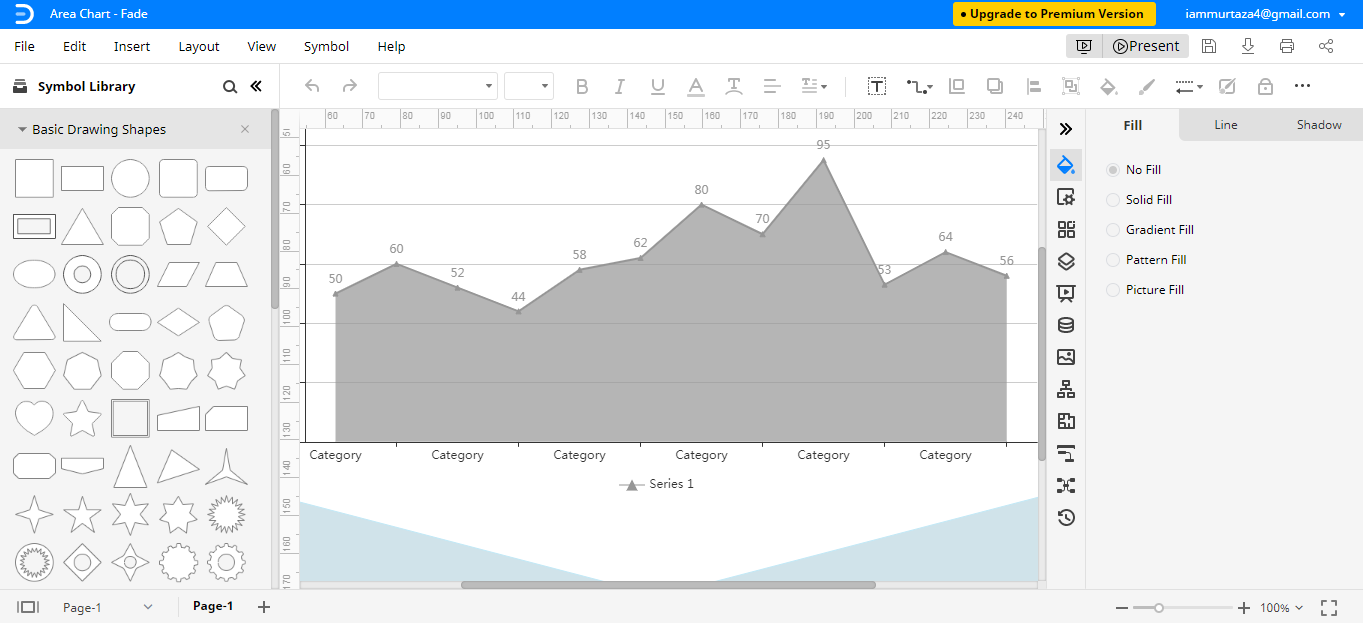
Step 4: Insert Data and Edit
Now that you have opened the template in the editor, you can edit the chart by inserting your data.
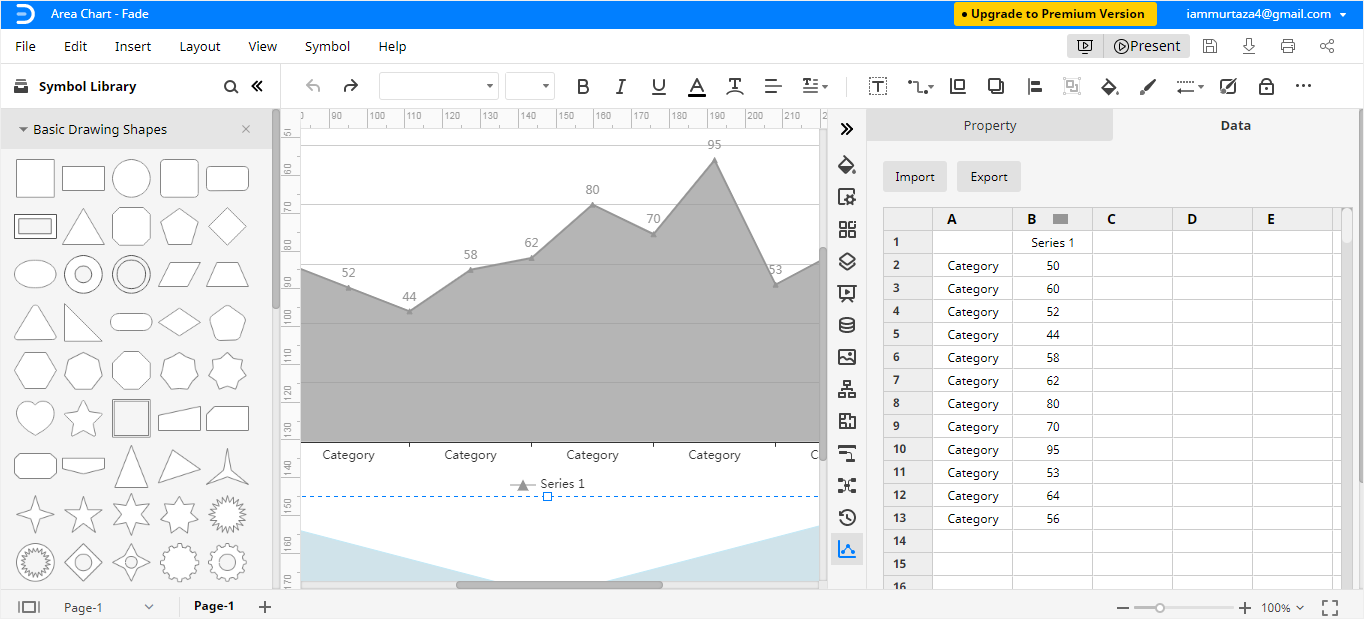
To insert the data for the Area Chart, click the Data tab on the right side of the graph in the editor window. A sheet will open after clicking the Data tab, and you can replace the data with your values. You can add new series and categories and replace the previous values with your new values. You can also import data from an Excel file by selecting the Import option. You can see the data entering the sheet below.
You can edit the area chart in any way you like. Change colors, add different sections and categories, add more data, and anything else that you like! With EdrawMax Online editor, you can virtually create any area chart that you want. There are multiple editing tools available on EdrawMax Online to help you edit your area chart.
How to Export an Edraw Chart as an Excel File
After you have created your Area Chart in EdrawMax, you can save it in different formats. If you want to save your Area Chart in Excel format, it is an easy process of two steps. Follow the below steps to save your Area chart in Excel format.
Step 1:
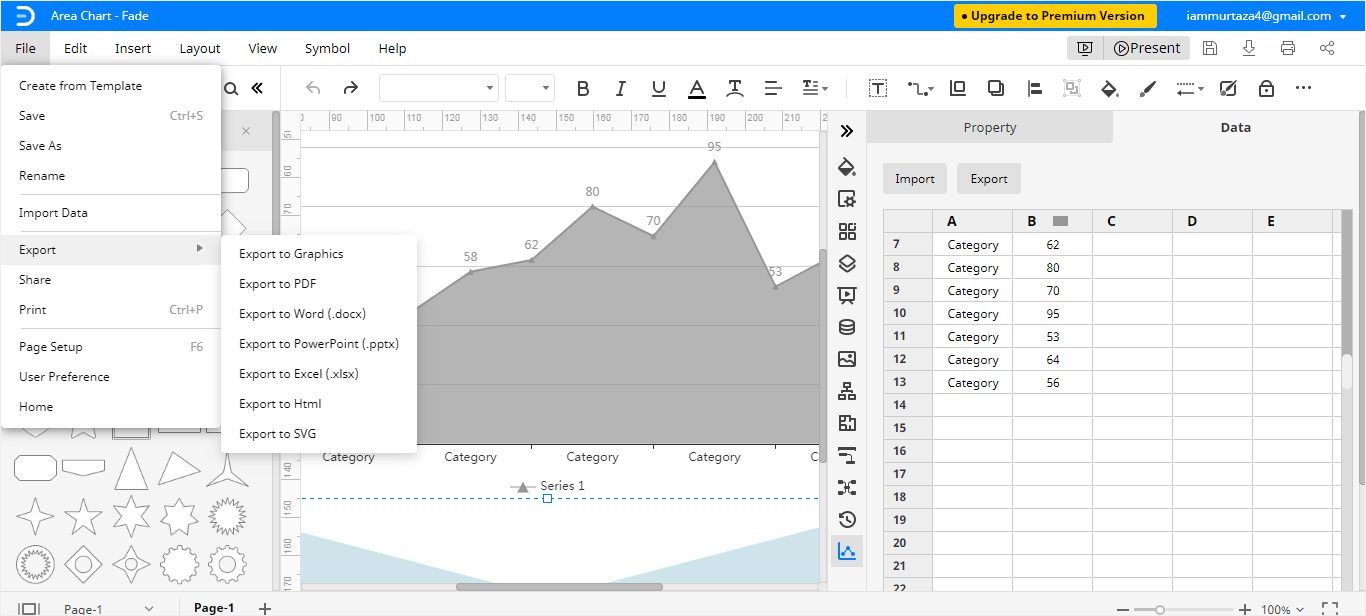
After you have created the Area chart, click on File in the top left corner, from the drop-down menu select Export.
Step 2:
From the Export menu, select Export to Excel (.xlsx) and your Area chart will be saved as an Excel file to your computer. You can save and export your Edraw files to Dropbox and Google drive as well. You can see the Excel format option in the below image.
So, what are you waiting for? Create an area chart in EdrawMax Online and make your life much more easier!


