How to Create a Data Flow Diagram in Visio?
1. How to Create a Data Flow Diagram in Visio?
A data flow diagram depicts the flow of information for any process or system. These diagrams range from basic level to multi-level depending upon the complexity of the process. Data flow diagrams are made up of rectangles, circles, arrows, text boxes to show data inputs, outputs, storage points, and the routes between each destination. Let's look into its main components.
1.1 The Components of Data Flow Diagrams
- External Entity: The external entity is a system located outside the flow that sends and receives the data; thus, we call it the "Source" and "Destination." The external entity could be a person, department, or an entire organization.
- Process: The process is any function that changes the raw data into finished output; labels are used to give the process its name. The process could be anything: a manufacturing process, service guide, computations, etc. depending on the nature of business.
- Data Stores: Datastores are places that hole the information, like files or documents. Datastores examples include the database table or membership form.
- Data Flow: Data flows are the routes that join the external entities, processes, and datastores. It illustrates the interface between the other components and is represented with arrows.
1.2 Data Flow Diagram Visio Tutorial
Now you are entirely educated with the main components of the data flow diagram from which the whole skeleton of the diagram is made, let's learn how to create it using Microsoft Visio.
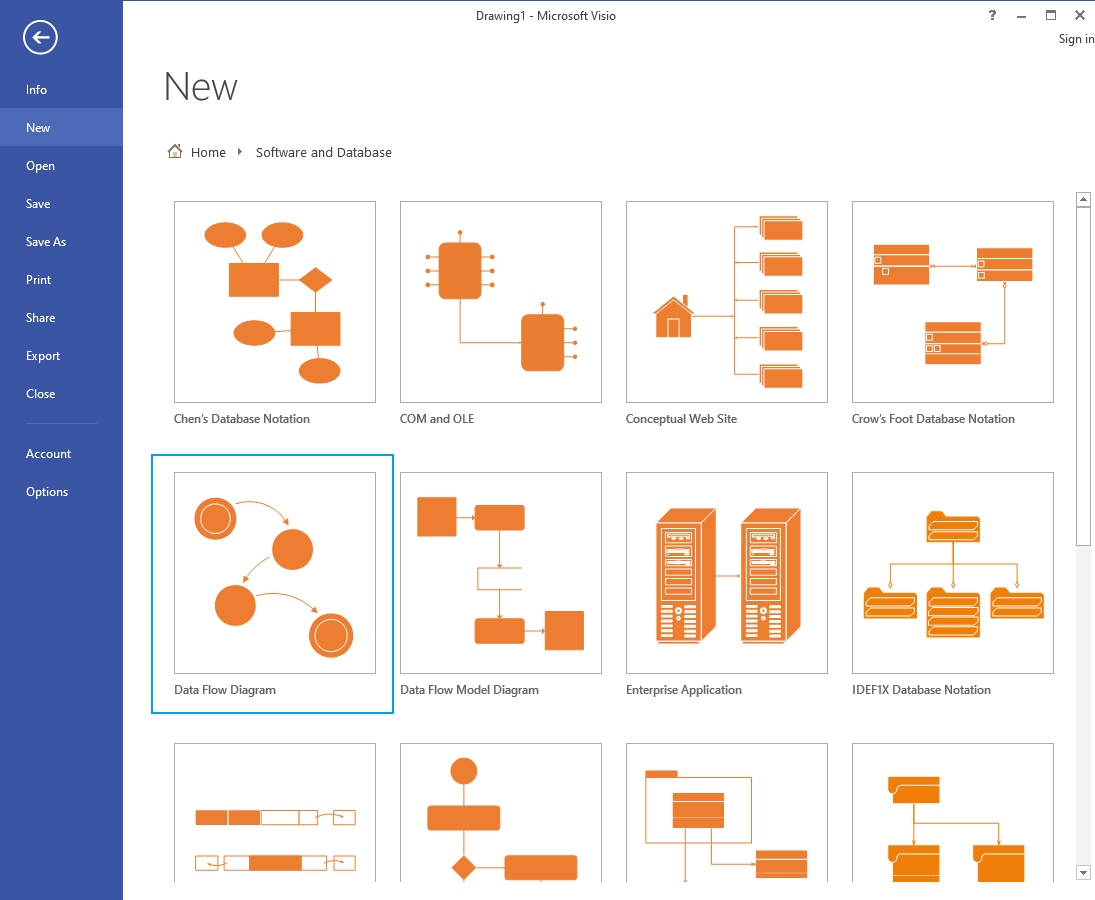
Step 1: Launch Visio
Launch the Microsoft Visio on your desktop to create a data flow diagram for a process. Then select File and click on New. From the categories, click on Software and Database. Click on Data Flow Diagram, and press "Create."
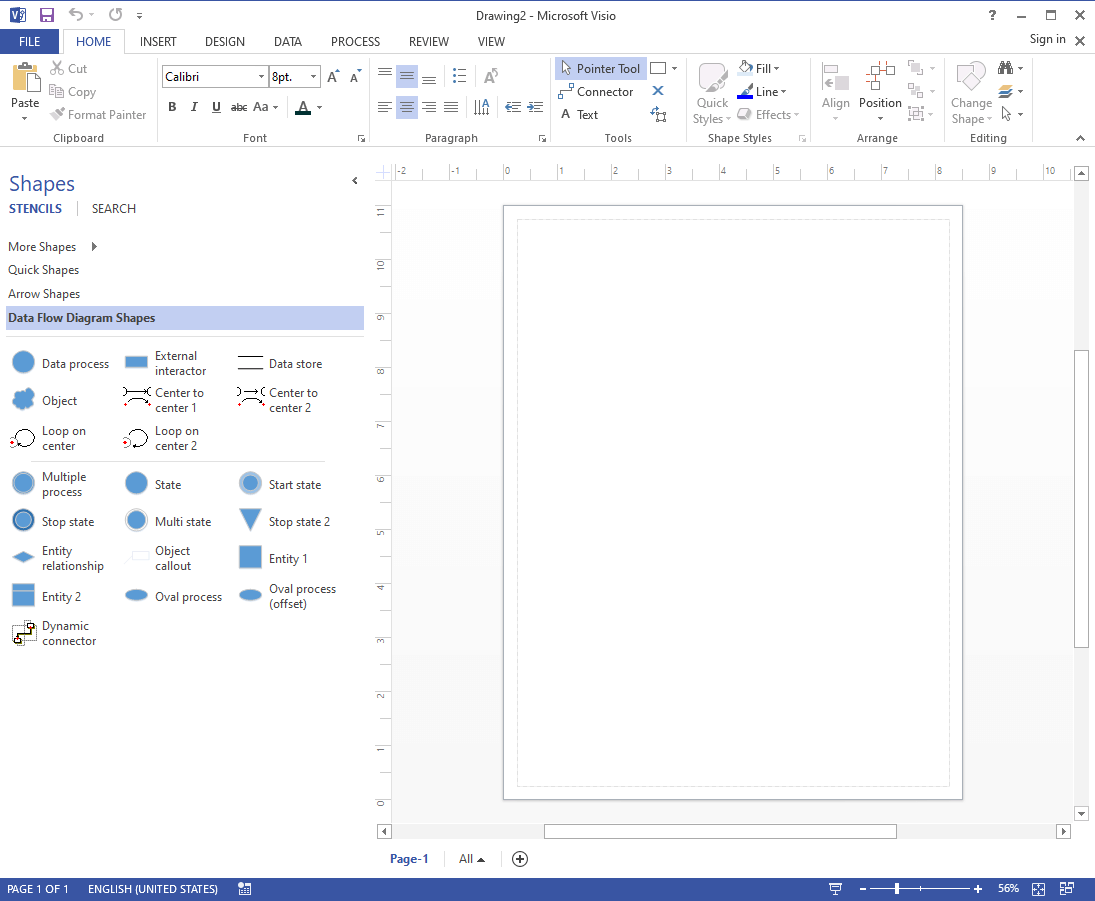
Step 2: Build with Shape Stencil
Drag the external interactor to the page of the diagram from the shape stencil. It will act as the source of information for the process. Drag some more shapes to represent the steps, stages, and entities involved in the process. Place an arrow into the drawing page using the connector tool. It should be close to the two shapes you wish to display data flow.
Step 3: Format the Diagram
To modify the direction of the arrow, pick it and then click Position on the Home tab in the Arrange group. Click Flip Horizontal or Flip Vertical after pointing to Rotate Shapes. Add more entities and connectors to illustrate the flow of the process entirely. There are more formatting tools available on the ribbon from which you can customize your diagram and give it an appealing look. Once your data flow diagram is completed, click on the File tab and then click on "save as" to store your data flow diagram.
2. How to Make a Data Flow Diagram Online Easier?
As you can see, creating a data flow diagram for a process in Microsoft Visio is so complicated and time-consuming; if you are a beginner, you must first learn the software and its tools, which can create a long hold up for your task. If you want to make an effective data flow diagram without any hurdles, then EdrawMax Online can resolve your problem. The application is a complete all-in-one diagramming tool.
Whether you need to create flowcharts, P&ID, UML diagrams, or design floor plans, office layouts, you can do all this in EdrawMax. EdrawMax provides solutions for more than 280 types of diagrams and charts. Let's learn how to create a data flow diagram in EdrawMax.
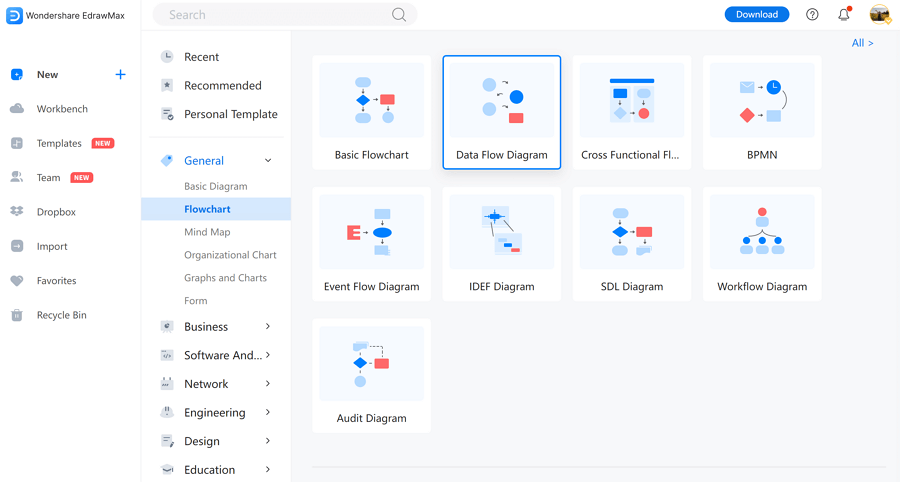
Step 1: Choose Data Flow Diagram Template
Browse the online application of EdrawMax and then log in to your registered email. Once the application is launched, Navigate to the "Flowchart" and then click on the Data Flow Diagram. From here, you can select to create a new data flow diagram or browse any template of your choice.
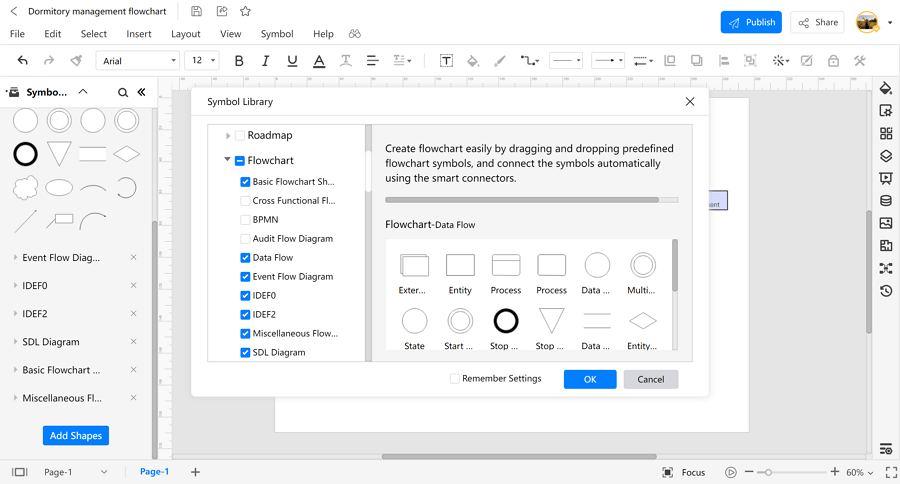
You can find and add the flowchart, data flow, and other symbols from the left libraries. All the pre-set symbols are free to use for Edraw users.
Step 2: Customize your Diagram
If you have chosen a pre-designed template, you can customize it as per the requirements of the process; alternatively, if you have started with a fresh template, draw, drag, and drop all kinds of entities and relationships from the sidebar. Add text to symbols that are significant to the process.
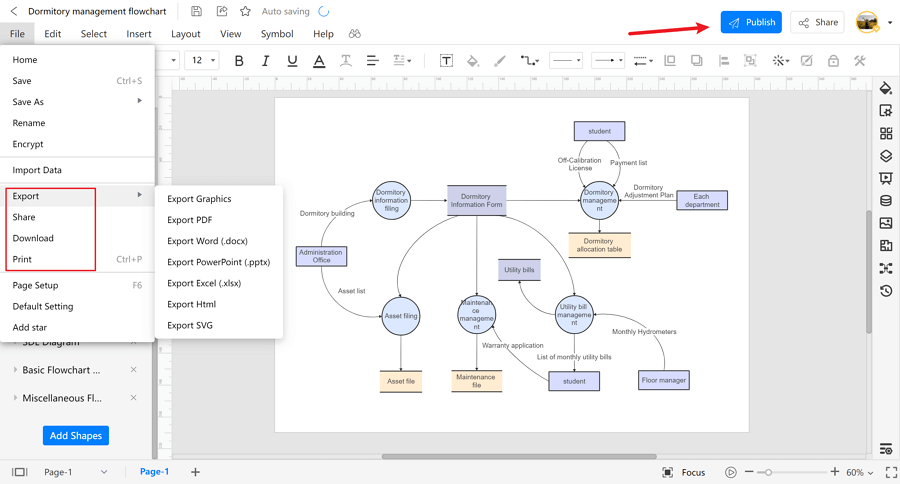
Step 3: Export a Document as a Visio File
Once your data flow diagram is completed, it's time to export it; you can export it to multiple formats, including PNG, PDF, VSDX, PPTX, and more. You can also export your data flow diagram to Visio files.
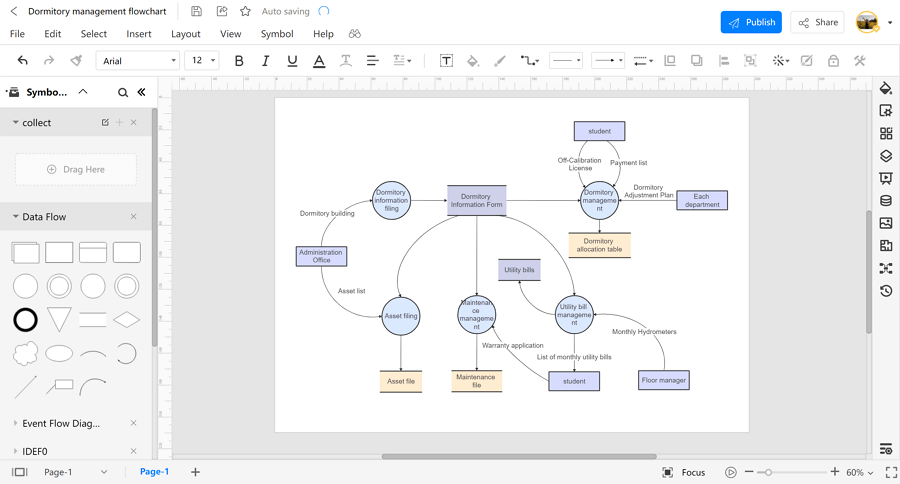
3. Data Flow Diagram Visio Examples
Some data flow diagram examples that you can edit or customize directly are below.
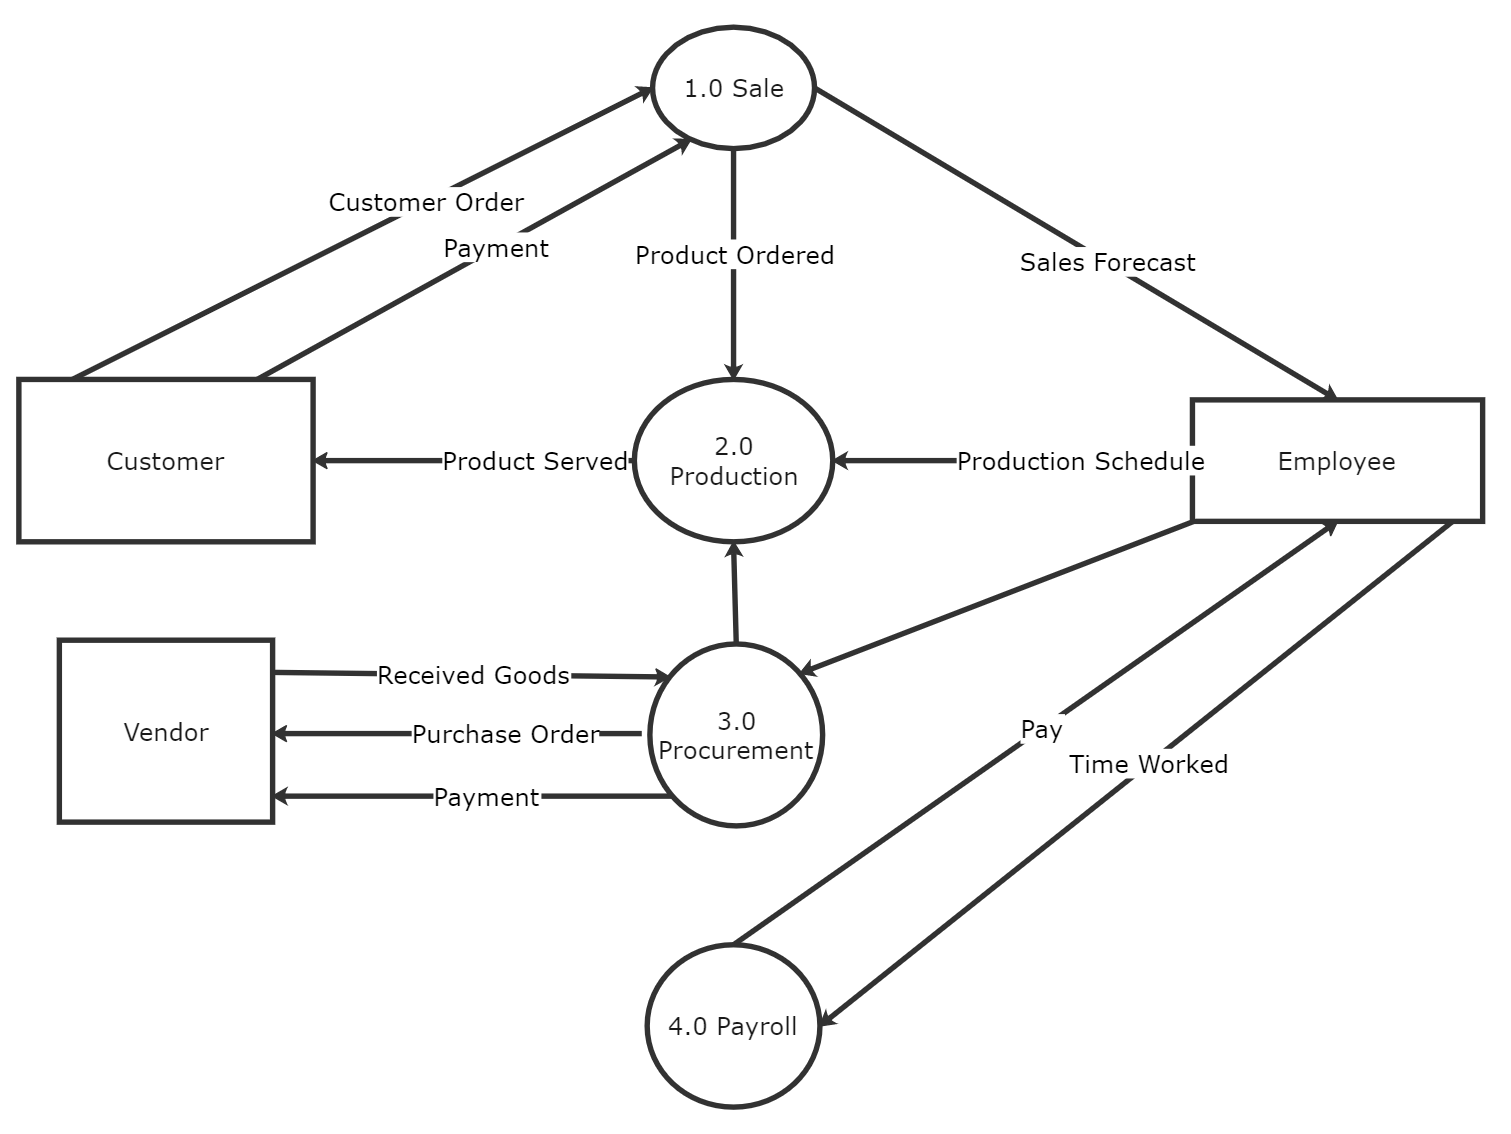
Example 1: Data Flow Diagram Level 0
Here is an example of a Level 0 Data flow diagram, also known as "Context Diagram." It's a high-level overview of the entire system or process studied or modeled. It's meant to be a quick peek into the system, displaying it as a single high-level process connecting to external entities. It emphasizes more on the external sources like here the procurement department is in connection with the Vendor, the production department is overseeing the customer for product services and with the employee regarding production schedule and lastly, the Sales department is in contact with its externalities; Customer regarding the order and payments and the employee regarding the sales forecast.
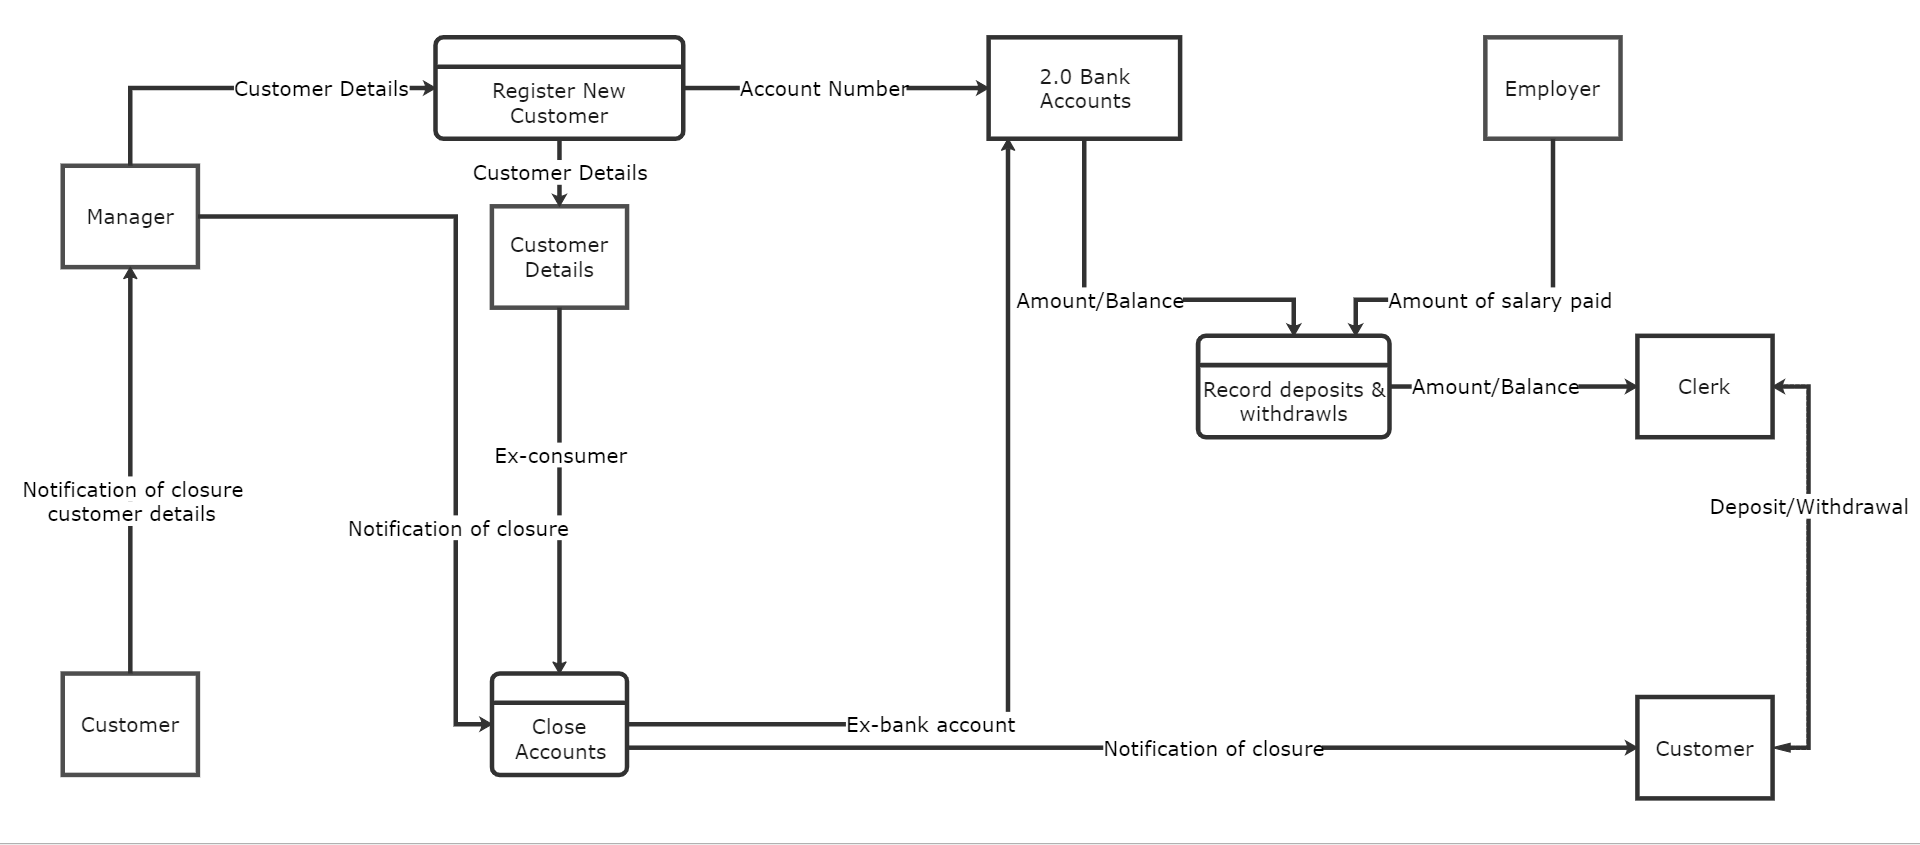
Example 2: Data Flow Diagram Level 1
In this data flow diagram of a bank, multiple departments of the bank are shown and how they are interlinked with each other providing different services to its customers. In this example, the single process node from the context diagram is divided into subprocesses in the Level 1 data flow diagram. Additional data flows and data stores will be required to add these processes to the chart.
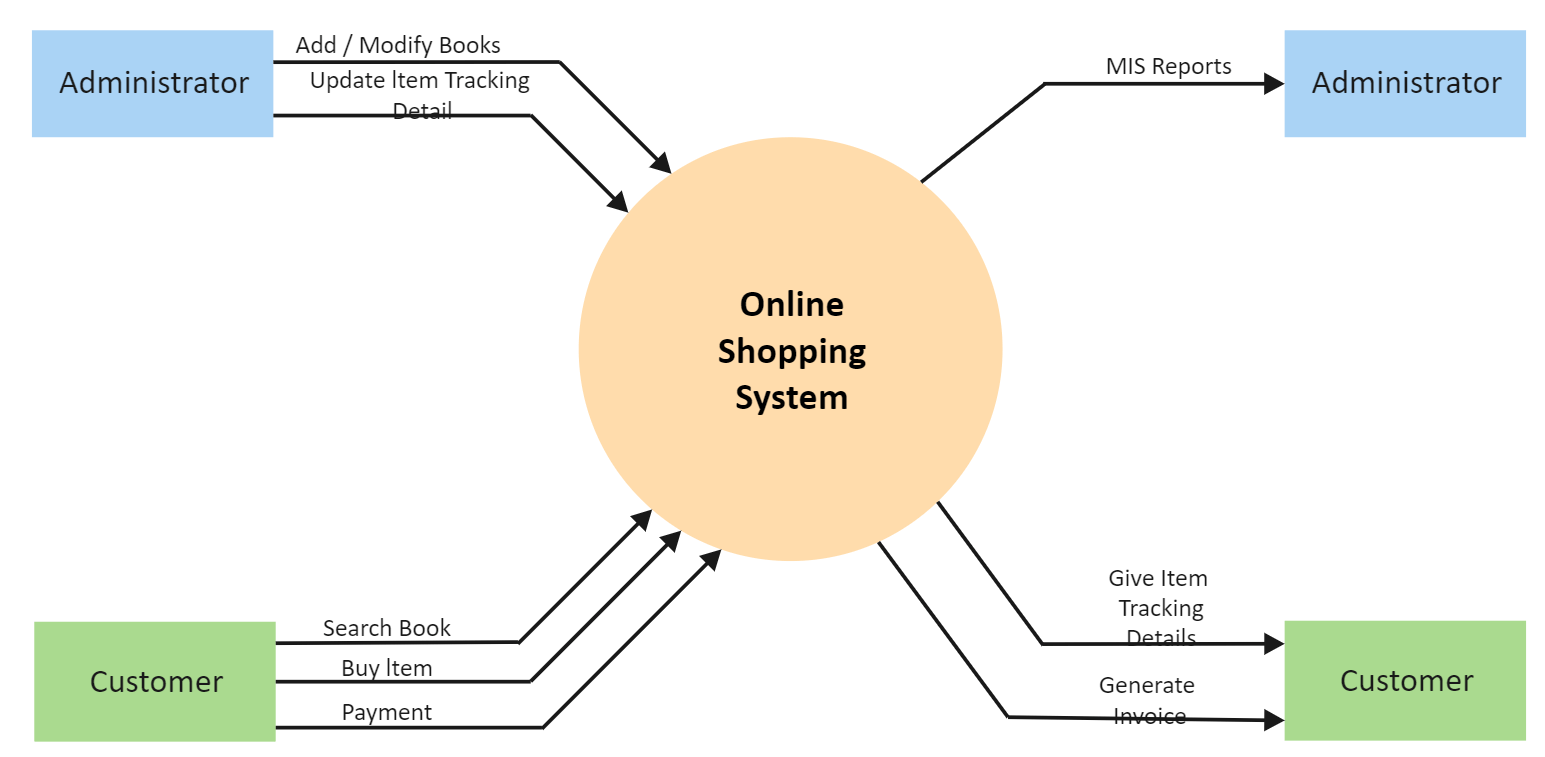
Example 3: Data Flow Diagram for Online Shopping
This example of an Online shopping system is also a Level 0 data flow diagram; the diagram depicts the flow of information between the system and its external entities or sources like here we have the Admin and the Customer. The admin updates the online shopping website, adds and modifies books, updates item tracking details, and communicates all the necessary information to the accounts team. The customer comes to the website to search for a book or to purchase any item, the system then gives item tracking detail to the customer, and after payment, it generates the invoice for the customer.
4. Online Data Flow Diagram Maker
EdrawMax Online is a user-friendly application that can meet your all diagramming needs; using EdrawMax, you can create more than 280 types of diagrams of different processes or systems. The software contains exciting and unique features and thousands of pre-designed templates to design a perfect data flow diagram for any process. The application is free, and users can access them on any browser, including Windows, Linux, or Mac.
The canvas in the online flowchart maker gives countless options of drawing lines, shapes, templates, and symbols for creating the essential decision points and other allied actions for converting the complicated process flow into an easily understandable and fascinating flowchart.
5. Key Takeaways
Data Flow Diagrams are a great technique to bring a process in black and white to assist all stakeholders involved. The data flow diagram structures the whole process and provides a way for team members to perform their tasks or jobs accordingly; the diagram follows the system's hierarchy and depicts how information flows between processes in a system. Using EdrawMax, you can design a perfect data flow diagram for a process as the application is user-friendly and no prior experience is required to use it.