How to Create a Stacked Bar Chart in Excel
1. How to Create a Stacked Bar Chart in Excel
The pictorial representation of a large amount of data in a systematic format is a stacked bar chart. It helps to study the subsections of the data sets that are in bulk. Each bar represents the entire data, and the segments in those bars signify the sub-sections.
Often users create a stacked bar chart in Excel. Follow this simple step-by-step guide to learn the process of creating a stacked bar chart using Excel sheets.
Step 1: Open Blank Sheet
Before creating a stacked bar chart, open the MS Excel application, and launch a new blank sheet.
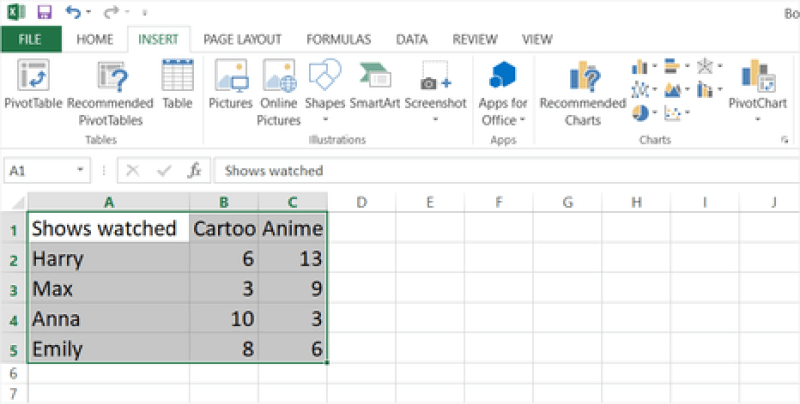
Step 2: Add Data to the Excel Sheet
Now, add data to the excel sheet or workbook. Just type your data, and make the excel for the chart.
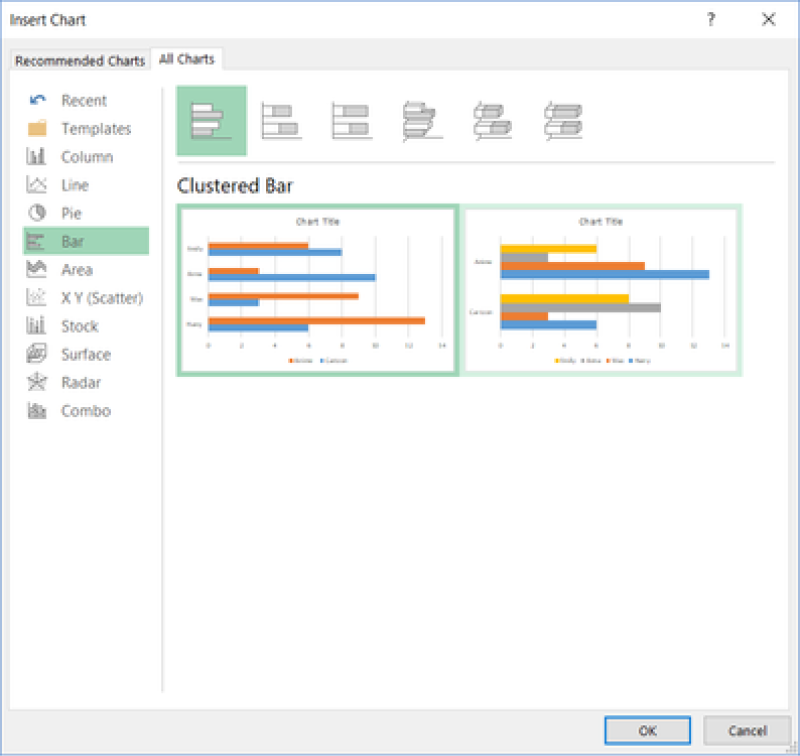
Step 3: Select the Chart Type
Now select the type of chart. For that, first, select the data, go to the Insert tab, find the bar chart icon present in the Charts section, and select.
Step 4: Insert your Stacked Bar Chart
After you have clicked the Insert Tab, select your stacked bar chart. Now you will see the chart on the Excel sheet.
Step 5: Customize your Stacked Bar Chart
In this step, you can customize the chart according to your requirements. For example, you can adjust the size by clicking and dragging the corners.
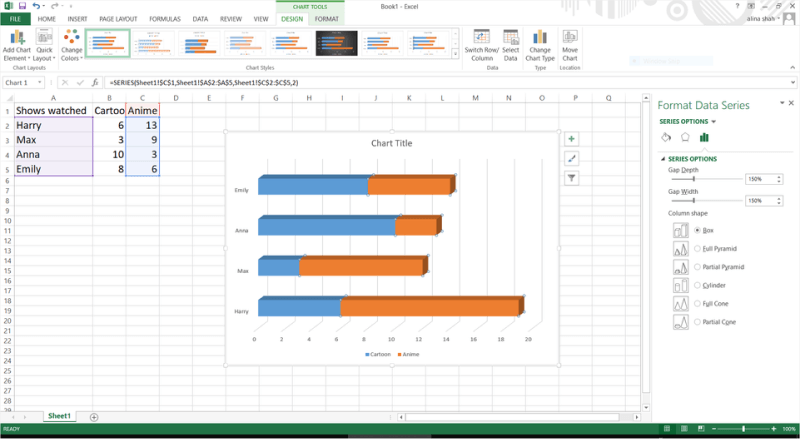
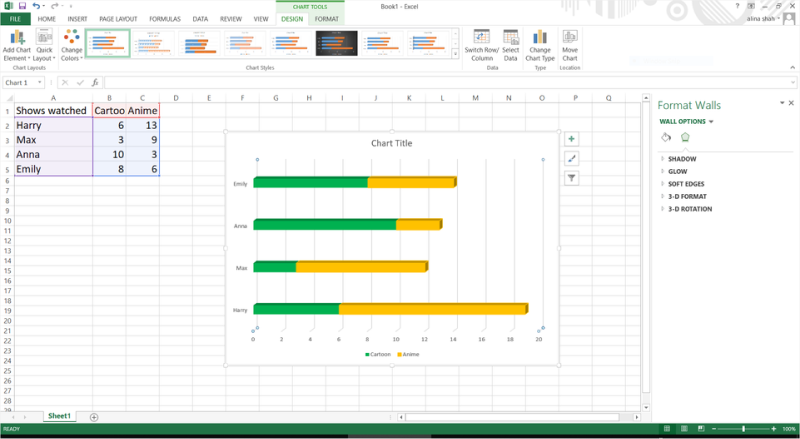
Step 6: Format and Edit the Stacked Bar Chart
Click on the stacked bar chart to format and edit the section. You will see a Format Data Series window popping up. Here you can adjust the bars according to shape, size, color, and more. You can also edit the font from the options in the Home tab.
Step 7: Save Your File
Click on the File tab, select the desired file location, provide the details and click on the save button to save the stacked bar chart.
You can represent a massive volume of data through stacked bar charts in an Excel sheet. The bar chart comes in various styles and formats; 2D, 3D, stacked bar charts, 100% stacked bar charts, and others.
1.1 The Advantages of Making Stacked Bar Chart in Excel
A stacked bar chart is commonly used to illustrate the comparisons between multiple categories of data visually. You can create a Stacked Bar Chart in Excel because there are some advantages of making a stacked bar chart in Excel, like:
- Excel lets you create 3D-looking Stacked Bar Charts.
- You can see data points more clearly when they are on top of each other.
- You can easily export the Stacked Bar Chart in PPTX format to directly present it using PowerPoint.
1.2 The Disadvantages of Making Stacked Bar Chart in Excel
MS Excel is commonly used for creating spreadsheets. So, there are certain disadvantages of creating a stacked bar chart in Excel, like:
- The primary disadvantage of creating a Stacked Bar Chart in Excel is that the reader cannot tell whether the values in the individual series are increasing or decreasing.
- If you created your Stacked Bar Chart in a particular Excel version, you might lose certain formatting features if you access the same file in a different Excel version.
- Not everyone is well-versed with Excel formatting and formulas.
1.3 Tips for Making Stacked Bar Chart in Excel
If you are planning to create a stacked bar chart in Excel, there are some important tips that you have to consider that will make your designing process a little simpler. For instance:
- Stacked Bar charts are helpful when you want to compare total and one part. So ensure that you update your table columns accordingly.
- Depending on your need, you can choose the 2D Stacked Bar or the 3D Stacked Bar option.
- Depending upon your primary need, you can fill the Stacked Bar Charts with multiple color options.
2. How to Make a Stacked Bar Charts Online Easier
There is a tool EdrawMax Online that shorten your time to create a stacked bar chart online. Also, it contains substantial stacked bar chart templates in product and template community that you can use immediately and create chart without efforts.
On EdrawMax Online, you can find thousands of readily available templates and design components to create all kinds of diagrams. The best part is that EdrawMax Online can also be accessed online, letting you work seamlessly on any platform. With simple drag and drop options, you can also create visually appealing stacked bar charts via EdrawMax Online in the following way:
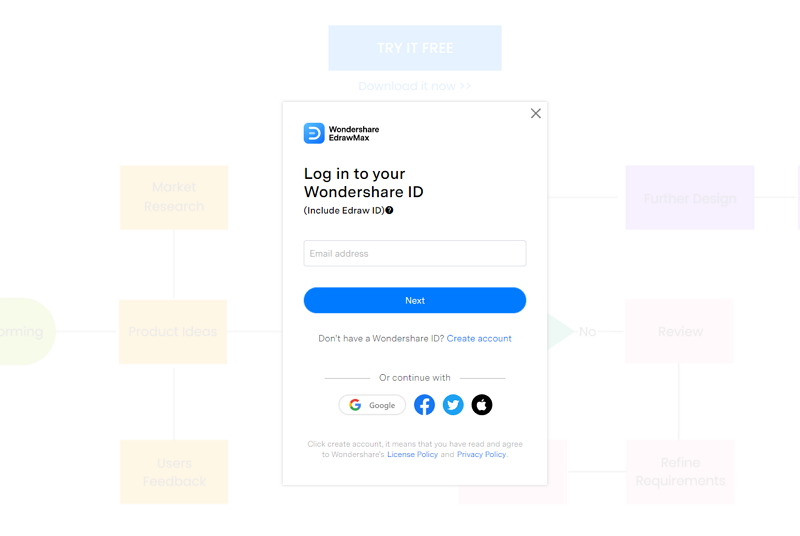
Step 1: Sign In EdrawMax Online
First of all, you need to log in to your EdrawMax Online account. If you haven't used EdrawMax Online before, you can sign up for a free account with your email address. Then you can use EdrawMax Online for free.
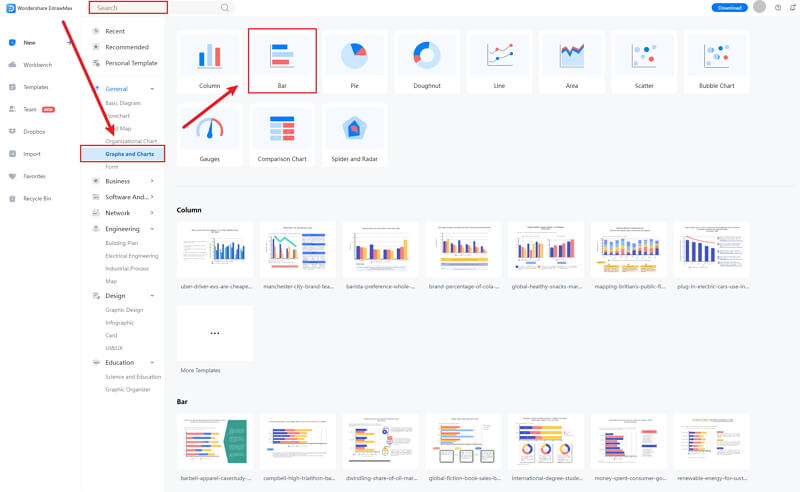
Step 2: Choose Bar Chart
After you log in to your account, find the General tab in the menu. Click the New tab, and the menu will open. From the New list, select the Graphs and Charts tab. When you click the Graphs and Charts tab, the panel will show up in the side window.
From the Graphs and Charts menu, select the Bar tab, and some bar chart templates and Create New tab (large + sign) will appear on the below panel. You can create a bar chart using a template or make a graph chart from scratch.
Step 3: Modify Your Chart
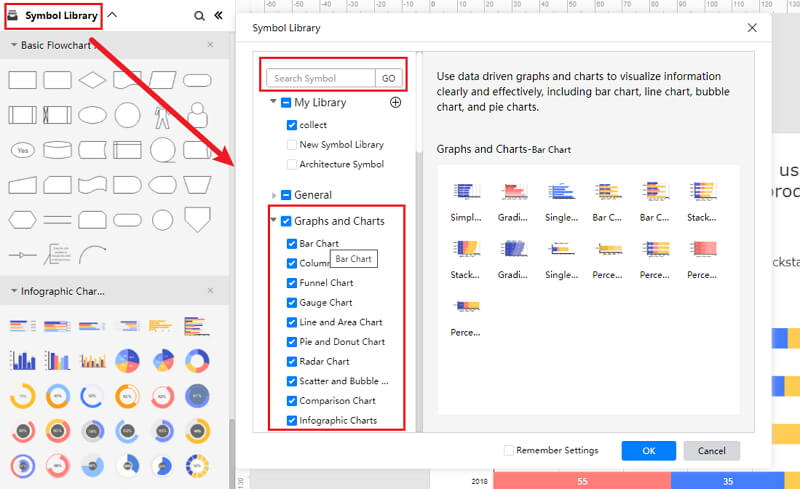
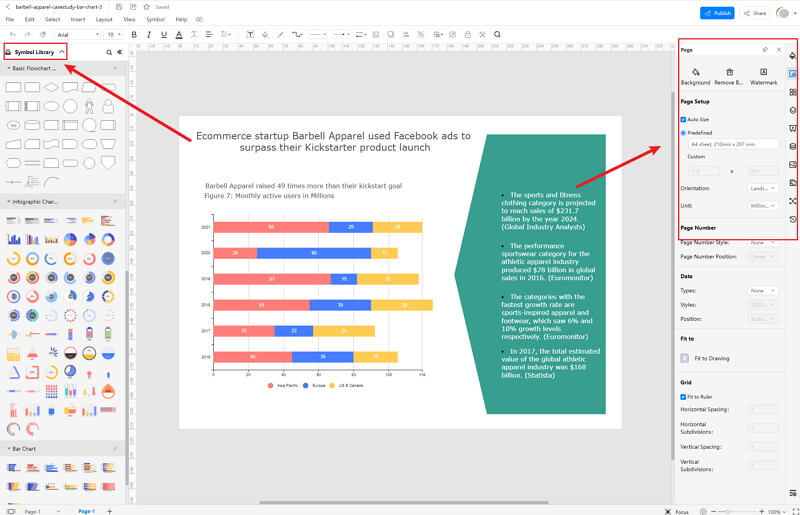
When you click the large + sign, the editor window will open. You need to find six sigma symbols from the Symbol Library.
Click the Symbol Library option on the top left side of the editor window. Next, a dialogue box will open. From the dialogue box, go to the Chart menu. A pop-up menu for bar chart symbol categories will appear. Then, mark the Bar Chart tab, click the OK button to import the bar graph in the editor window.
Or you can import the data from your end, and the bar chart will be made automatically.
Step 4: Add More Details to Complete Chart
Once the symbols are imported to the editor window, you can drag and drop the bar chart symbols in the editor to create your stacked bar chart using them. To edit the symbol, click in the boxes and enter your content. Likewise, you can make the boxes more attractive by using the Fill, Line, and Shadow options.
There are many editing options available in EdrawMax Online to make sure your stacked bar chart is customized according to your needs. You can change the transparency, change, type of fill, as well as add and remove layers.
If you want to change the graph type, go to the Attributes pane, and then click the Change Type option. To edit the series and categories of the data, go to the Data pane, and an editor window will open where you can input your data. You can add more series and categories as well as edit the different values against the series and categories.
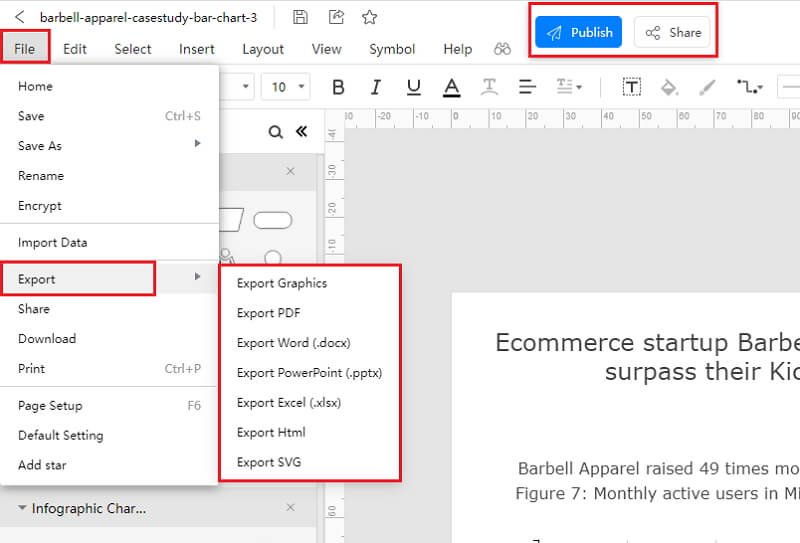
Step 5: Export Stacked Bar Chart as Excel
Click on File in the top left corner, from the drop-down menu select Export. From the Export menu, select Export to Excel (.exl), and your Edraw Stacked Bar Chart will be saved as a Excel file to your computer. Also, you can export as Graphic format, and attached the image in the Excel.
If you are still wondering how to make a bar chart in EdrawMax Online, you can check this stacked bar chart guide for reference.
2.1 The Advantages of Making Stacked Bar Chart in EdrawMax Online
Compared with Excel, there are many advantages that making a stacked bar chart in EdrawMax Online:
- EdrawMax Online supports to make a stacked bar chart online, and will be automatically saved, which means you could make charts in any where at any time.
- EdrawMax Online has a powerful Template Community, that you can find inspirations from thousands of templates made by Edraw users.
- EdrawMax Online supports to export and import multiple file formats, which ensures that you can make continue your work from other platform to EdrawMax Online, or you can export your stacked bar chart from EdrawMax Online, and attached to other files.
- Or even you can showoff your stacked bar chart with others by using Presentation Mode.
2.2 The Disadvantages of Making Stacked Bar Chart in EdrawMax Online
Even though there are some advantages of using EdrawMax Online as the tool to create your stacked bar chart, certain limitations affect the overall quality of the project. For instance:
- EdrawMax Online contains limited stacked bar chart related symbols, but you can create your symbols and save them for the use of next time. However, it is good for you to make your own bar graph symbols, you can create symbols from EdrawMax, or you can import the symbols you like and save into your symbol libraries for later use.
2.3 Tips for Making Stacked Bar Chart in EdrawMax Online
Creating a stacked bar chart in EdrawMax Online could be easier thing than making in PowerPoint, since there are resources and powerful export function.
- Choose a built-in template from Template Community to start quickly.
- Use powerful toolbars on the right and left sides of canvas to make your stacked bar chart more stunning.
- Export your stacked bar charts in mulitple formats to meet your needs, or share to your social media, email, and print it out.
3. Excel Stacked Bar Chart Templates
The followings are the stacked bar charts Excel templates, you can refer to them, or even use them immediately with ease.
Stacked Bar Chart Template
As you can see from the stacked bar chart template, such bar charts generally extend your typical bar chart on multiple verticals. As per the stacked bar chart template below, each bar is divided into several sub-bars stacked one above the other. It should be noted here that a Stacked Bar Chart is used to show how a larger category is divided into smaller categories and the relationship each part has on the total amount.
By creating a stacked bar chart, you also enable how you see the contribution from different categories to each bar or group of bars in the bar chart.
Source:EdrawMax Online
Excel Stacked Bar Chart
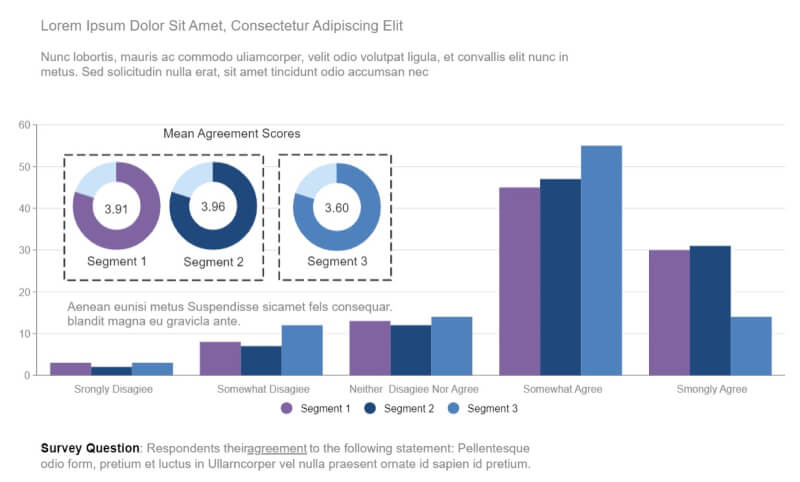
As the below image illustrates, a stacked bar chart, also known as a stacked bar graph, is a graph that is used to break down and compare different parts of a complete category. Each bar in the stacked chart represents a whole, and segments in the bar represent different entities or categories of that whole.
With EdrawMax Online, you can easily create such Stacked Bar Charts. The 2D tool offers free diagram elements, like templates, symbol creation, remote team collaboration, and more than ease your efforts in creating such charts.
Source:EdrawMax Online
Clustered Stacked Bar Chart
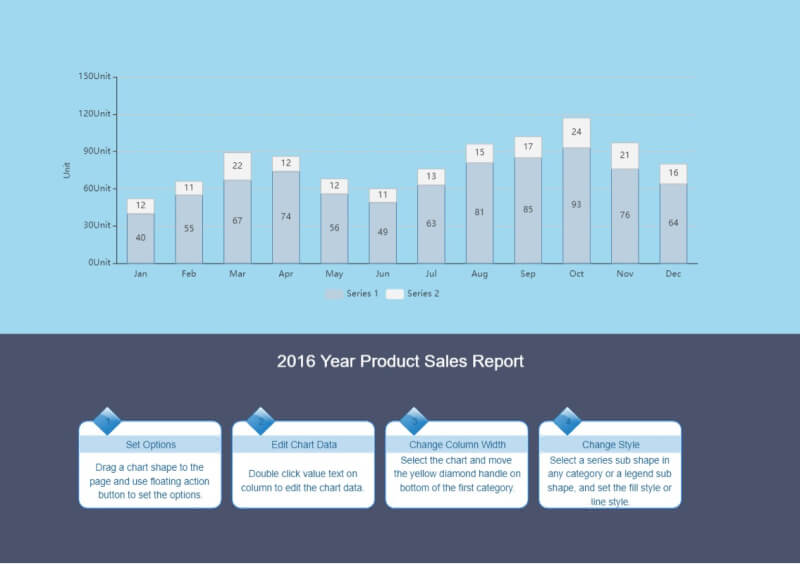
The following stacked bar chart template is a basic chart template that shows part-to-whole comparisons over a certain time or across multiple categories. As you can see here, this extends a normal bar chart at numeric values over one categorical variable. As represented in the Stacked Chart template below, data series are stacked on top of the other in vertical columns.
This chart also has a ledger of the series on the top, and at the bottom, there is a predefined place to add details about all three series in the template.
Source: EdrawMax Online
4. Free Online Stacked Bar Chart Maker
Once you start using EdrawMax for drawing purposes, you will realize that this 2D diagram maker is filled with hundreds of free templates. If you have to create a Stacked Bar Chart easily, all you have to do is check out the Graphs and Charts section at EdrawMax Online, and you will see that there are several pre-built templates readily available for you. In addition to this, you are not limited to the types of Bar Charts that you can make with EdrawMax Online. With this all-in-one tool, you can also easily create Horizontal Bar Graphs, Grouped Bar Graphs, Infographic Bar Chart templates, and more.
- There are thousands of design elements in EdrawMax Online that can help you create 280+ different types of diagrams.
- You can also browse its extensive range of templates in EdrawMax Online Template Communityand can readily customize them as per your requirements.
- EdrawMax Online is a free cross-platform tool that you can access on any browser and use without any prior designing experience.
- There are dedicated features to customize your diagrams and export them in numerous formats like PNG, PDF, TIFF, SVG, and more.
The Stacked Bar Chart designed in EdrawMax Online can later be exported to multiple formats, making the team collaboration extremely effortless and accessible.
5. Key Takeaways
You can create Stacked Bar Charts in Excel, but you will encounter several limitations in customization. One should not forget that MS Excel is primarily used for creating and sharing spreadsheets. Even though it has features of creating Bar Charts or Bar Graphs, the tool lacks several fundamental levels.
Unlike MS Excel, EdrawMax Online is solely created to create over 280 types of different diagrams. The process to create a Stacked Bar Chart in EdrawMax Online is superbly simple -- all you have to do is to either manually enter the data in the table or upload the CSV file from your system, the system will automatically generate the Stacked Bar for you. This generated Stacked Bar is 100% customizable, where you can change the colors, modify the fonts, change the background color, add your company's logo, update the text, and more.