How to Create a Spider Chart
1. Introduction
A spider chart, also known as a radar chart, is a graphical representation that depicts the various metrics and measurements of a variable by plotting them on different points on a circular, web-shaped plane. These charts are helpful when you need to show some data made up of multiple values and attributes. This guide will look at a few concepts surrounding spider charts, followed by a stepwise tutorial to learn how to create spider charts.
2. How to Create a Spider Chart
If you are familiar with diagramming, you can understand that spider charts are used in almost the same situations where line graphs are used. A line graph shows a single ray, fluctuating up and down to show the measurements of different values given along the x-axis. A spider chart does the same thing, except that the line goes around in a circle instead of straight. In other words, spider charts are typically used when a set of data consists of various attributes and qualities. The different values in the data set are marked on the circular plane. A line connects all the points so that it is easy to identify the grouping and categorization of the data. You can show multiple data sets on a single spider chart by giving each line a different color.
1. Assemble your data
Before starting on your chart, you should make a referable and readable compilation of your data. The best way to do this is to come up with a spreadsheet. This is so because, firstly, a spreadsheet presents the different variables and their included data neatly and cleanly. Secondly, when making a spider chart with EdrawMax, you can automatically import an existing spreadsheet to enter the data and avoid rigmarole's manual entry.
2. Create a key
After you have selected the type of graphic that is ideal for showing your data, note down the particulars and details in a text file or on a piece of paper, a written compilation of the data will be helpful if you want to double-check the values or refer to any aspect of the info during your work.
3. Boot up your software and get drawing
Once your data is assembled and the key is ready, open up your diagramming application and start working. This post will look at a step-by-step tutorial on making spider charts using EdrawMax Online.
If the video doesn't play, please visit it at YouTube.
3. How to Create a Spider Chart with EdrawMax Online
You can start as a free user by default and access the basic features. To sign up, click on EdrawMax Online, and select the 'Create Account' option.
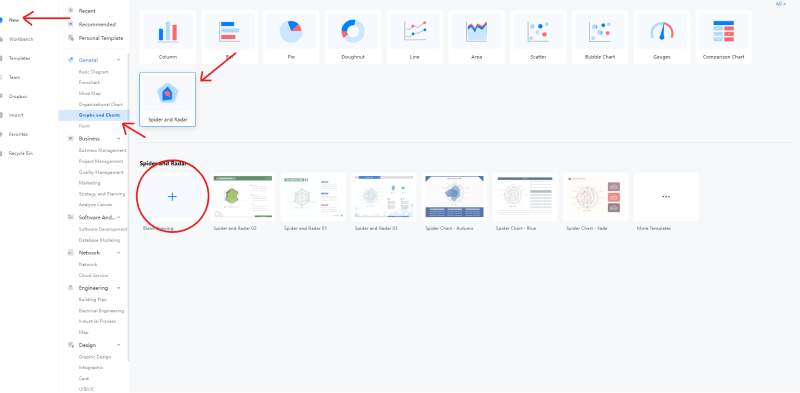
Once logged in, go back to the homepage and click on 'New' from the left menu. From the list of diagram types, go under 'General' and then click on 'Graphs and Charts.' Select 'Spider and Radar' from the list of categories that open up and click on 'Blank Drawing' to open the empty canvas. (New > General > Graphs and Charts > Spider and Radar > Blank Drawing).
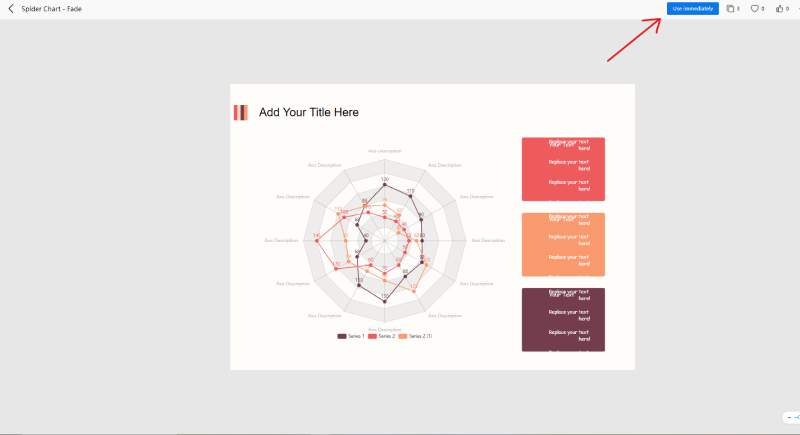
If you don't want to start your drawing from scratch, you can use a premade one from the template gallery and edit it as your own instead. Using a template, you don't have to go through the trouble of putting the labels and text fields yourself. You can change the present ones to suit your given information and data. Go to the homepage again, and from the left menu, click on 'Templates.' Once the gallery opens up, browse the list of categories and click on 'Graphs and Charts.' Select 'Spider and Radar.' This will bring up the templates uploaded by different users for this particular chart type. You will get a preview when you click on one (shown below). Press the 'Use Immediately' button to get it in your canvas.
When you want to add symbols and shapes (and in this case, charts) to your canvas, all you have to do is head over to the icons library on the left. Note that you don't get a lot of symbols in the library with charts by default. But you can always add them from other categories. Anyhow, click on the one you need to place on your canvas and then, while holding the button down, bring the cursor over to the desired position. This drag and drop gesture can also be used to move items around the drawing board after adding them.
The 'Themes' feature lets you modify the color palette, fonts, and connector styles used in your drawing. You can address all three of these aspects separately or choose a preset theme to modify them all at once.
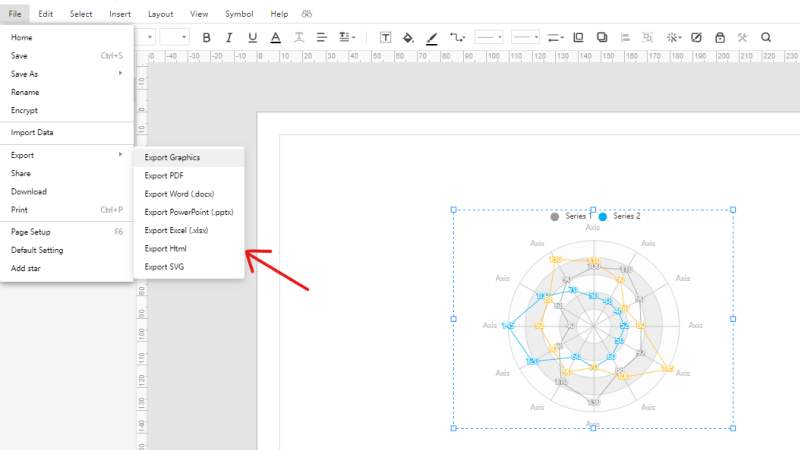
If you want to save your progress to the cloud, you can use the 'CTRL + S' shortcut. You can also go a long way and do the same thing from the 'File' tab at the top left. On the other hand, the 'Export' feature lets you save your work as an offline file. You can select from popular formats such as PDF, SVG, .docx and .pptx.
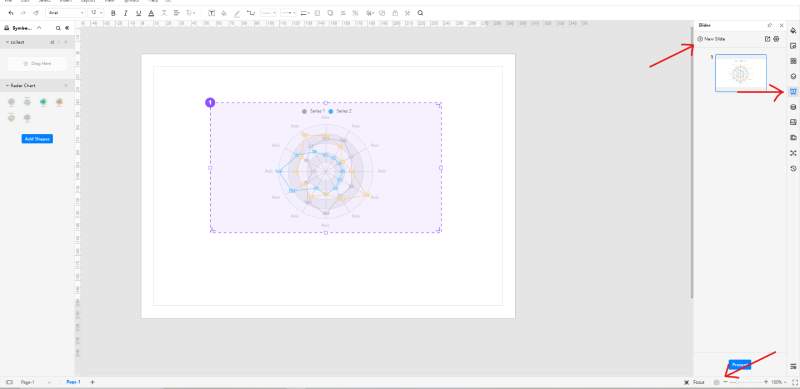
With EdrawMax Online, you create slides from your drawing without using another application. Click on the 'Slide' menu from the right menu bar and select 'New Slide.' This will bring a purple box to your drawing board. You can change the size and position of this box. Whatever part of the canvas you include in this selection will be made into the slide. Alternatively, if you lack the time for doing this, you can click on the play icon on the bottom right to start a slideshow.
4. Expert Tips for Making Spider Chart
Use a template if you're a beginner
It doesn't sound like an expert tip, but trust me, if you are a newbie, go for a template instead of starting from scratch. If you pick a template created by a seasoned veteran, you will see how the chart is placed and sized on the canvas. You will learn where the text fields must be arranged and how the legend must be presented. Using a template is not only for the sake of saving time and effort; rather, it is a complete learning experience.
Don't include more than five variables
A spider chart is good for only a limited number of value sets. If you, for example, put ten or twelve different lines in a single graphic, it's not going to be very easy to read. You can use a line graph for those types of situations.
Import icons to decorate your work
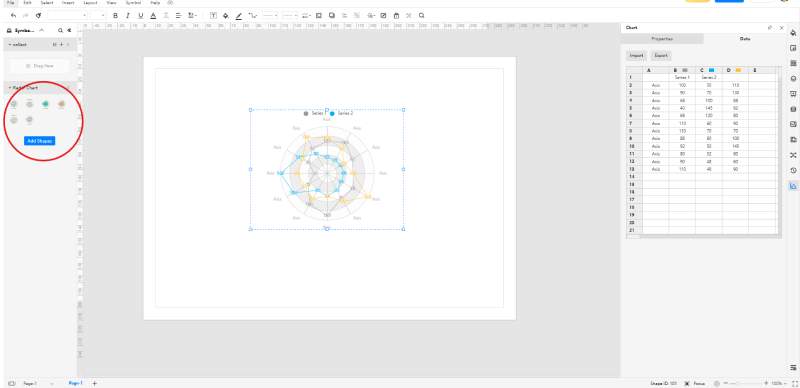
This one doesn't get old. At the symbols library, you will see a button marked 'Add Shapes.' Click on it, and a window will pop up where you can choose the symbol collections from any other category on EdrawMax. If you are making a spider chart about some IT stuff, import some icons from the 'Network' category and place a few PC symbols artistically in your drawing. You get the idea.
5. Key Takeaways
Coming up with a spider chart is a piece of cake if you know your way around EdrawMax Online. The web-based software comes with a host of different features that allow users to draw diagrams in a matter of minutes. If you are a rookie in diagramming, follow the above guide, and you'll learn how to create a spider map easily. Find more spider chart examples.