How to Make a Gantt Chart in Microsoft Project
Microsoft Project can help users auto create a Gantt chart out of the data of the project. In this article, I will show you how to make a Gantt chart in Microsoft Project. Gantt charts allow you to view project processes, manage resources, and even estimate costs.
How to Make a Gantt Chart in Microsoft Project
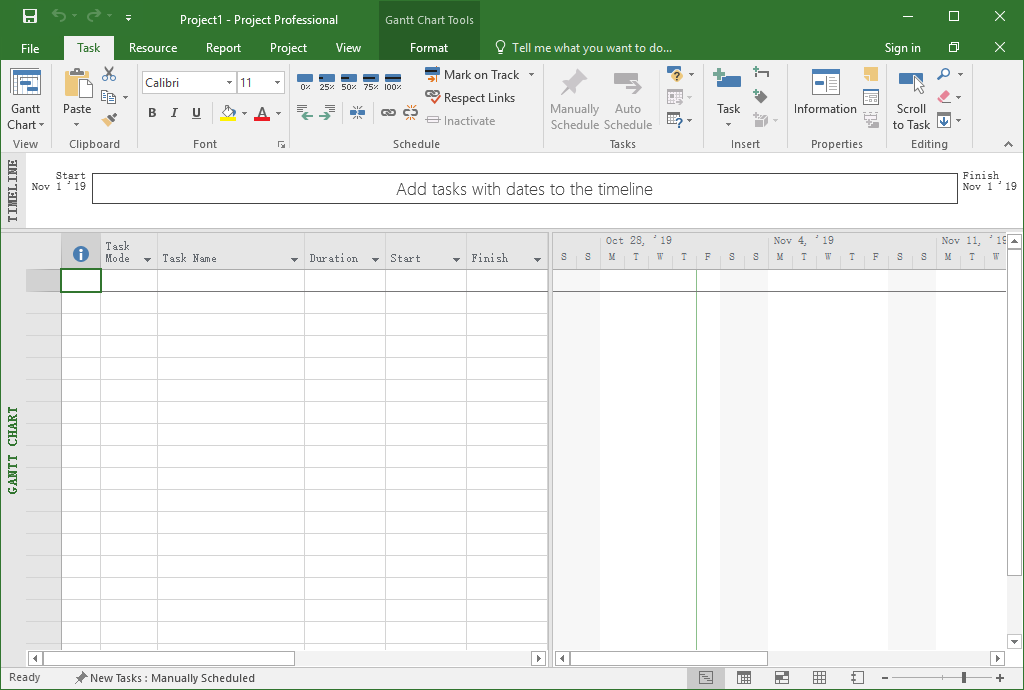
Step 1: Open Your Project File
Enable Microsoft Project and open your project file (.mpp). As you can see, the interface consists of 2 separate panes. The left pane is a worksheet in which you enter the data of task names, duration days, start dates, finish dates, predecessors, and resources names. The right pane is the Gantt Chart, which shows the timeline of the project.
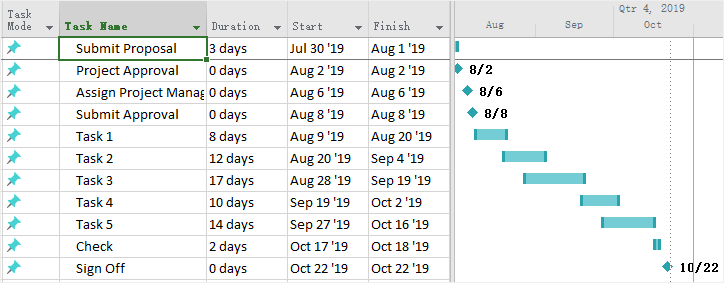
Step 2: Enter the Project Data
Enter the data of your project on the left pane and the software will automatically create a Gantt chart on the right pane. In this example, I just input the task names, duration days, start dates, and finish dates.
Step 3: Add Gantt Chart Wizard on the Ribbon
To add the Gantt Chart Wizard on the ribbon, you need to:
- Click on File > Options to open the Project Option dialog box;
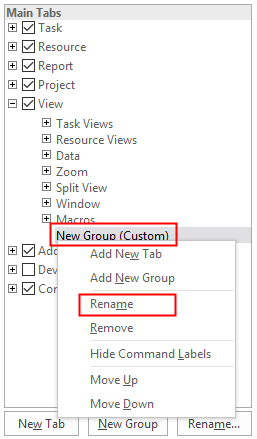
- Click on Customize Ribbon;
- In the right column under Main Tabs, right-click on the tab where the Wizard will be inserted and choose Add New Group in the context menu;
- The newly-added group will be listed as New Group (Custom), right-click on it and rename it. Here I called it as Wizard.
- In the left column of the pane, select Commands Not in the Ribbon under Choose commands from. After that, you need to find Gantt Chart Wizard on the scroll list and click Add button between the columns.
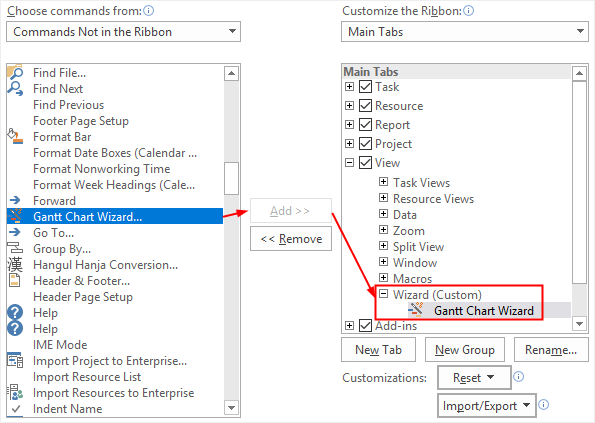
Note: Before you add Gantt Chart Wizard to the Main Tabs, you have to make sure that you select Wizard (Custom). Otherwise, it will be added on another tab.
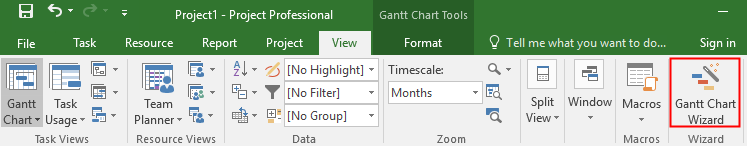
- Click OK on the dialog box. Here is the Gantt Chart Wizard button on the View tab.
Step 4: Customize the Gantt Chart
After you add the Gantt Chart Wizard on the ribbon, you can use it to format your Gantt bars.
The first step is to decide what kind of information will be displayed on the chart.
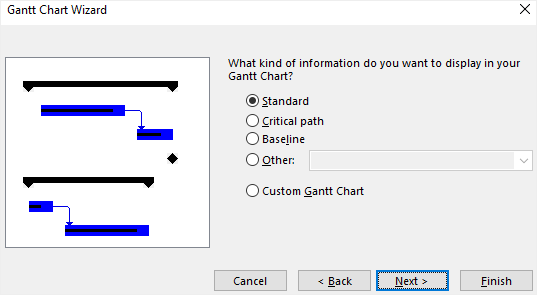
The second step is to decide what task information will be displayed on the Gantt bars.
The third step is to decide whether to show the links between dependent tasks or not.
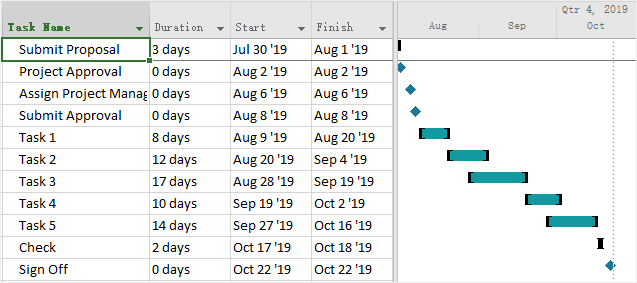
Here is what the Gantt chart looks like now:
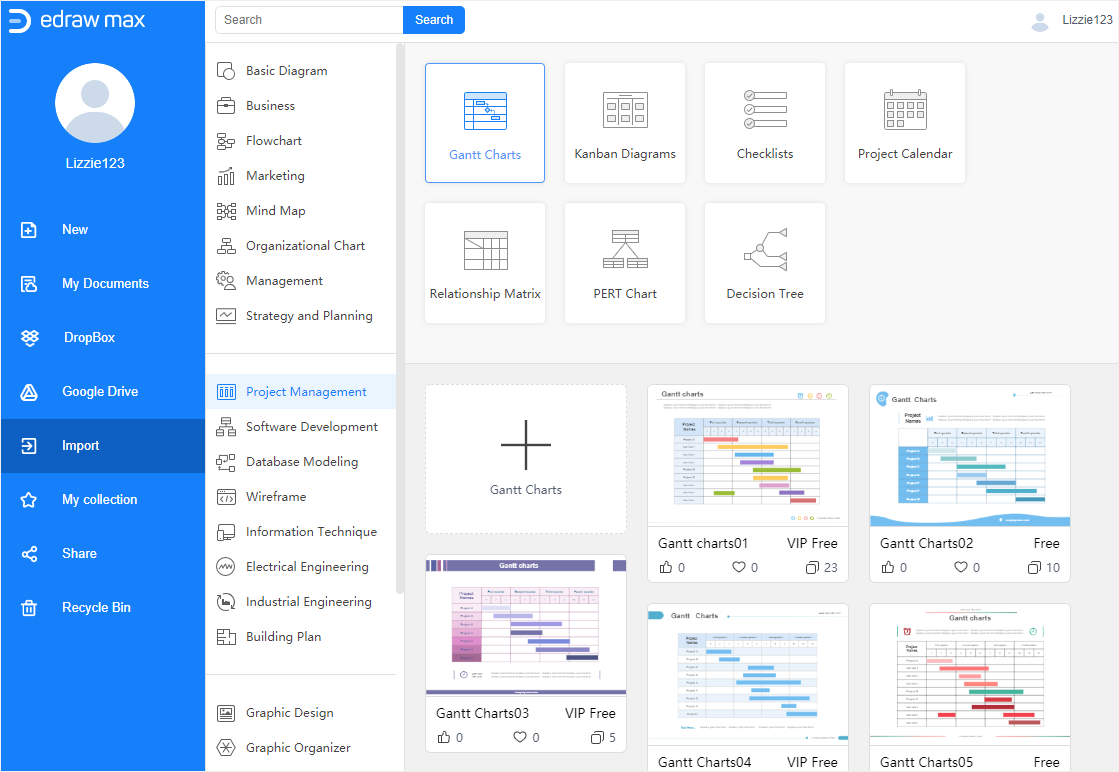
How to Make a Gantt Chart in EdrawMax
Step 1: Select Gantt Chart Template
Enable EdrawMax, select Gantt Chart under the category of “Project Management”, then you will see some common Gantt Chart templates. You can choose one of the templates to make your own Gantt chart or start from scratch.
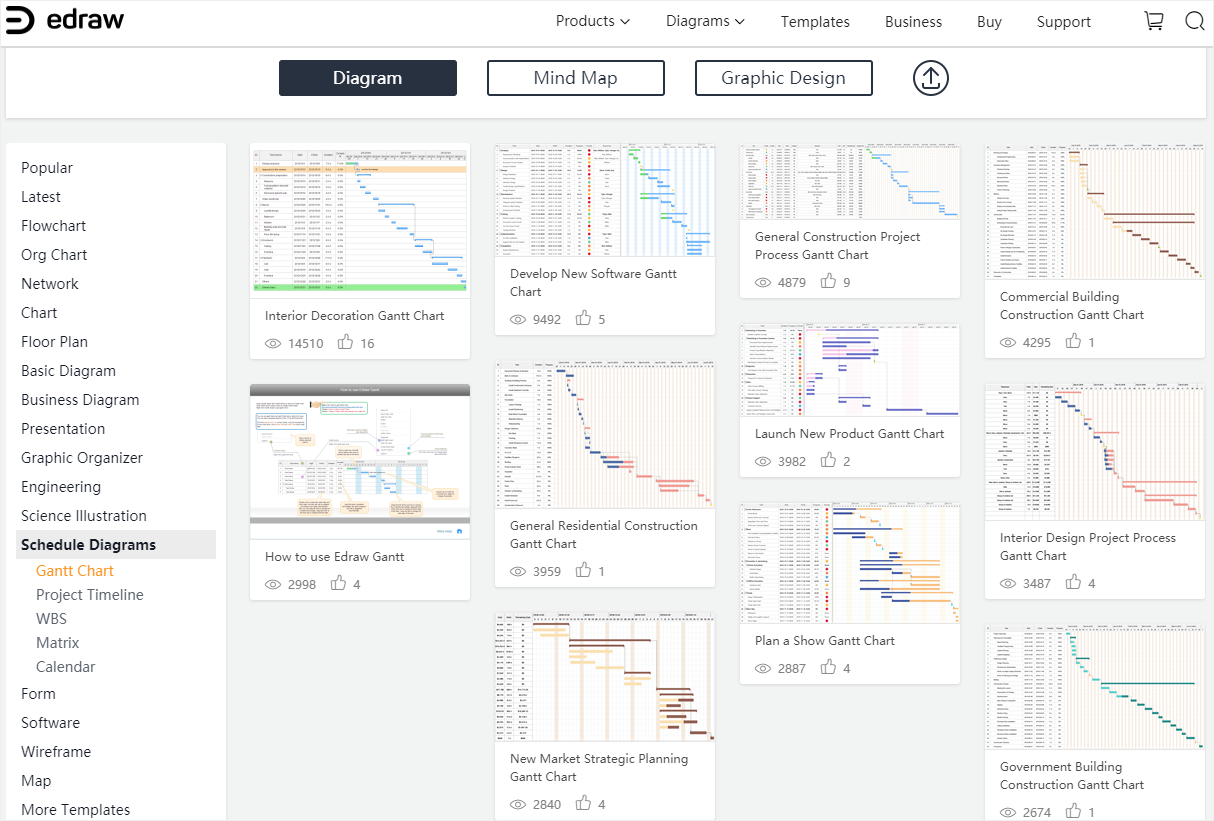
If you want to see more free Gantt chart templates, you can visit Edraw Template and find suitable templates.
Step 2: Make Your Own Gantt Chart
Click on the plus icon on the Home page to open the main interface and start to create a Gantt chart on the blank drawing page.
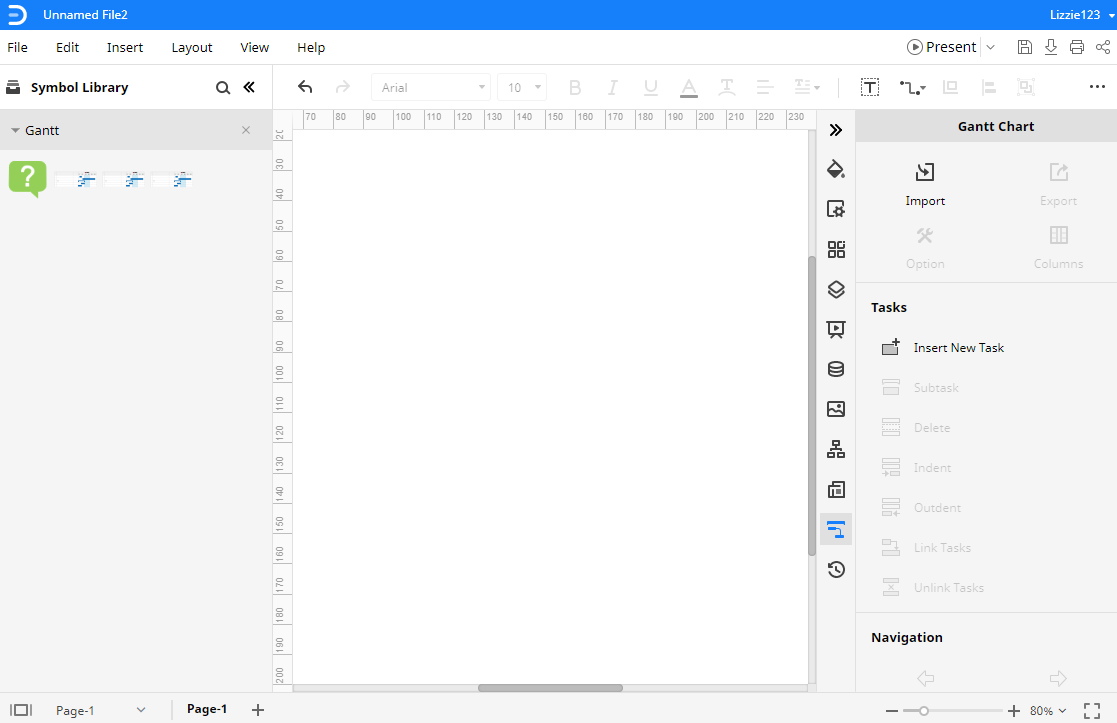
EdrawMax allows users to import the project data in the formats of XLSX and CSV. Click on the Gantt Chart icon to open the Gantt Chart pane. Then click the Import button, seek the data file on the dialog box and click Open.
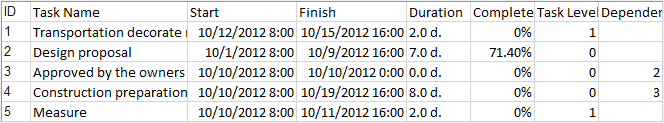
Note: the data of the project is suggested to be sorted out in the same way as the below picture.
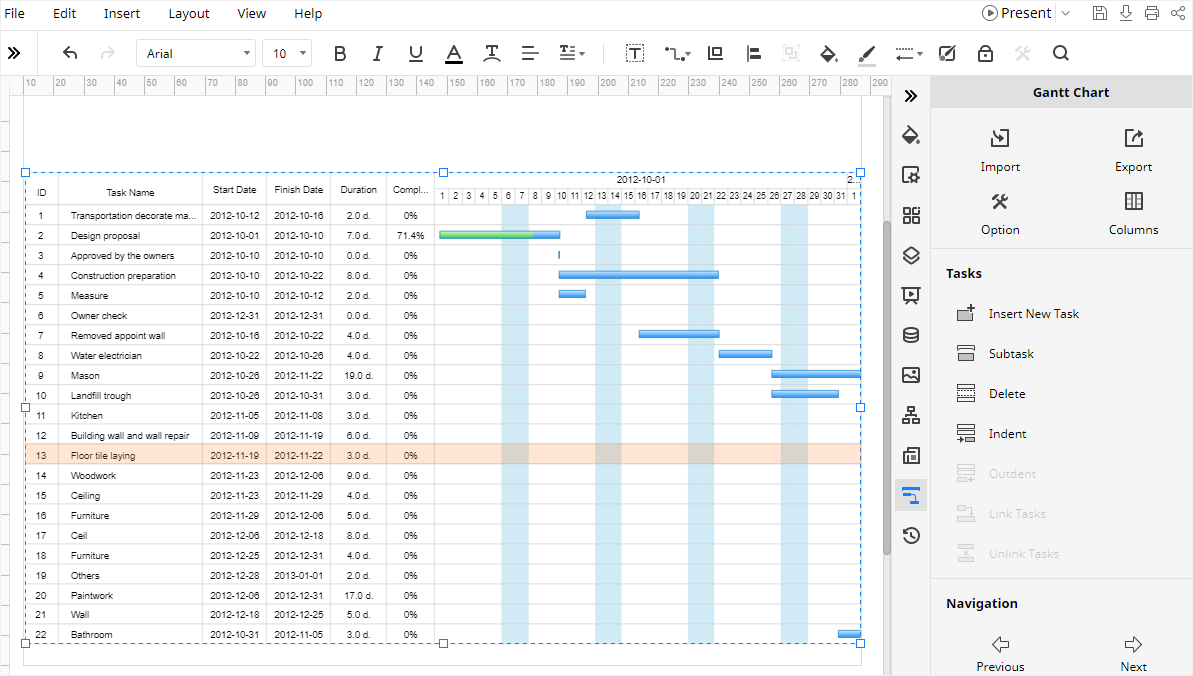
Therefore, in this example, the Gantt chart will be like:
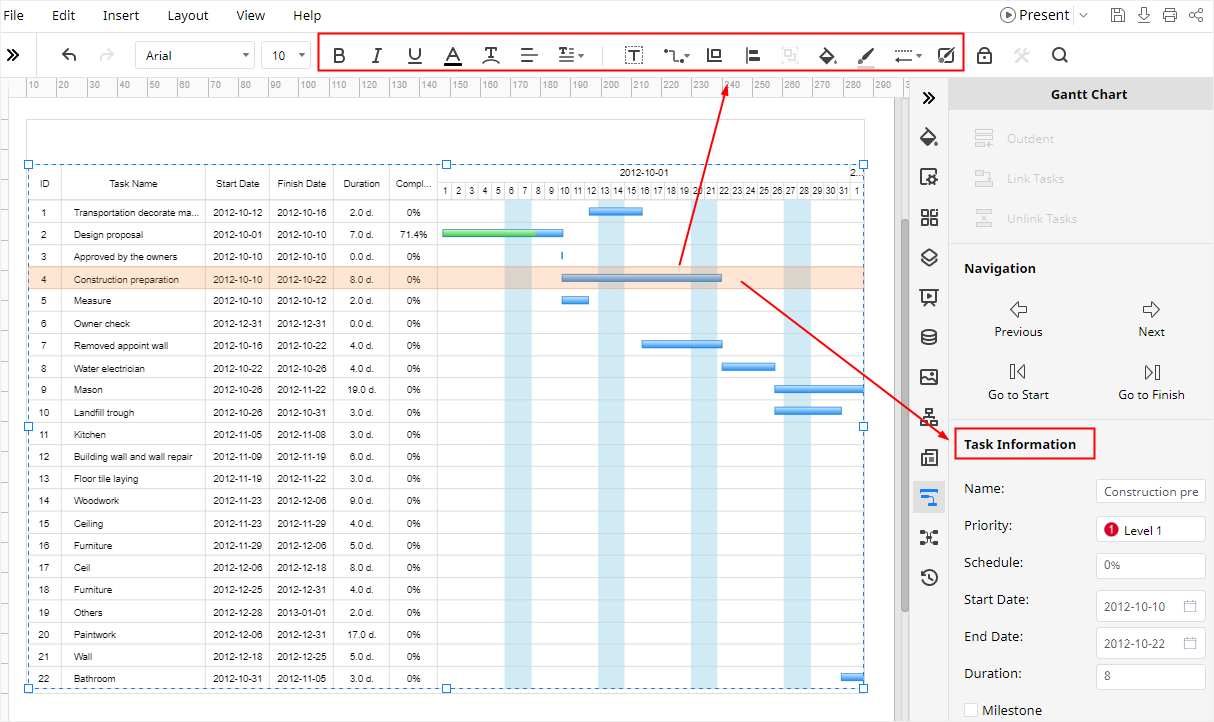
Step 3: Customize Your Gantt chart
Select one of the Gantt bars, the formatting tools on the toolbar and the Task Information section will be activated. Thus, you can change the colors of the bar, or edit its task information.
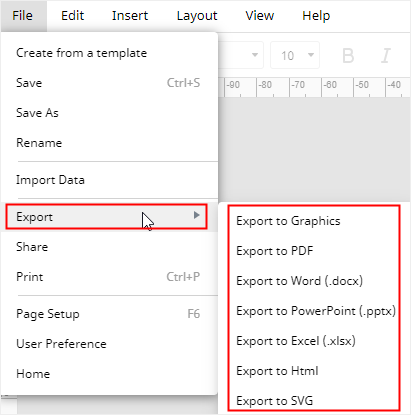
How to Export a Gantt Chart as Office Files
When you have created your own Gantt chart in EdrawMax, you can save the document by pressing Ctrl + S or clicking the Save button on the upper right corner of the main interface.
Moreover, you could export the Gantt chart in the formats of DOCX, XLSX and PPTX. Go to File tab, click Export, you can choose the desired file type and then EdrawMax will automatically export and save your Gantt chart in your computer. All the exported office files from EdrawMax are editable.
Therefore, it will be much easier and more convenient for you to share and transfer your Gantt charts with anyone else, even if he or she hasn’t used EdrawMax before.