How to Make a Line Graph in Excel
A line graph is one of the common graphs used to visualize data and display trends over time in people’s work or study, especially when there are text labels or date labels on the horizontal axis. This article will walk you through how to make a line graph in Excel quickly.
How to Make a Line Graph in Excel
Step 1: Add Data
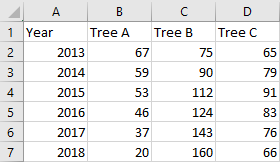
Enable Excel, open a new worksheet and add labels and data for the graph’s X-axis and Y-axis.
Here, in the below picture, you will find that “Year” in A1 is the label for X-axis and “Tree A (B/C)” in B1 & C1 & D1 are the labels for Y-axis. If the volume of the data is not too much, you can type or paste the text or number into cells directly.
Apart from this, you can also choose to import data into Excel if the volume of data is too big. Go to Data tab, find Get External Data group and select one of the importing sources from the available choices.
Step 2: Create Your Line Graph
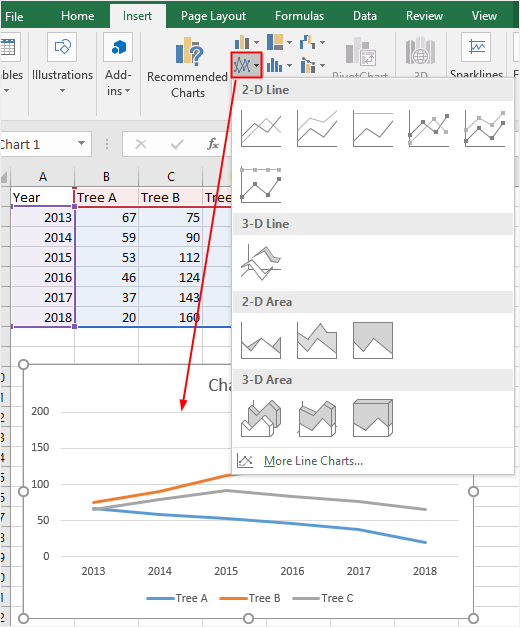
Select the area range on the worksheet, go to Insert tab, find Charts groups on the ribbon and click the line chart icon to open the drop-down menu so that you can choose the desired line graph.
When you pause the cursor on the chart thumbnails, you are able to preview different types of line graphs on the worksheet. There are 2-D line graphs and 3-D line graphs in Excel and you can select suitable line graph types to fit your own needs.
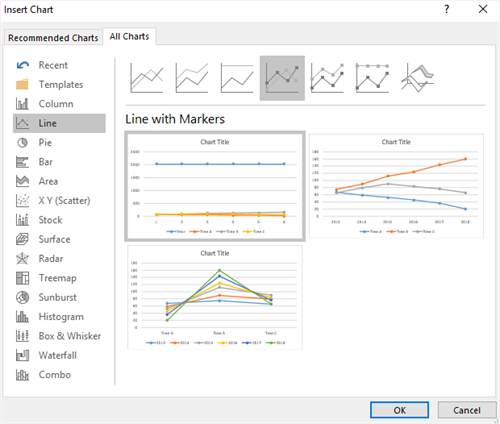
Click Recommended Charts button on Insert tab to open Insert Charts window. In Insert Charts window (All Charts), you can also choose suitable line graph types and select the desired format.
Step 3: Format Your Line Graph
When you need to change the format of your line graph, add chart elements (like axis titles, data labels, gridlines and trendline) or modify the color of the line graph, there are abundant formatting tools in Excel, including Design tab, Format tab, Format Chart Area pane, floating buttons and the right-clicking contextual menu.
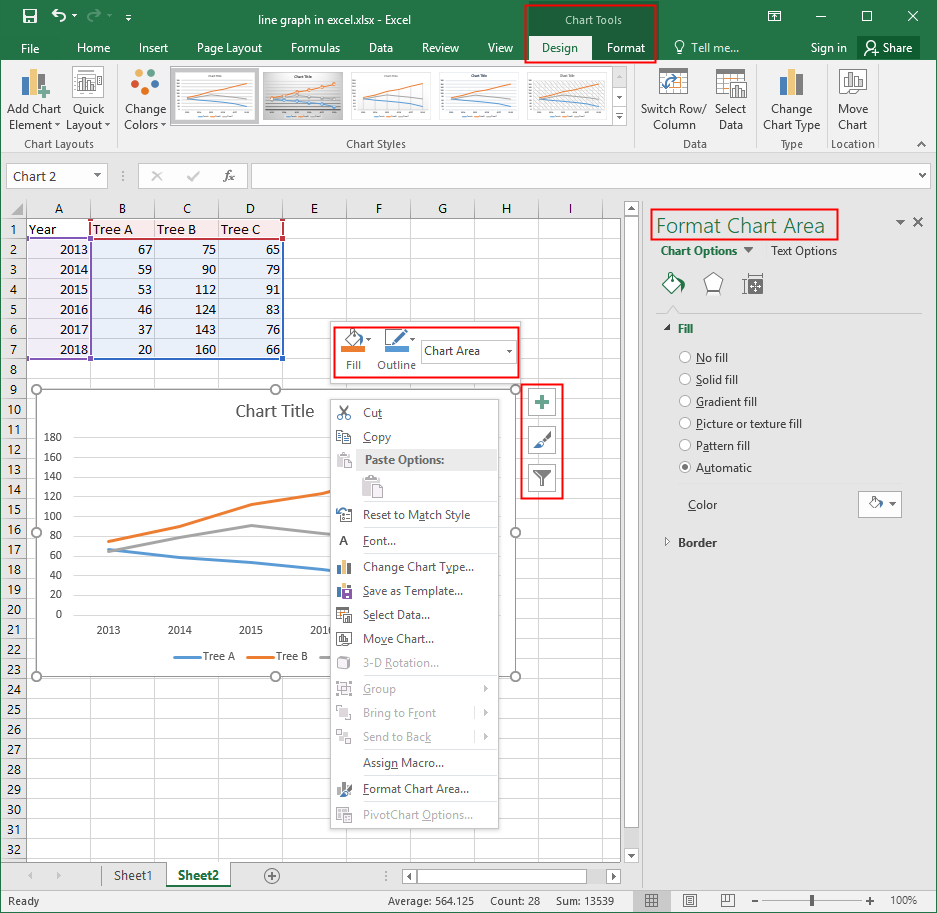
If you need to change the colors or styles of your line graph quickly, you can go to Design tab and find the preferred choices under Change Colors button or Chart Styles list to customize your line graph.
Please note that when you right-click on the different place of the line graph, the right-clicking contextual menu will also have differences from others.
Or, if you choose different selection areas of the line graph under Current Selection group on Format tab, the corresponding shape styles or WordArt styles will change, too.
Step 4: Move Your Line Graph
To move your line graph into another place, you can need to select the line graph at first, click Move Chart button on Design tab or the contextual menu of Chart Area.
Then, you will see the Move Chart window to ask you to choose where to place your line graph.
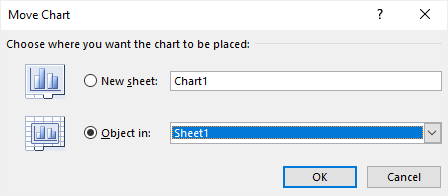
If you choose New Sheet, the line graph will be moved to a new sheet called Chart1 and the line graph will be on the center of the sheet; if you choose Object in, you can choose to move the line graph into another worksheet.
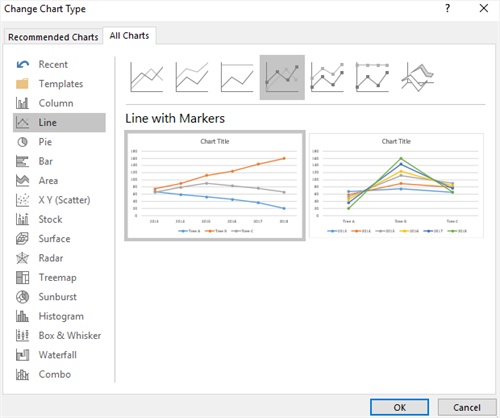
Step 5: Change Graph Type
If you want to see other kinds of visual representations of the data, you can choose to change the type of the graph. You can find Change Chart Type button on Design tab or the contextual menu of Chart Area.
Next, Change Chart Type window will appear on the worksheet and it actually look the same as Insert Chart window. Then you can choose any other chart or graph type. When you are satisfied with the new chart through the preview thumbnails, click OK so that you can change the graph type quickly.
How to Make a Line Graph in EdrawMax
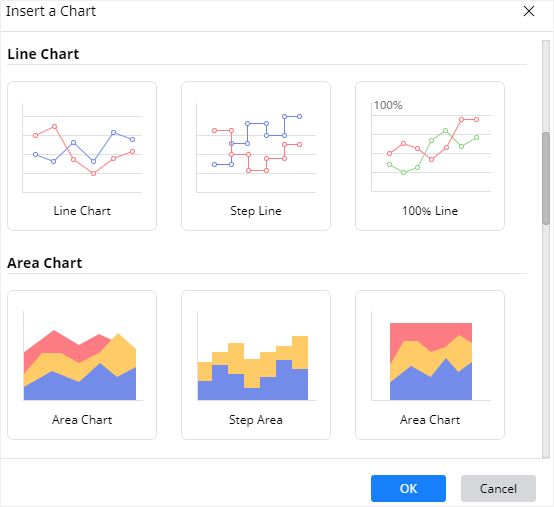
Step 1: Select Chart Type
When you open a new drawing page in EdrawMax, go to Insert tab, click Chart or press Ctrl + Alt + R directly to open the Insert Chart window so that you can choose the desired chart type.
Here we need to insert a basic line graph into the drawing page, so we can just select “Line Chart” from the window and click OK.
Step 2: Create Your Line Graph
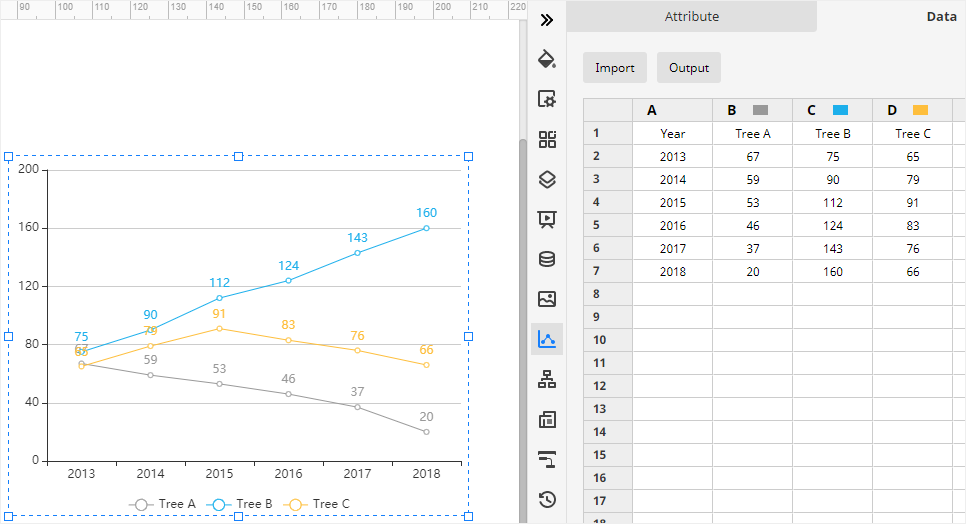
After you select the desired line graph type and click OK, the example linr graph will appear on the drawing page with the Chart pane.
Then you need to import or enter the data for making the line graph. EdrawMax supports users to import xlsx or csv files.
Go to Data pane, click Import, find the data file in the local storage and click Open. Then you will see the data that you want to use appear on the Data pane, and at the same time, the line graph on the drawing page will also be changed according to the imported data.
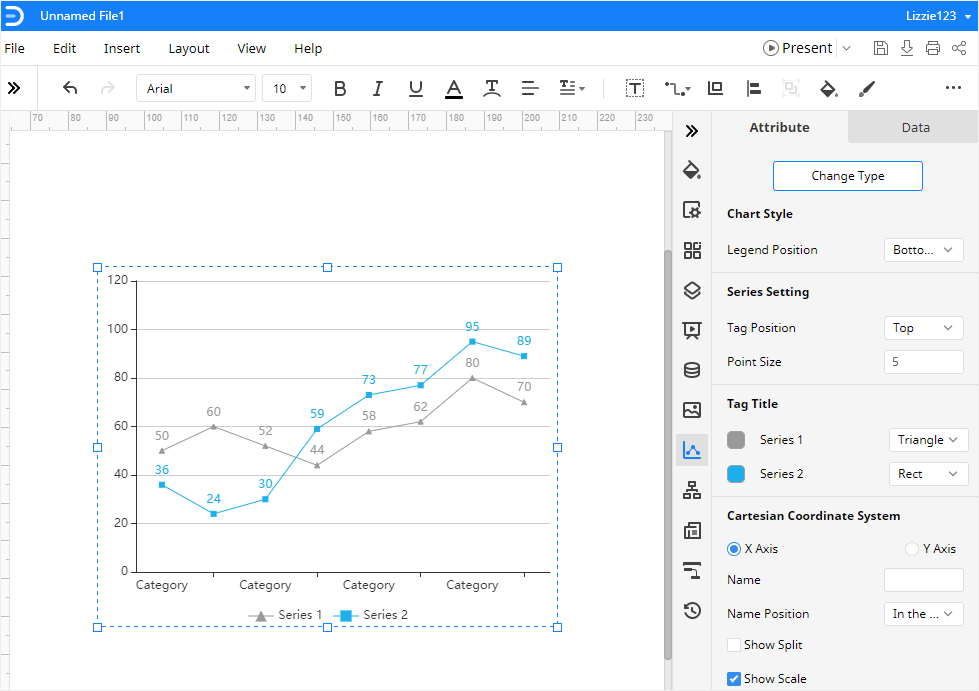
Step 3: Format Your Line Graph
On the Attribute pane, you can change the format and various attributes of the line graph freely, which include Chart Style, Series Setting, Tag Tittle, Cartesian Coordinate System and Data Format.
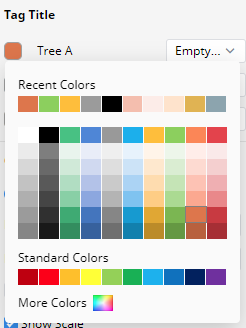
If you don’t like the default color of the line, you can go to find Tag Title, click the color icon next to the label and find the desired color on the drop-down menu.
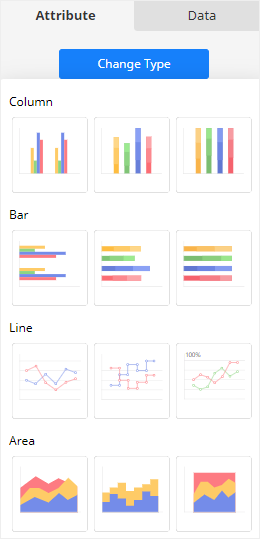
Step 4: Change Graph Type
In addition, EdrawMax also supports users to change chart types if you want to change the chart type and see different effects of data visualization.
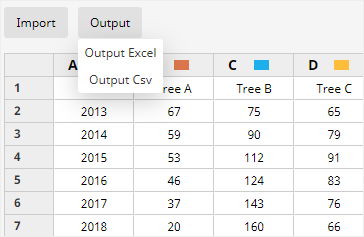
Step 5: Export Data File
When you have to save the data used for making the line graph in EdrawMax Online, select the graph, go to Data pane and click Output to choose the file type that you want. At present, EdrawMax allows users to export the data as the file types of xlsx and csv.
How to Export an EdrawMax Graph as Excel File
When you finish making a line graph in EdrawMax Online, you are also able to save and export the graph as an Excel file.
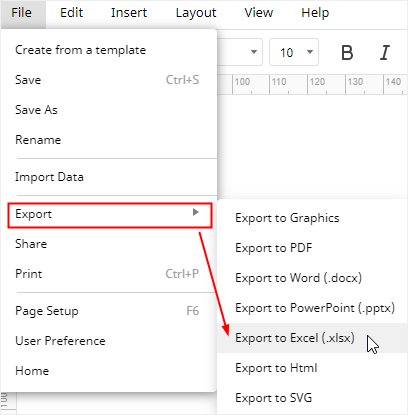
Go to File tab, click Export > Export to Excel, and EdrawMax will automatically save and download the created line graph as an Excel file in your computer. So you can get a line graph in Excel format. All the Microsoft Office files exported from EdrawMax are editable.
Thus, it will be much easier for you creating a line graph in EdrawMax and sharing it as an Excel file with your colleagues or friends. In addition, you and anyone else are able to edit and modify the exported line graph in Microsoft Excel (only for 2013 or above version) directly.