How to Make a Pie Chart in Excel
A pie chart is one of the common charts in Excel and used to visualize simple statistical information and it’s also easy to understand and read. This article will give you a detailed instruction on how to make a beautiful pie chart in Excel.
How to Make a Pie Chart in Excel
Step 1: Add Data
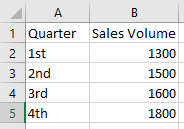
Enable Excel, open a new worksheet and add labels and data for the pie chart that you are going to make. In the below picture, we add the data about time and sales volume into the worksheet.
Compared with line graphs or bar graphs, you can only add a single data series in a pie chart and any zero or negative values shouldn’t be added into the data series, since the pie chart can’t display these values rightly to user as line graphs or bar graphs.
Beside, users can also choose to import data into Excel if the data volume is overwhelming. Go to Data tab, find Get External Data group and select one of the importing sources from the available choices.
Step 2: Create Your Pie Chart
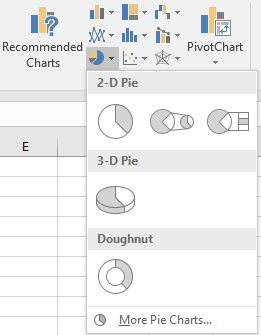
Select the area range on the worksheet firstly, go to Insert tab, find Charts groups on the ribbon and click the pie icon to open the drop-down menu so that you can choose the desired pie chart.
When you pause the cursor on the chart thumbnails, you are able to preview different types of pie charts. As you can see, 2-D Pie Chart has the types of basic pie chart, pie of pie and bar of pie. Apart from these, you can also choose to use 3-D Pie Chart and Doughnut Chart to display the data.
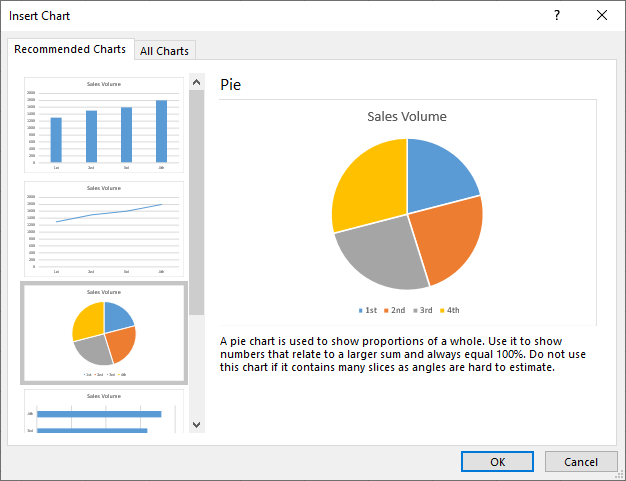
Click Recommended Charts button on Insert tab to open Insert Charts window. In Insert Charts window (All Charts), you can also choose other suitable pie chart types.
Step 3: Format Your Pie Chart
When you want to customize your pie chart, add chart elements (like axis titles, data labels, gridlines and trendline) or modify the color of the pie chart, there are abundant formatting tools in Excel, including Design tab, Format tab, Format Chart Area pane, floating buttons and the right-clicking contextual menu.
As the below picture shows, when you have to change the appearance of the pie chart, shadow, fill or text, you can change the corresponding options in Format Chart Area.

If you need to change the layout or styles of your pie chart quickly, you can go to Design tab and find the preferred choices under Quick Layout button or Chart Styles list to customize your pie chart.
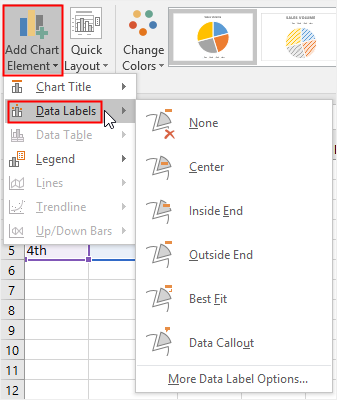
If you want to add data labels in your pie chart, go to Design tab or click the floating plus icon next to the chart to find Data Labels option. Then you can choose the favored position to put data labels.
Step 4: Move Your Pie Chart
To move your pie chart into another place, you can need to select the pie chart at first, click Move Chart button on Design tab or the contextual menu of Chart Area.
Then, you will see the Move Chart window to ask you to choose where to place your pie chart.
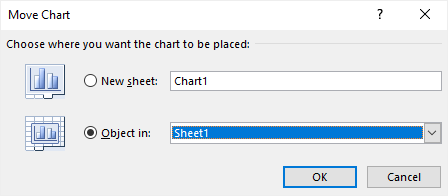
If you choose New Sheet, the pie chart will be moved to a new sheet called Chart1 and the pie chart will be on the center of the sheet; if you choose Object in, you can choose to move the pie chart into another worksheet.
Step 5: Change Chart Type
If you want to see other kinds of visual representations of the data, you can choose to change the type of the chart. You can find Change Chart Type button on Design tab or the contextual menu of Chart Area.
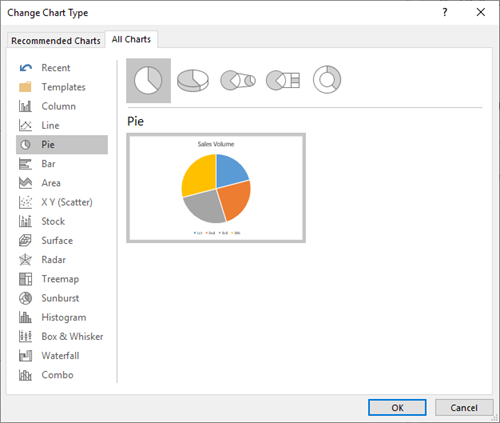
Next, Change Chart Type window will appear on the worksheet. Then you can choose any other chart or graph type. When you are satisfied with the new chart through the preview thumbnails, click OK so that you can change the graph type quickly.
How to Make a Pie Chart in EdrawMax
Step 1: Select Chart Type
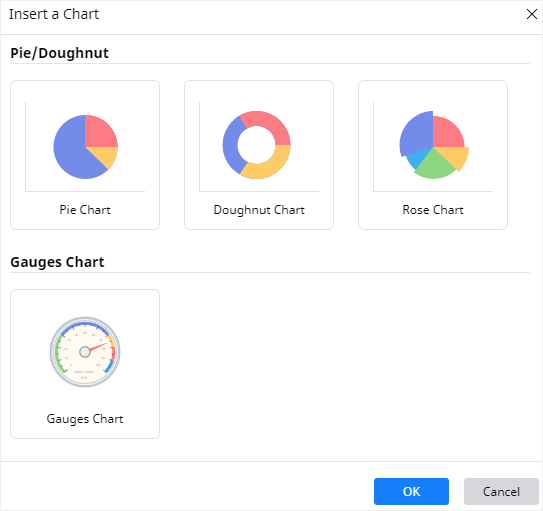
When you open a new drawing page in EdrawMax, go to Insert tab, click Chart or press Ctrl + Alt + R directly to open the Insert Chart window so that you can choose the desired chart type.
Here we need to insert a basic pie chart into the drawing page, so we can just select “Pie Chart” on the window and click OK.
Step 2: Create Your Pie Chart
After you select the desired pie chart type and click OK, the example pie chart will appear on the drawing page. You can click Chart icon ![]() on the right sidebar to open the Chart pane.
on the right sidebar to open the Chart pane.
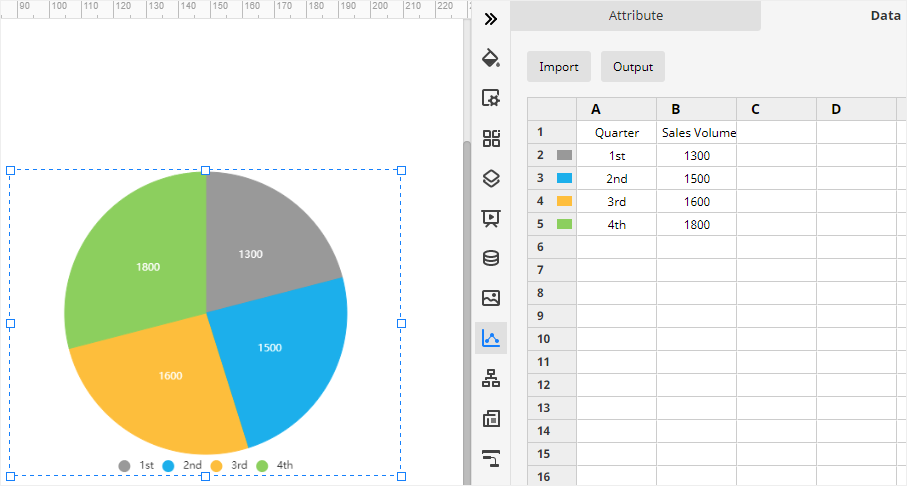
Then you need to import or type the data for making the pie chart. EdrawMax supports users to import xlsx or csv files.
Go to Data pane, click Import, find the data file in the local storage and click Open. Then you will see the data that you want to use appear on the Data pane, and at the same time, the pie chart on the drawing page will also be changed according to the imported data.
Step 3: Format Your Pie Chart
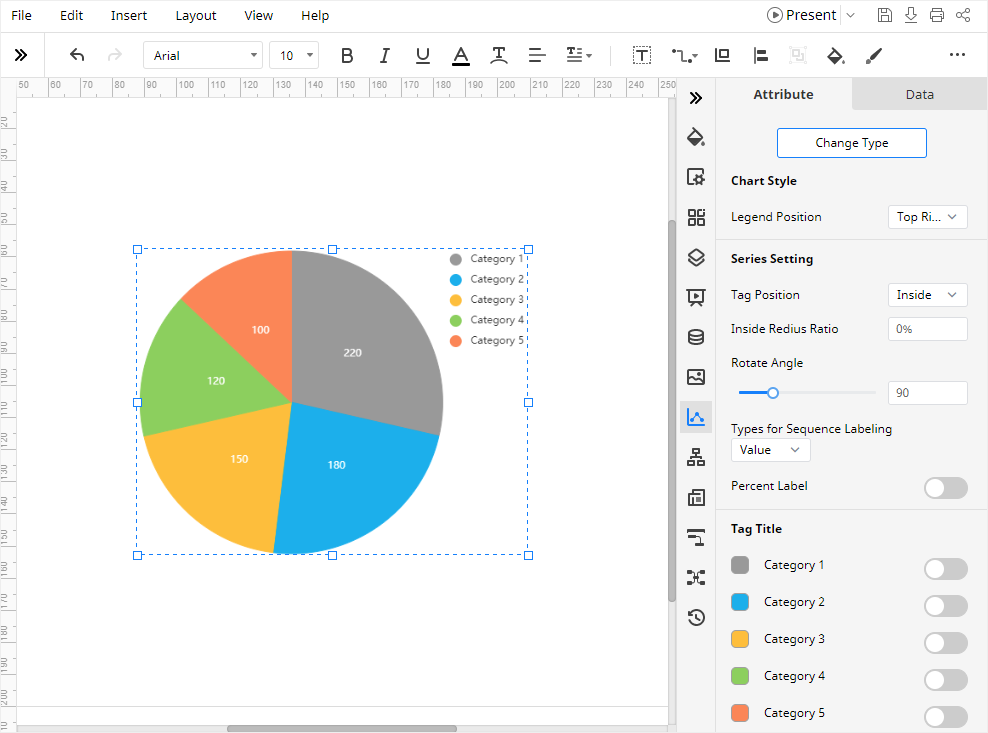
On the Attribute pane, you can change the format and various attributes of the pie chart with various options, including Chart Style, Series Setting, Tag Tittle, Cartesian Coordinate System and Data Format.
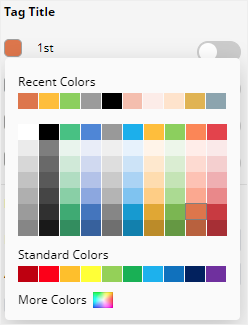
Especially, if you don’t like the color of any part of the pie, you can go to find Tag Title, click the color icon next to the label and find the desired color on the drop-down menu.
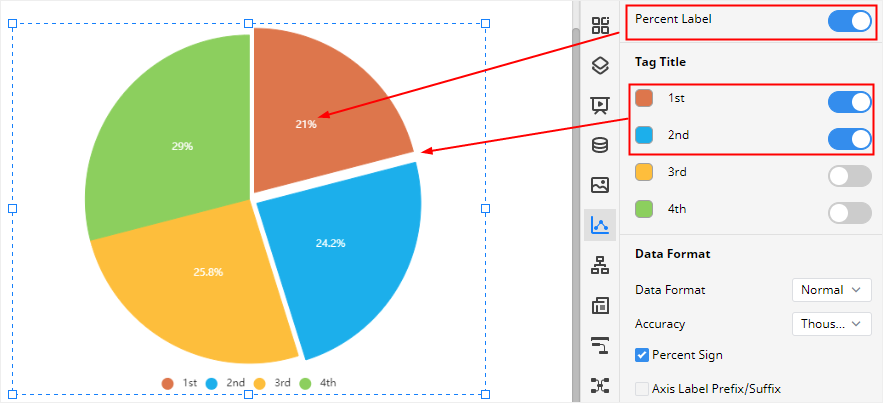
If you want to see the percent labels of each part of the pie, you click Percent Label on the Attribute pane.
What’s more, if you want to see some parts of the pie separate from the center point, you can click the corresponding labels under Tag Title menu. You can the final effect on the below picture.
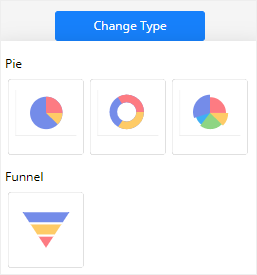
Step 4: Change Chart Type
In addition, EdrawMax also supports users to change chart types. You can transform the pie chart into a Doughnut Chart.
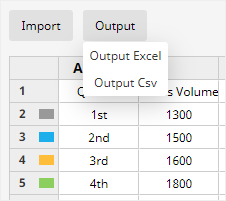
Step 5: Export Data File
When you have to save the data used for making the pie chart in EdrawMax Online, select the chart, go to Data pane and click Output to choose the file type that you want. At present, EdrawMax allows users to export the data in the format types of XLSX and CSV.
HHow to Export an EdrawMax Chart as Excel File
When you finish making a pie chart in EdrawMax Online, you are also able to save and export the chart as an Excel file.
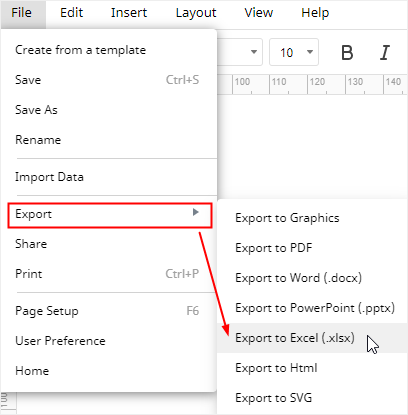
Go to File tab, click Export > Export to Excel, and the application will automatically save and download the created pie chart as an Excel file. So you can get a pie chart in Excel format. All the Microsoft Office files exported from EdrawMax are editable.
Thus, there will be less trouble or difficulty in creating a pie chart with the help of EdrawMax and you can easily share your graphs and charts made by EdrawMax with your colleagues or friends who may not use EdrawMax before.
In addition, you or anyone else can edit and modify the exported pie chart in Microsoft Excel (only for 2013 or above version) directly.