How to Make an Infographic With Detailed Tutorial
Create a Infographic on Edraw.AI Online Free Free Download Free Download Free Download Free DownloadWhen to Use an Infographic
When it comes to infographics, great visuals and well laid-out information are vital to creating impacts. Infographics are visually rich graphics that depict information in easily understandable bits. Got complex information that you’d want people to understand at first glance? Use visuals to represent and break down that information.
Infographics are hugely popular and rightly so because they act as tools that let you break down information in visually appealing bits, and they are a great way to simplify hard concepts and provide an overview or summary of a subject matter.

Image Source: pixabay.com
How to Plan an Infographic
How do you create an infographic that makes an impact? There are a lot of tools for building an infographic online, but first, it’s important to note the key elements that make for a useful infographic. Planning your infographic ahead of designing is fundamental if you want your infographic to command attention and effectively communicate to your target audience.
Below are noteworthy actionable points that’ll help you plan and create attention-grabbing infographics.
- Decide the goal and target audience of your infographic:
Plan your infographic by first defining the purpose/reason for making one. Deciding if your infographic is for introducing a brand/product, educating, entertaining, or presenting survey data is crucial in creating an infographic that’s right for you. Also, decide the people who you want to aim at and engage with your infographic. Knowing your target audience informs the choice of elements you’ll pick when making an infographic.
- Gather the data for the infographic:
Research and come up with the information to be used in the infographic.
- Select a method to visualize your data:
Depending on the goal of your infographic, select the most appropriate data visualization method, be it charts, tables or graphs, etc.
- Select colors and fonts:
Aesthetically appealing infographics always hold attention. Choose colors and fonts that complement each other and bring the wow-factor to your infographic.
- Write the text for your infographic:
In small bits, write a clear textual copy to accompany the visuals of your infographic.
How to Design an Infographic Online
Edraw Max online diagramming tool allows you to create infographics online from scratch or pre-designed templates in quick and easy steps. Follow the steps below to learn how to make a useful infographic online right now without any prior knowledge.
Step 1: Sign up on Edraw Max Online
Grab all the attention with your infographic by signing up on Edraw Max Online website for free using your email address or Facebook/Twitter account to get started with creating share-worthy infographics.
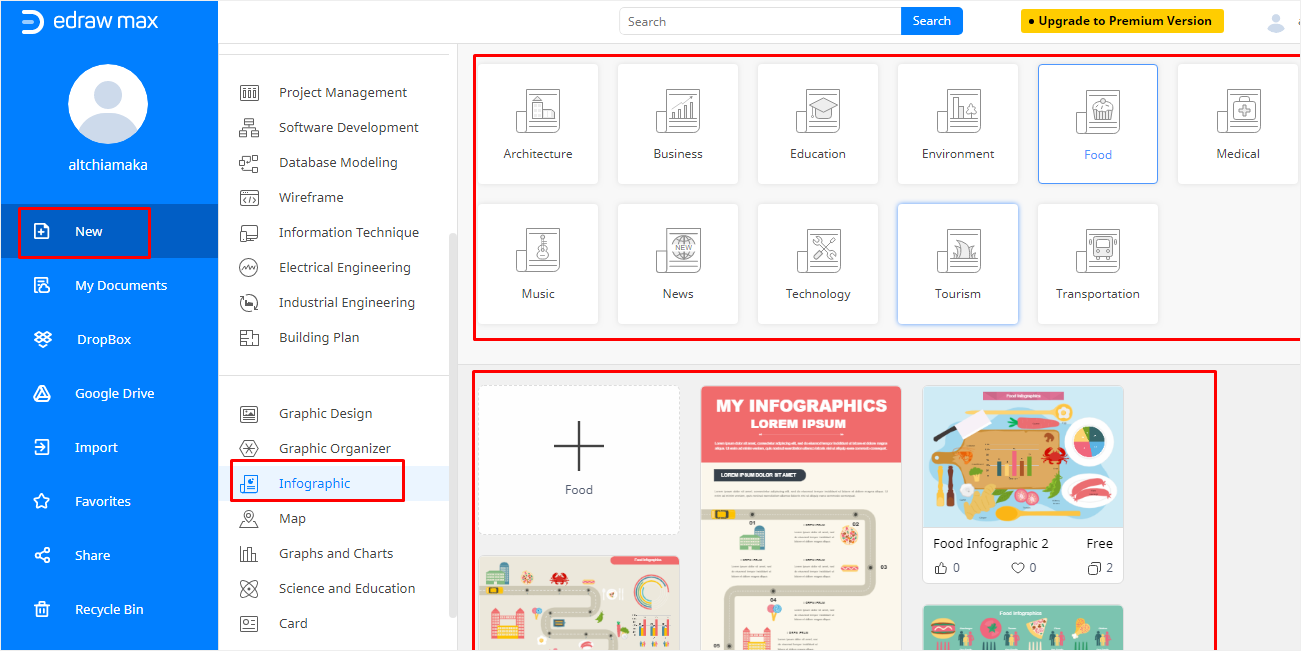
Step 2: Select a template
In Edraw max Online, click New to start a new project. Scroll down and click Infographic from the project categories, then select a template by clicking any template from the template categories or click the blank canvas to make an infographic from scratch.
Step 3: Customize the template using the Symbols Library
Once the template is loaded up in the work area, add your personal touch to the infographic by clicking the Symbol Library to drag and drop symbols you like onto your work canvas. The Symbol Library has a vast number of symbols to help you create unforgettable infographics.
From the Style settings, you can color fill, edit the line, and shadow settings of the images in the infographic.
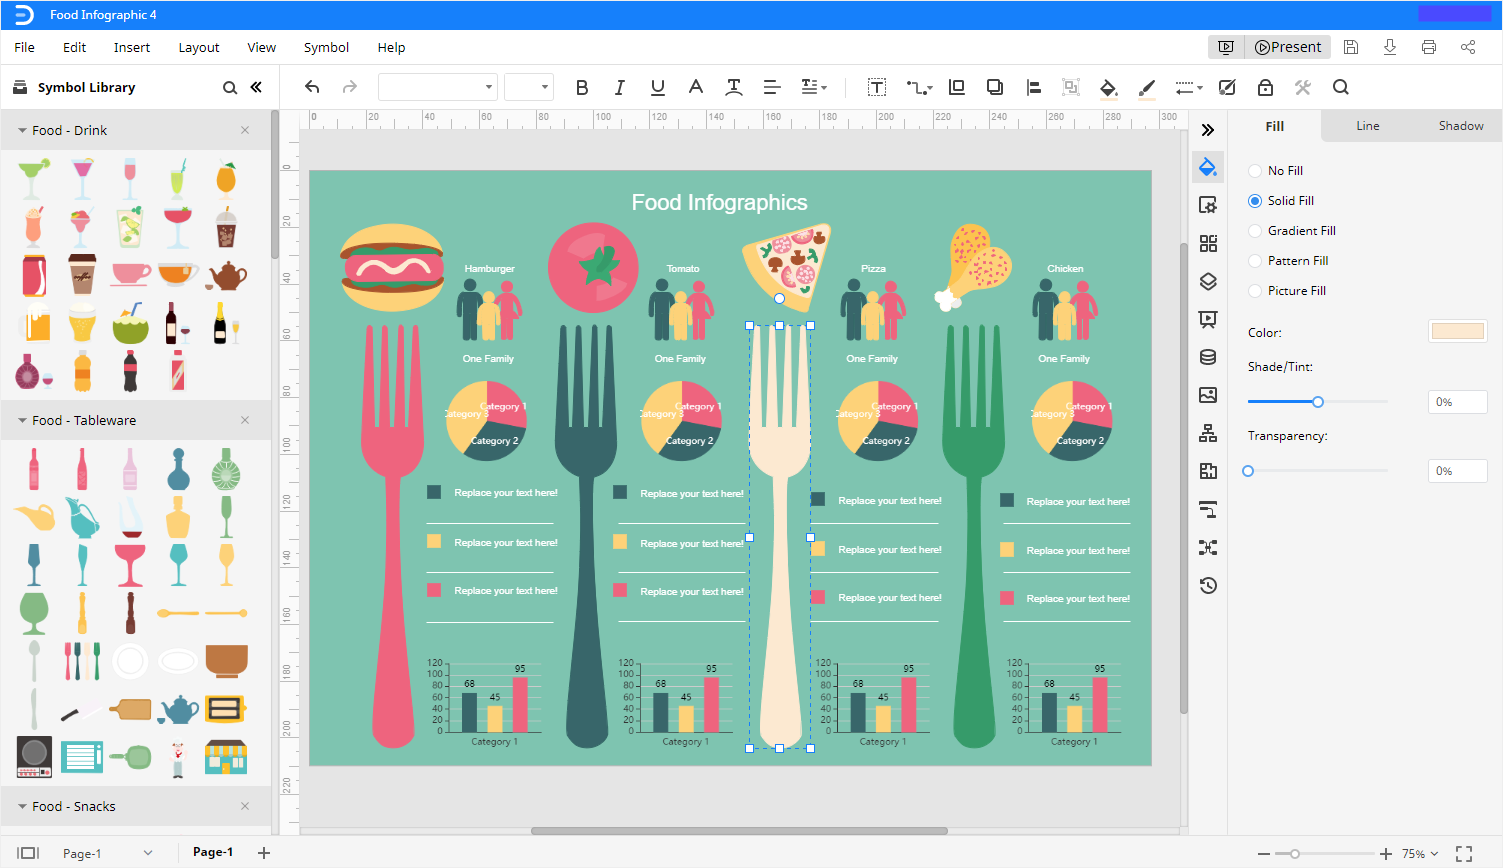
Step 4: Input text
Type the text that will accompany the visuals for your infographic. You can format text using text format options: Change font types, Bold, Italics, Underline, Change color, Wrap text, etc. See the screenshot below.
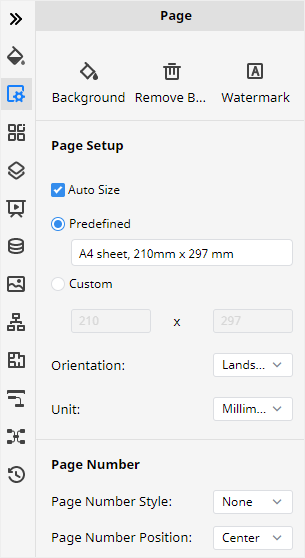
Step 5: Page Setup
Once you finish customizing the template to your liking, you can make some changes to the page setup: add/remove background or watermark, resize page or use custom size, change orientation to landscape or portrait, etc. Refer to the screenshot below.
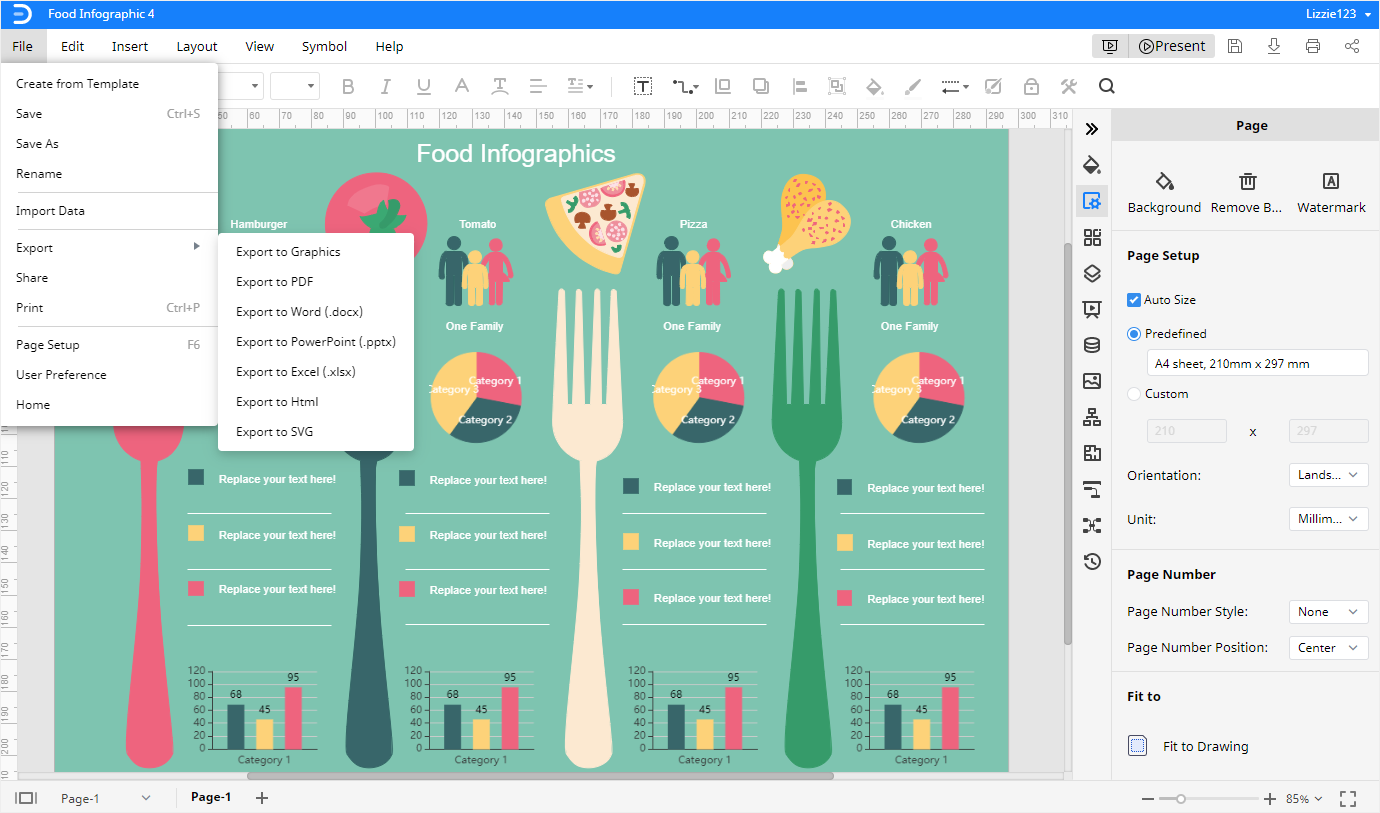
Step 6: Save, download, and export infographic
Once you are satisfied with the infographic, click the floppy disc icon to save your work. Click the download icon to download the infographic. Click the printer icon to print the infographic.
Edraw Max supports exporting infographics in several file formats such as JPG, PNG, SVG, PDF, MS Word, PowerPoint, and Excel. With Edraw Max, you can also save your infographic right in your Google Drive or Dropbox.
Free Various Infographic Templates
When it comes down to creating infographics online, there is always a template to meet your needs on Edraw Max. Here are some free templates to help you decide the template that’s right for you.
- Business Process Infographic Template: Need to break down the operation flow for your business to potential customers? Then the business process infographic template is the right choice for you. The template lets you enlighten your audience on how your business operation is processed.

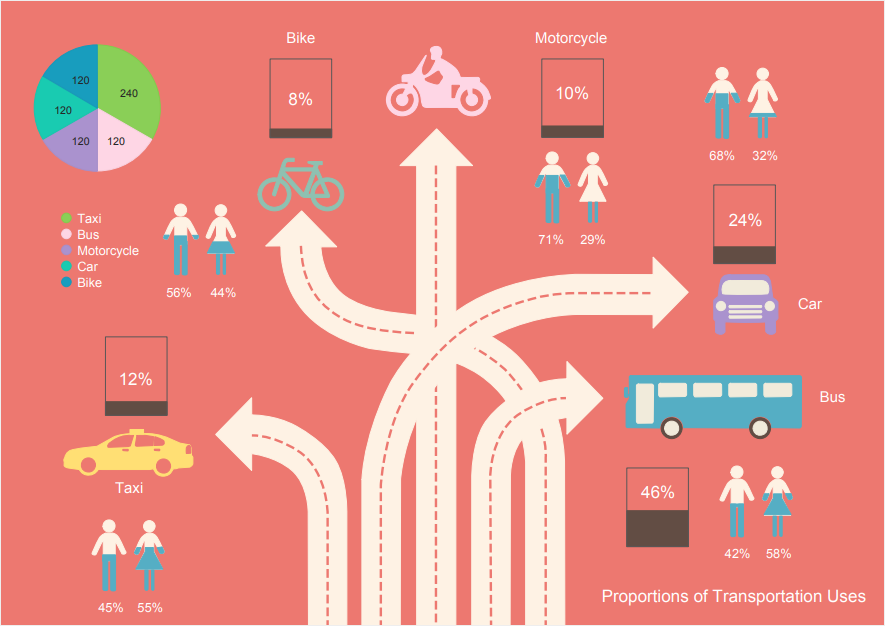
- Choose Transportation Infographic Template: This is an aesthetically rich infographic that is useful for when you need to provide data on the proportion of people using different means of transportation in a given population.
- Simple Infographic Resume Template: Make your resume stand out from those of other job seekers and grab the attention of recruiters with this easy to customize resume template.