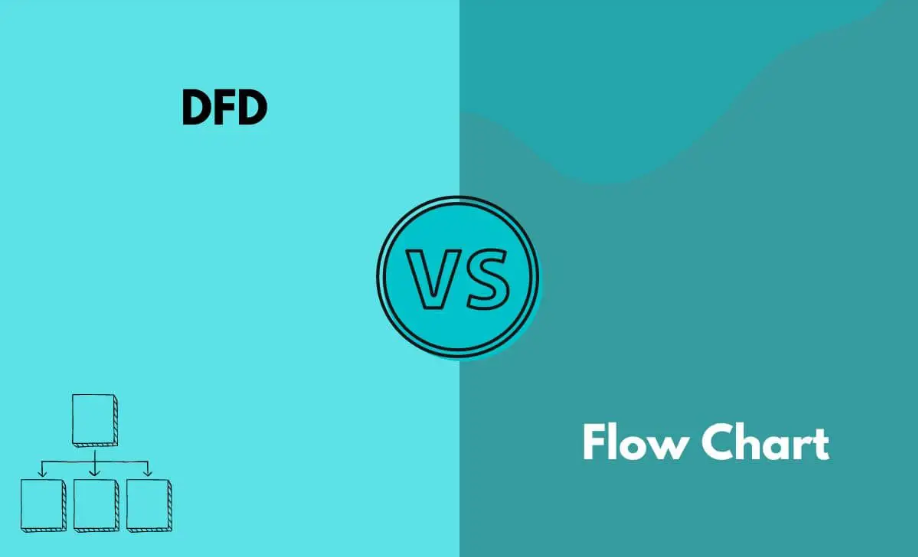
Difference Between Flowchart and Data Flow Diagram | Learn to Create These Diagrams
Read this article to understand how flowcharts are different from data flow diagrams and how you can draw them efficiently..
Software development is a complex job to do; therefore, writing code to build a program directly is very challenging and may create several problems in the end. So, before you move toward developing a program, it is crucial to create a complete model of the system to define the end goals and determine how to achieve them. This is where the visual representation of your system comes in handy.
A variety of diagrams, including flowchart and data flow diagram, helps you visualize the process of developing a program or software to make you familiar with the overall process before you start coding. But what exactly is the role of each diagram? Is this what you have in mind? If yes, you don’t want to miss the discussion below, as it presents the difference between flowchart and data flow diagram.
1. What Is a Flowchart?
A flowchart is a diagram that represents the steps of a particular problem to propose a viable solution. It is a universally recognized graphical representation of problems and their solutions, and millions of companies use it to streamline their business processes. When it comes to designing an effective solution to a problem, a flowchart is easy to use compared to a data flow diagram.
In addition, you can also use a flowchart to define and present the steps of a process, algorithm, or software. Thousands of research studies have proved that human minds get more attracted to graphics and images than text, which is why flowcharts and other similar diagrams have evolved in the last few years.
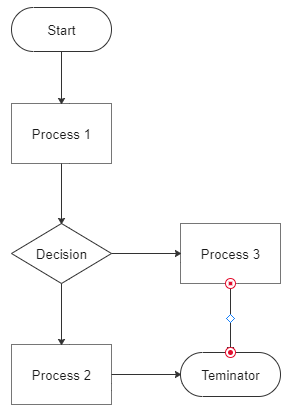
A flowchart uses different symbols to show various steps of a process. These symbols include; circles, ovals, rectangles, parallelograms, diamonds, arrows, etc. Each symbol has a unique function to perform, as listed below.
- Oval: It is also called a terminator and is used to display the start points and endpoints of a process.
- Rectangle: It acts as a backbone of a flowchart and is used to display the process being carried out.
- Diamond: It is used when you need to make specific decisions. In other words, it executes the conditional statements required to meet certain conditions.
- Parallelogram: The inputs provided to your system and outputs generated by that system are denoted by a parallelogram.
- Arrow: It shows the flow of information or data within the system. The direction of the arrows determines whether data is flowing upward, downward, left, or right.
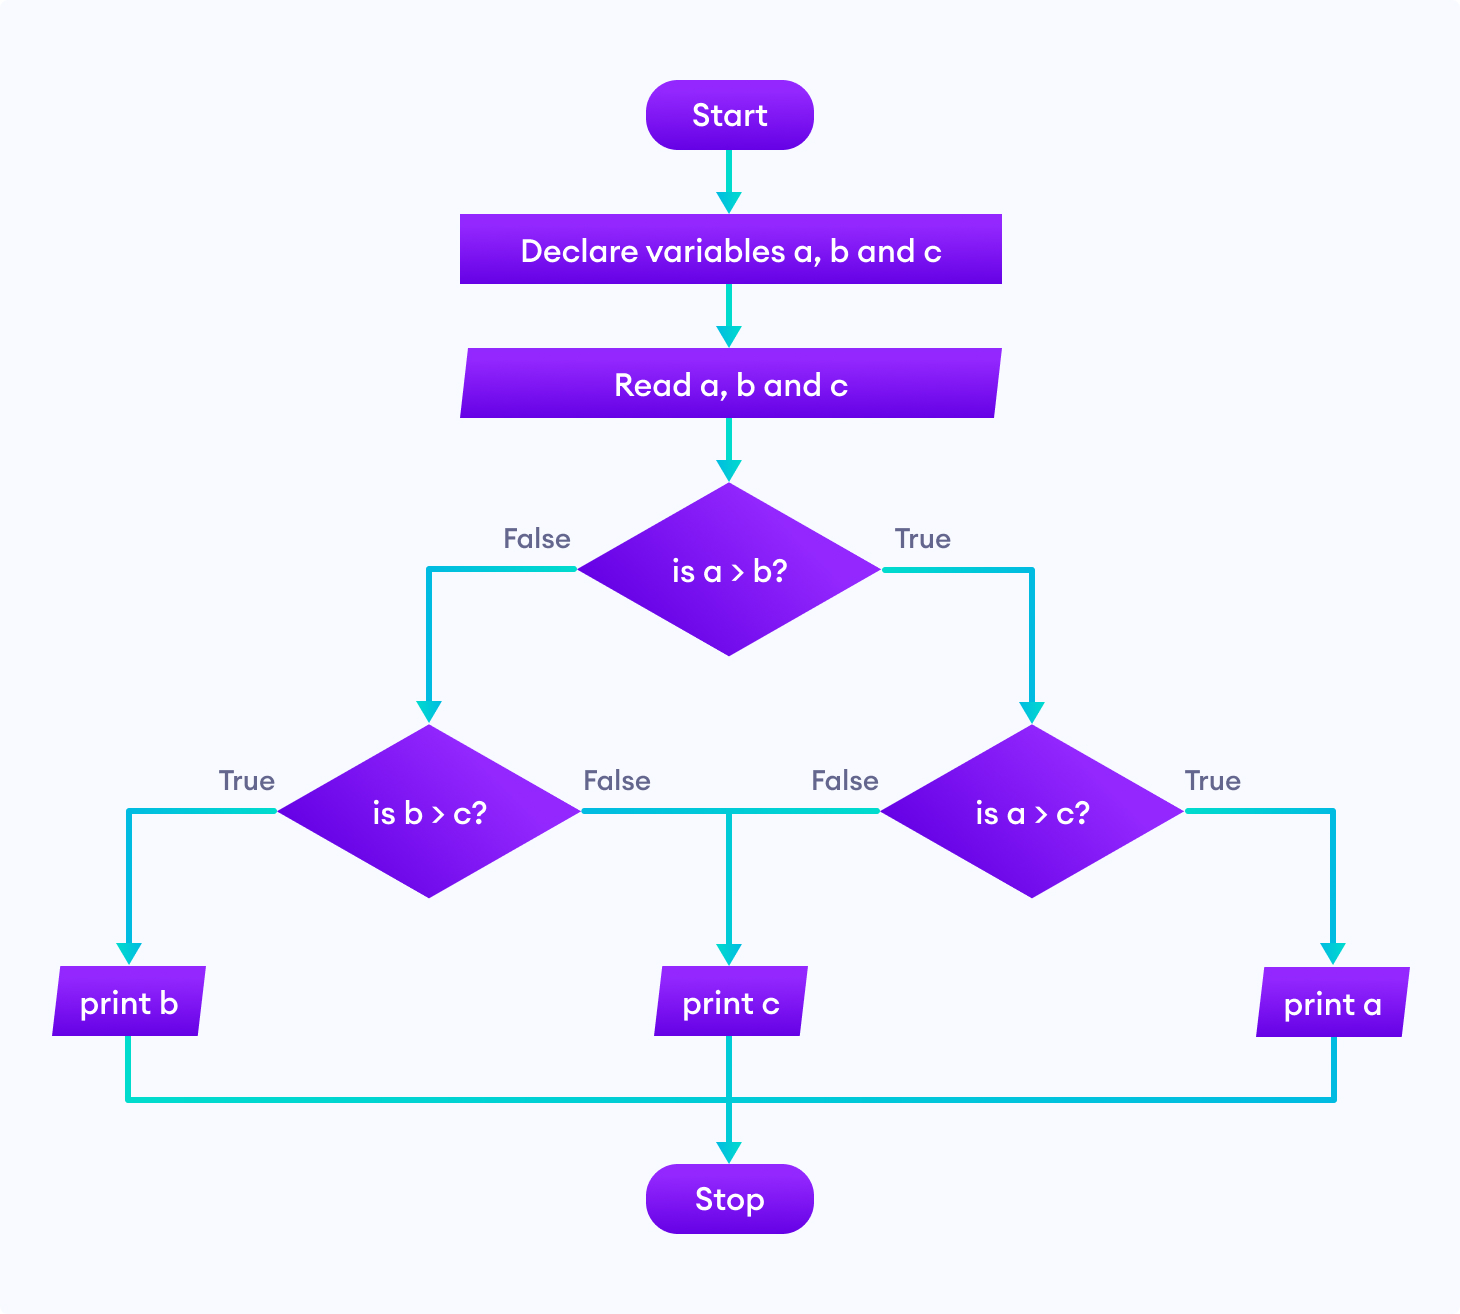
Let’s look at what a flowchart looks like.
2. What Is a Data Flow Diagram?
The shorter version of the data flow diagram is DFD. You may have seen this on many online forums. As you can see, this term is a combination of three words, “data,” “flow,” and “diagram.” The word “data” means the information, “flow” refers to the movement of information, and “diagram” means the graphical representation of the information flow within the system.
In simple words, you can say that the data flow diagram is a process of taking data or information as an input, storing it, and producing an output with the same data. So, a DFD presents the path of the information that flows between the input and out of the system. Two types of notations (as listed below) are used for the data flow diagram.
- Gane-Sarson: These data flow diagrams are perfect for information systems. They represent the process with squares having round corners.
- Youdon-Coad: When it comes to analyzing and designing a system, Youdon-Coad data flow diagrams are ideal choices. They represent the process with circles.
The image below shows the data flow diagram.
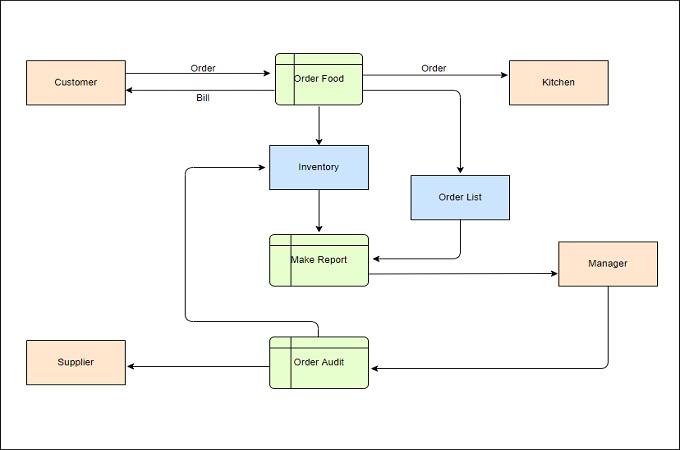
Four major elements of a data flow diagram are as follows.
- Entities: The source or destination of the data is called the entity of a data flow diagram. The system takes the data from the source and hands it over to another entity - sink. An entity is represented by a rectangle.
- Process: It involves different functions, including computations, data transformation, and decision-making. A circle symbol is used to show a process. The circle carries the process name and number.
- Data Store: It refers to storing the data and ensuring it is available for different processes. A rectangle (with one part closed and another opened) is used to present the data storage in the data flow diagram.
- Data Flow: The flow of data within a DFD shows the interaction of the data with different components of this diagram, like data stores, processes, and entities. Arrows are used to present the data flow in a DFD.
Now that you know what these diagrams are, let’s get into the specifics of the difference between data flow diagram and flowchart.
3. Key Difference Between Flowchart and Data Flow Diagram
Well, a flowchart presents a diagrammatic, step-by-step solution to a specific problem. On the other hand, the graphical representation of the data flow within a system is what a data flow diagram shows. So, this highlights the major difference between flowchart and data flow diagram. Let’s explore a few more factors that make data flow diagrams and flowcharts different from each other.
- Applications: The usage leads to another difference between flowchart and data flow diagram. A flowchart is commonly used to design, analyze, and manage a process or a program. In contrast, a data flow diagram allows you to understand the system’s overview without exploring more details.
- Applicability: Using a flowchart for complex systems is not a good idea. Whereas data flow diagrams perform well for complex programs or systems. So, this is another potential difference between data flow diagram and flow chart.
A few more differences between these diagrams are listed in the table below.
| Parameters | Flowchart | Data Flow Diagram |
|---|---|---|
| Representation | Three symbols are used to represent a flowchart | Five symbols are used to represent a data flow diagram |
| Major Goal | Solving a given problem | Dealing with the data flowing through the system |
| Level | It presents a lower-level view of a program or system | It presents a higher-level view of a system or program |
| Types | Program flowchart, data flowchart, system flowchart, document flowchart | Physical DFD and logical DFD |
4. Examples of Flowcharts Created in Wondershare EdrawMax
Let’s look at a few examples of flowcharts to make things clearer.
1. Manpower Requirement Flowchart
As the name shows, this flowchart is directly linked to the human resource departments of different organizations working around the globe. It lends companies a helping hand when hiring appropriate resources to streamline the business process.
A manpower requirement flowchart created in Wondershare EdrawMax is shown below. It presents a sequence of steps to hire potential manpower for a business.

 below.
  below.
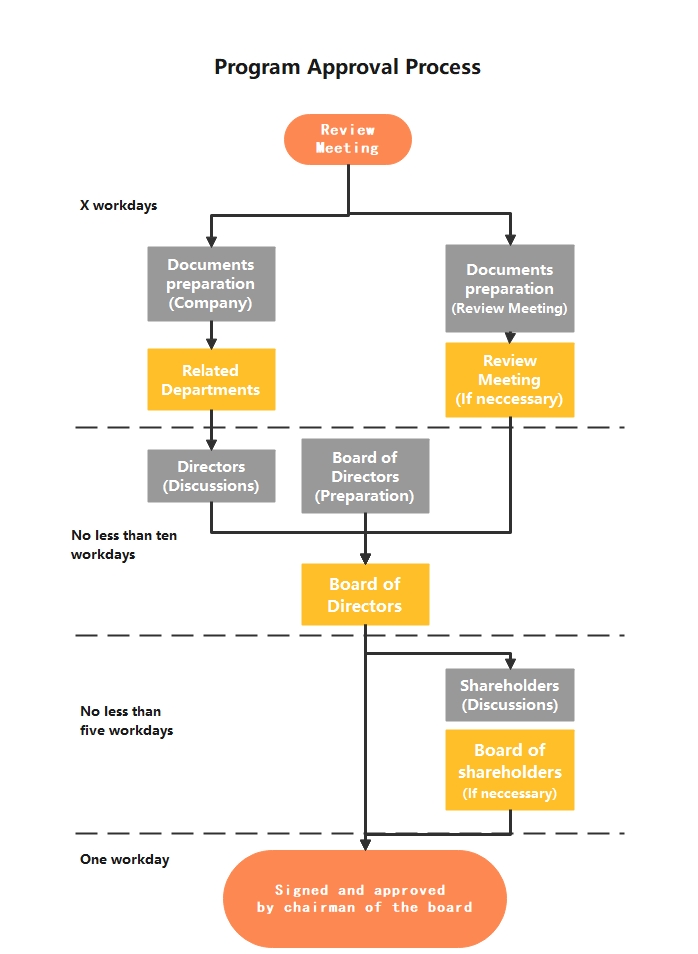
 2. Engineering Flowchart
The name of this flowchart shows that it is associated with a task of the engineering department. It could be any task, like buying raw materials, preparing project plans, extracting progress reports, or maintaining a smooth manufacturing process to meet the recent market demands.
An engineering flowchart example created in Wondershare EdrawMax is shown below. It presents a complete program approval process, which consists of different steps, like review meetings, document preparation, presenting documents in front of the board of directors and stakeholders, and final approval.
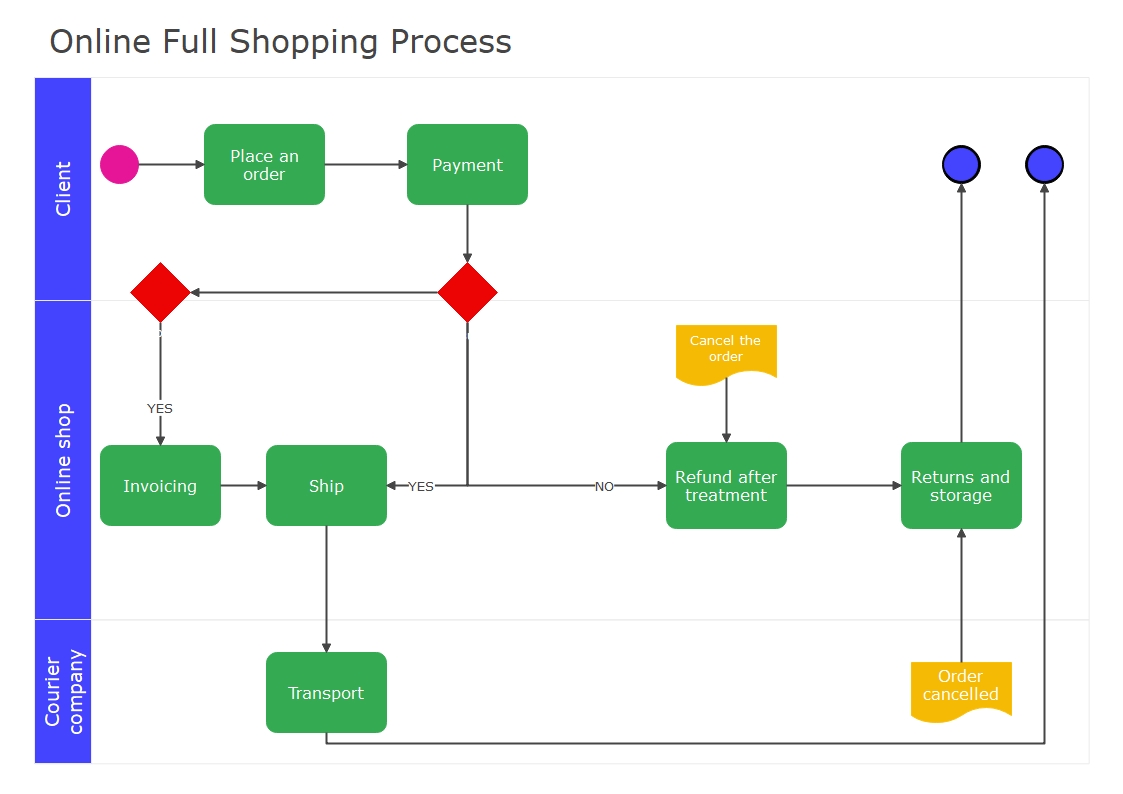
3. Swimlane Flowchart | Online Shopping Flowchart
This flowchart is designed to present the responsibilities of different staff members. A swimlane flowchart resembles the pool lanes and is used to improve accountability and clarity. The clarity is improved by the process steps within the vertical or horizontal swimlanes of a specific department, workgroup, or employee.
This chart shows handoffs, communication, and connections between different lanes. Moreover, it highlights the inefficiency and redundancy in a particular system or process. An online full shopping process flowchart drawn in Wondershare EdrawMax is shown below.
5. Examples of Data Flow Diagrams Made Using Wondershare EdrawMax
Below is a list of three examples of data flow diagrams. Look at them carefully to better understand how these diagrams serve businesses across the globe.
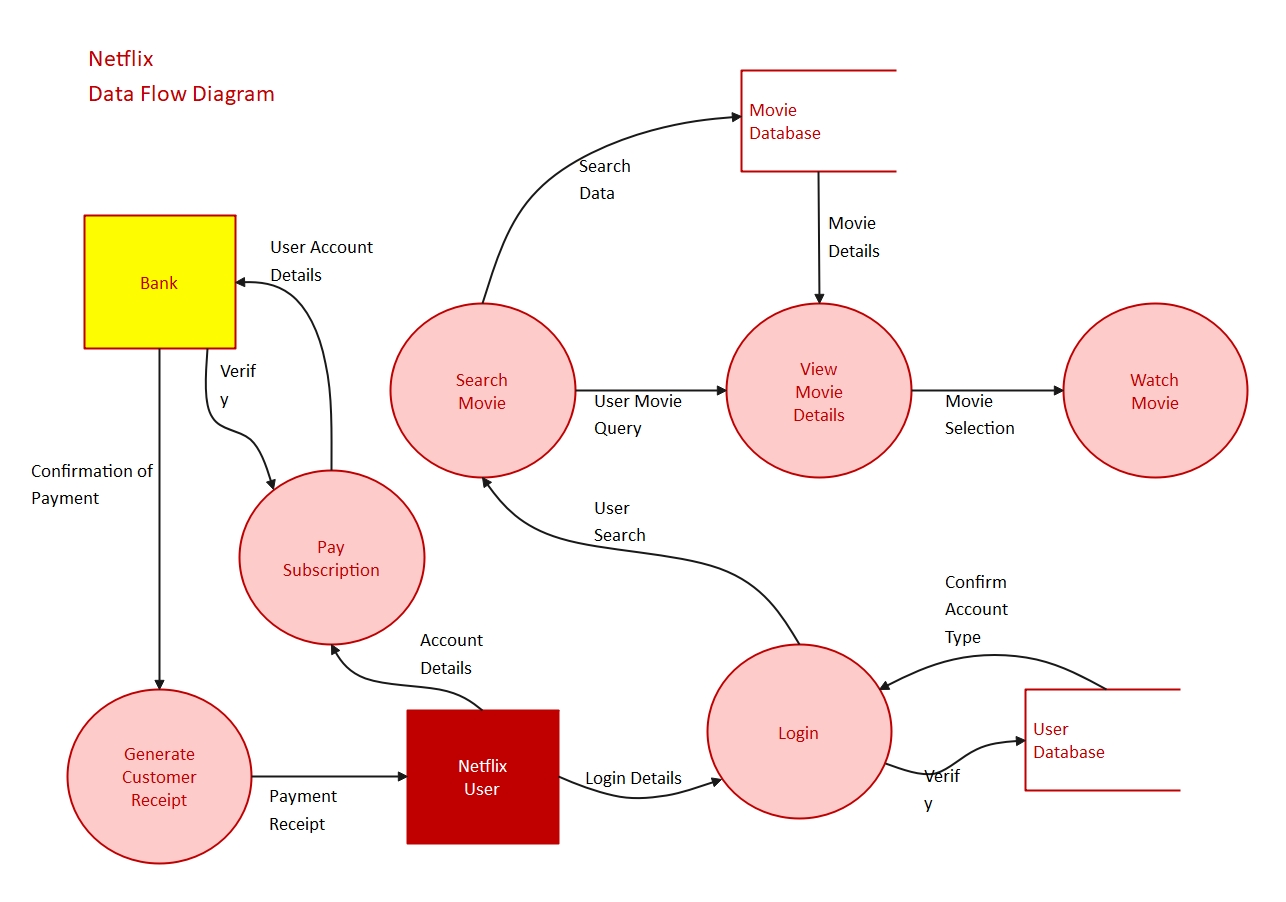
1. Netflix Data Flow Diagram
This diagram is specifically designed for Netflix, as the name depicts. It presents the flow of information for a specific system or process within Netflix, and the company collects the other data types, like search queries, the time spent on watching videos, browsing data, demographics, and the watch history of users.
A Netflix data flow diagram made in Wondershare EdrawMax is presented below. It shows everything from paying for Netflix services to logging into your account and exploring movie databases to watching your favorite videos.
2. API Data Flow Diagram
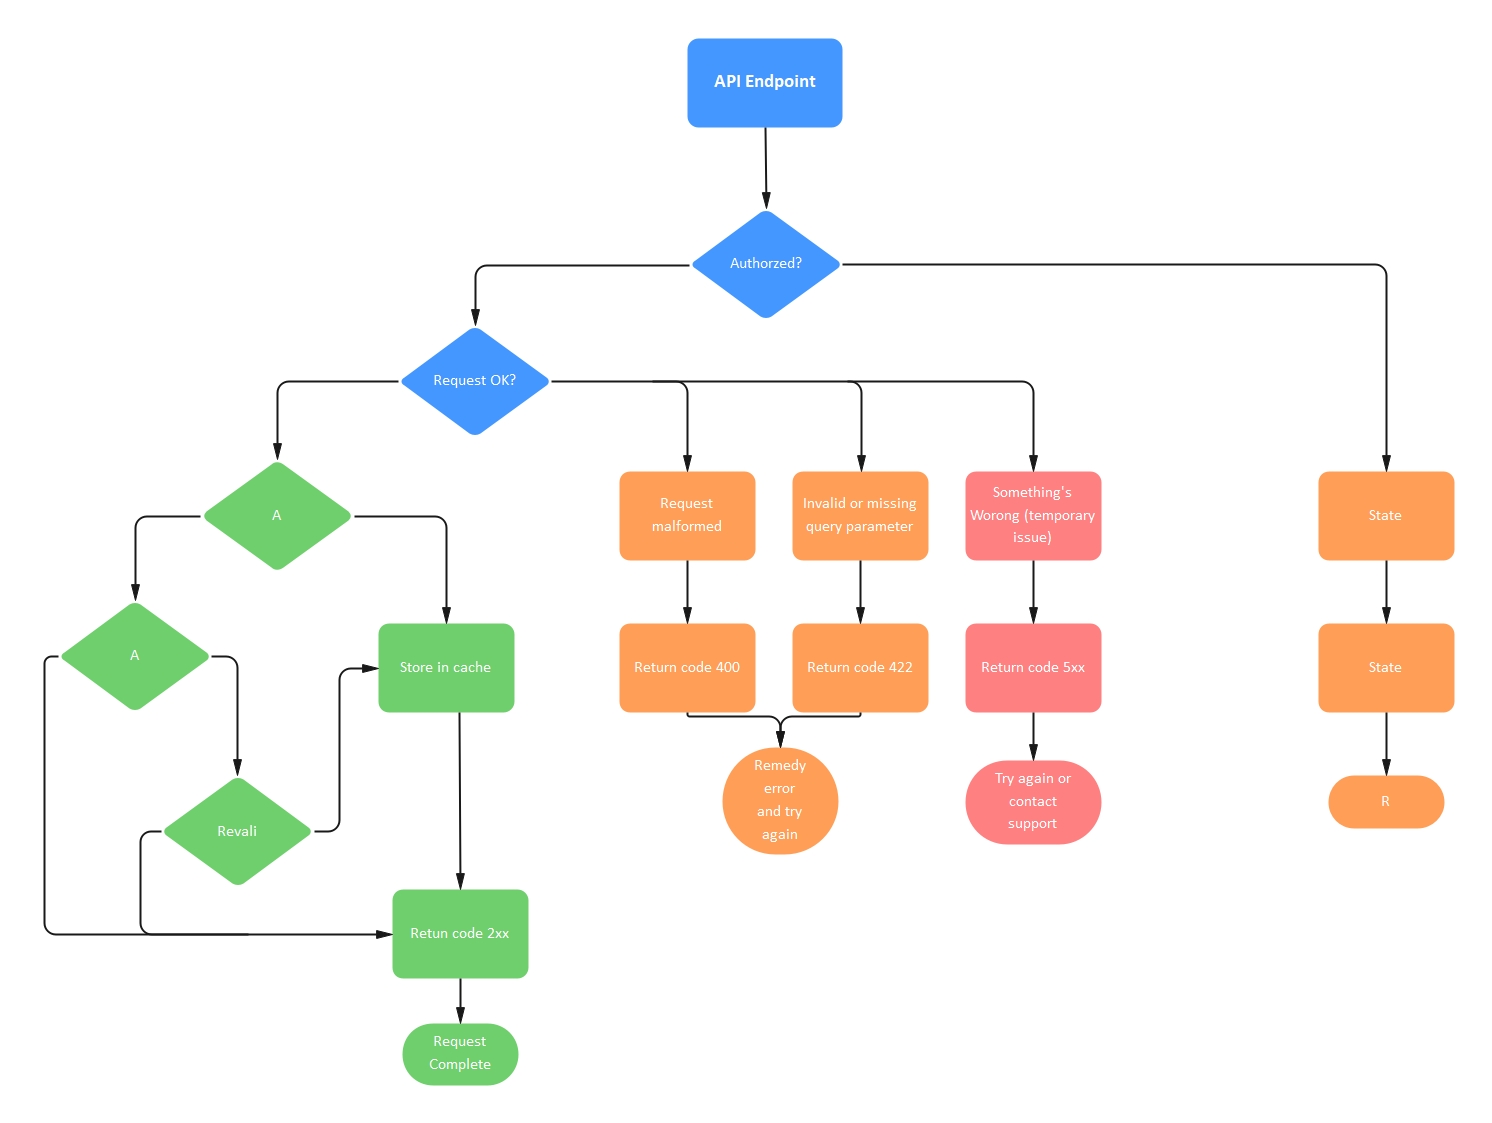
A diagram designed to clarify the behavior and structure of an API is called an API data flow diagram. It carries the protocols and routines of an API. Creating this diagram is useful for both developers and managers, as it helps them understand how the application will behave with them during the development process or usage.
A request, one or multiple actions, and an operation response are three important elements of an API’s flow. A web app or a mobile can call an API operation. This is where the flow starts. The data flow diagram of an API also presents the inputs, outputs, sub-processes, and data stores. An API data flow diagram drawn in Wondershare EdrawMax is presented below.
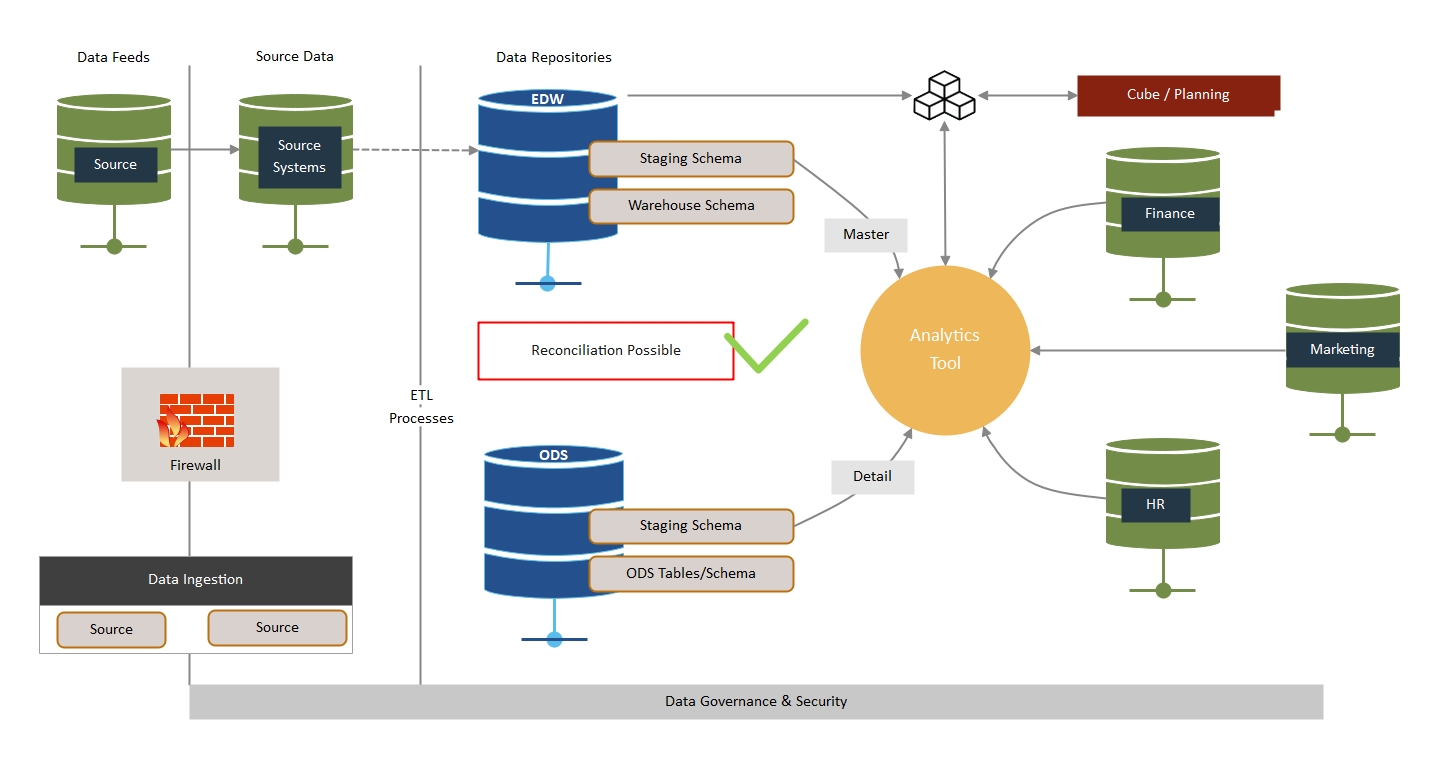
3. Warehouse Data Flow Diagram
This diagram specifically focuses on the process of inventory management and warehousing. It monitors the efficiency of customer services and evaluates the performance of warehouses of different organizations.
In addition, this diagram highlights the disconnects between business objectives and business activities and helps you fix them before it gets too late. A warehouse data flow diagram created in Wondershare EdrawMax is shown below.
6. How to Make a Flowchart Using EdrawMax?
Wondershare EdrawMax is a wonderful diagramming utility that not only enables you to create a flowchart but also assists you in creating a wide range of other diagrams, like mind maps, Venn diagrams, and process maps. The steps you need to follow to create your flowchart in EdrawMax are as follows.
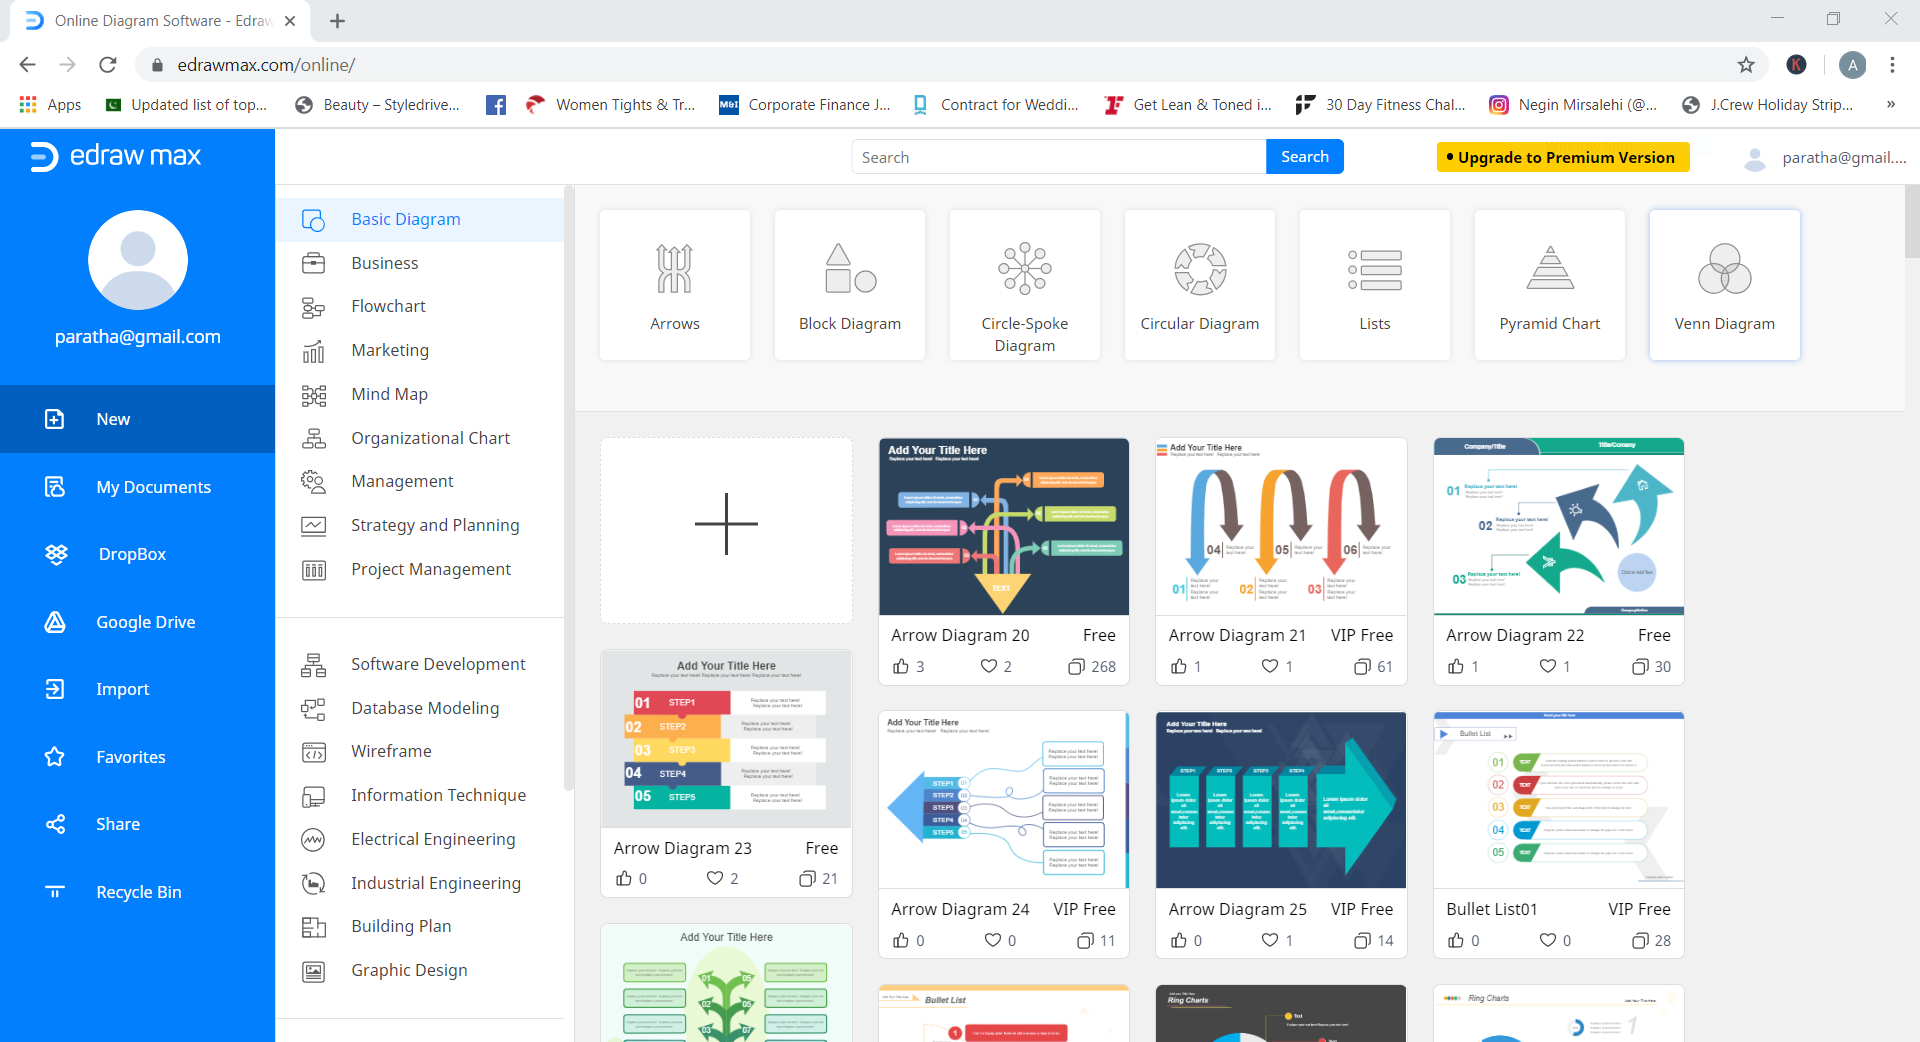
Step 1: Go to EdrawMax Online or download EdrawMax and sign in to your account. Don’t you have a Wondershare account? Not a problem! You can attach this tool to your Google account easily. On the other hand, creating a new Wondershare account is super easy too.
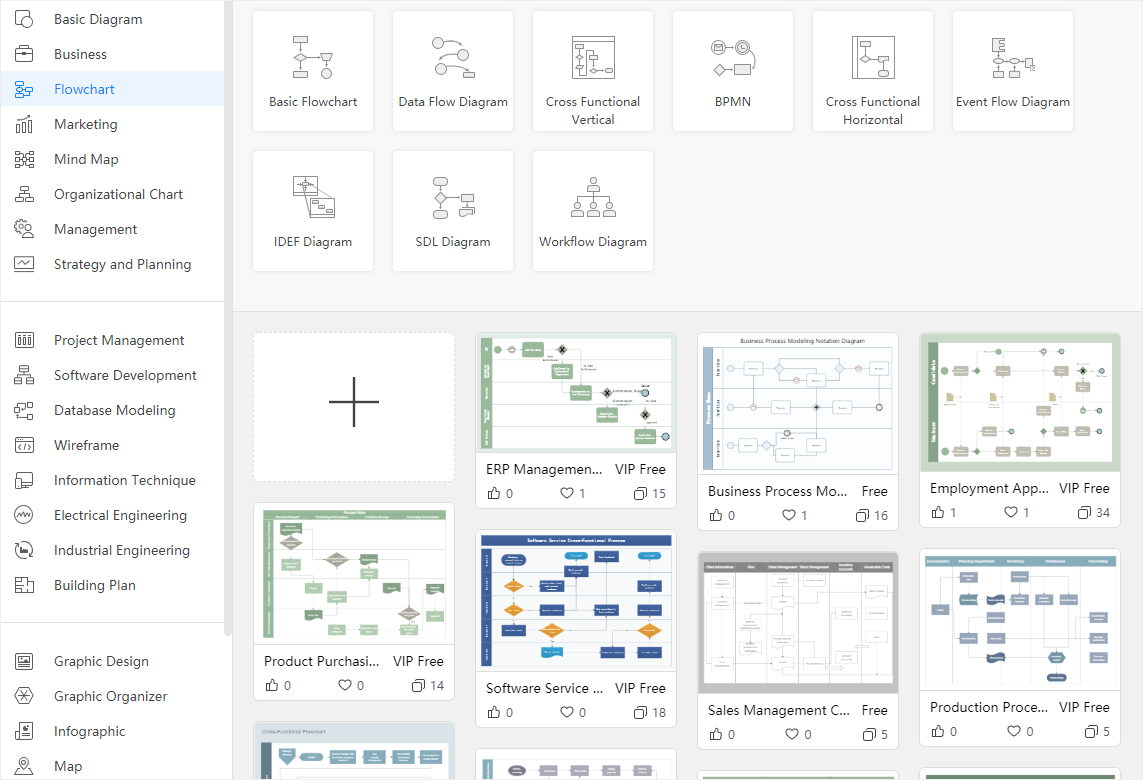
Step 2: Once you log in, tap on the “File” menu. Here, you will see a number of options. Choose “Flowchart,” as shown below. Then, select a template that suits your requirements. If you don’t want to use any template and are looking forward to creating a flowchart from scratch, hit the “+” button.
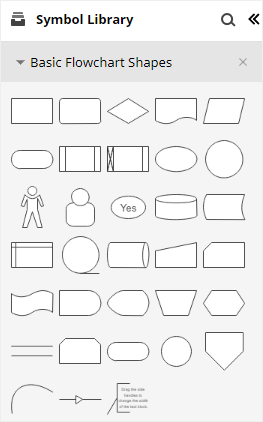
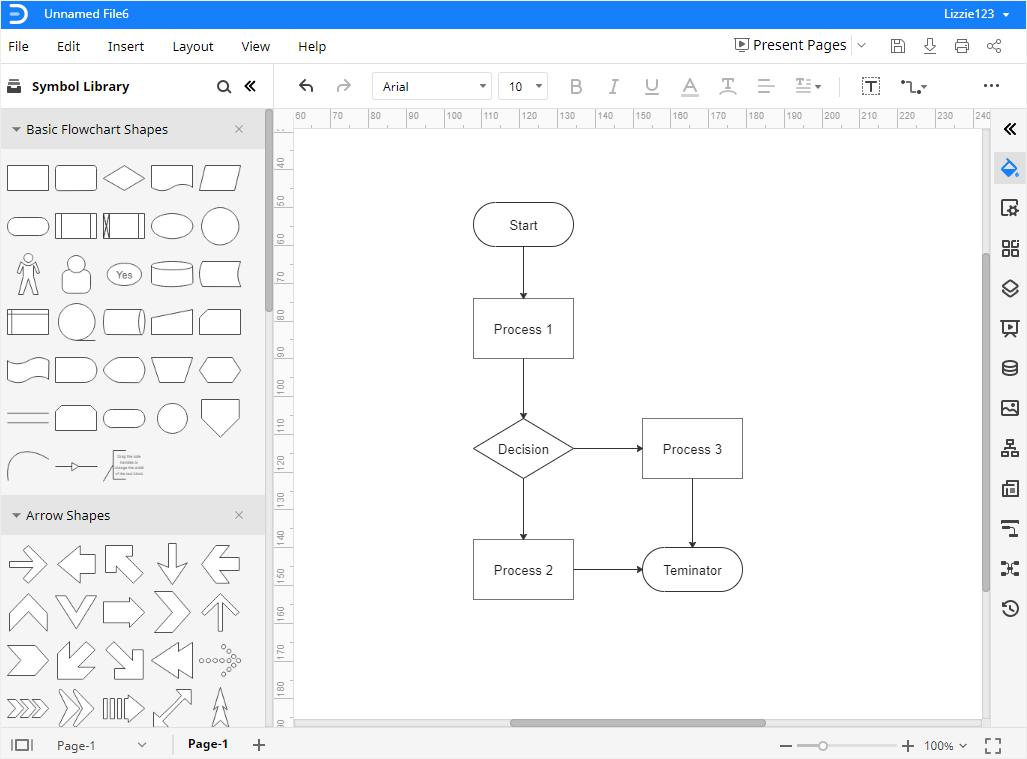
Step 3: Now, choose the shapes you need to introduce to your flowchart. For this, go to the “Symbol Library” and choose the desired shape. You will find them under the “Basic Flowchart Shapes” section, as displayed below.
Step 4: It is time to put the start and endpoints on the drawing surface in EdrawMax. For this, tap on the “Start/Terminator” symbol.
Step 5: Now, select the right “Connector” to connect the shapes with each other, including start and endpoints. As soon as you bring connectors close to the connecting points of different shapes, they will get connected automatically, making the job easier for you.
Step 6: Once you add the desired shapes and connectors to your flowchart, you will see a complete diagram on your computer’s screen, as shown below. Now, you can customize it, keeping your needs in mind.
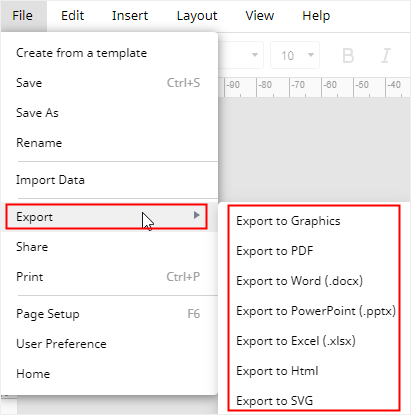
Step 7: This step allows you to export your final flowchart. For this, click on the “File” menu from the top-left corner of your windows, as shown below. Then, place your cursor over “Export.” There, you will find a number of formats, like SVG, Graphics, HTML, PDF, Excel, PowerPoint, and Word, in Wondershare EdrawMax. Select the one you want and go ahead.
Note: This video will help you create your flowchart in EdrawMax within a few minutes, as it presents a visual, step-by-step tutorial. You don’t want to miss this video at any cost.
7. How to Create a Data Flow Diagram in EdrawMax?
Do you want to make a data flow diagram efficiently? All you need is to follow a few steps listed below.
Step 1: Open any browser on your computer or laptop and launch EdrawMax Online or EdrawMax Desktop. You will see the below window on your screen.
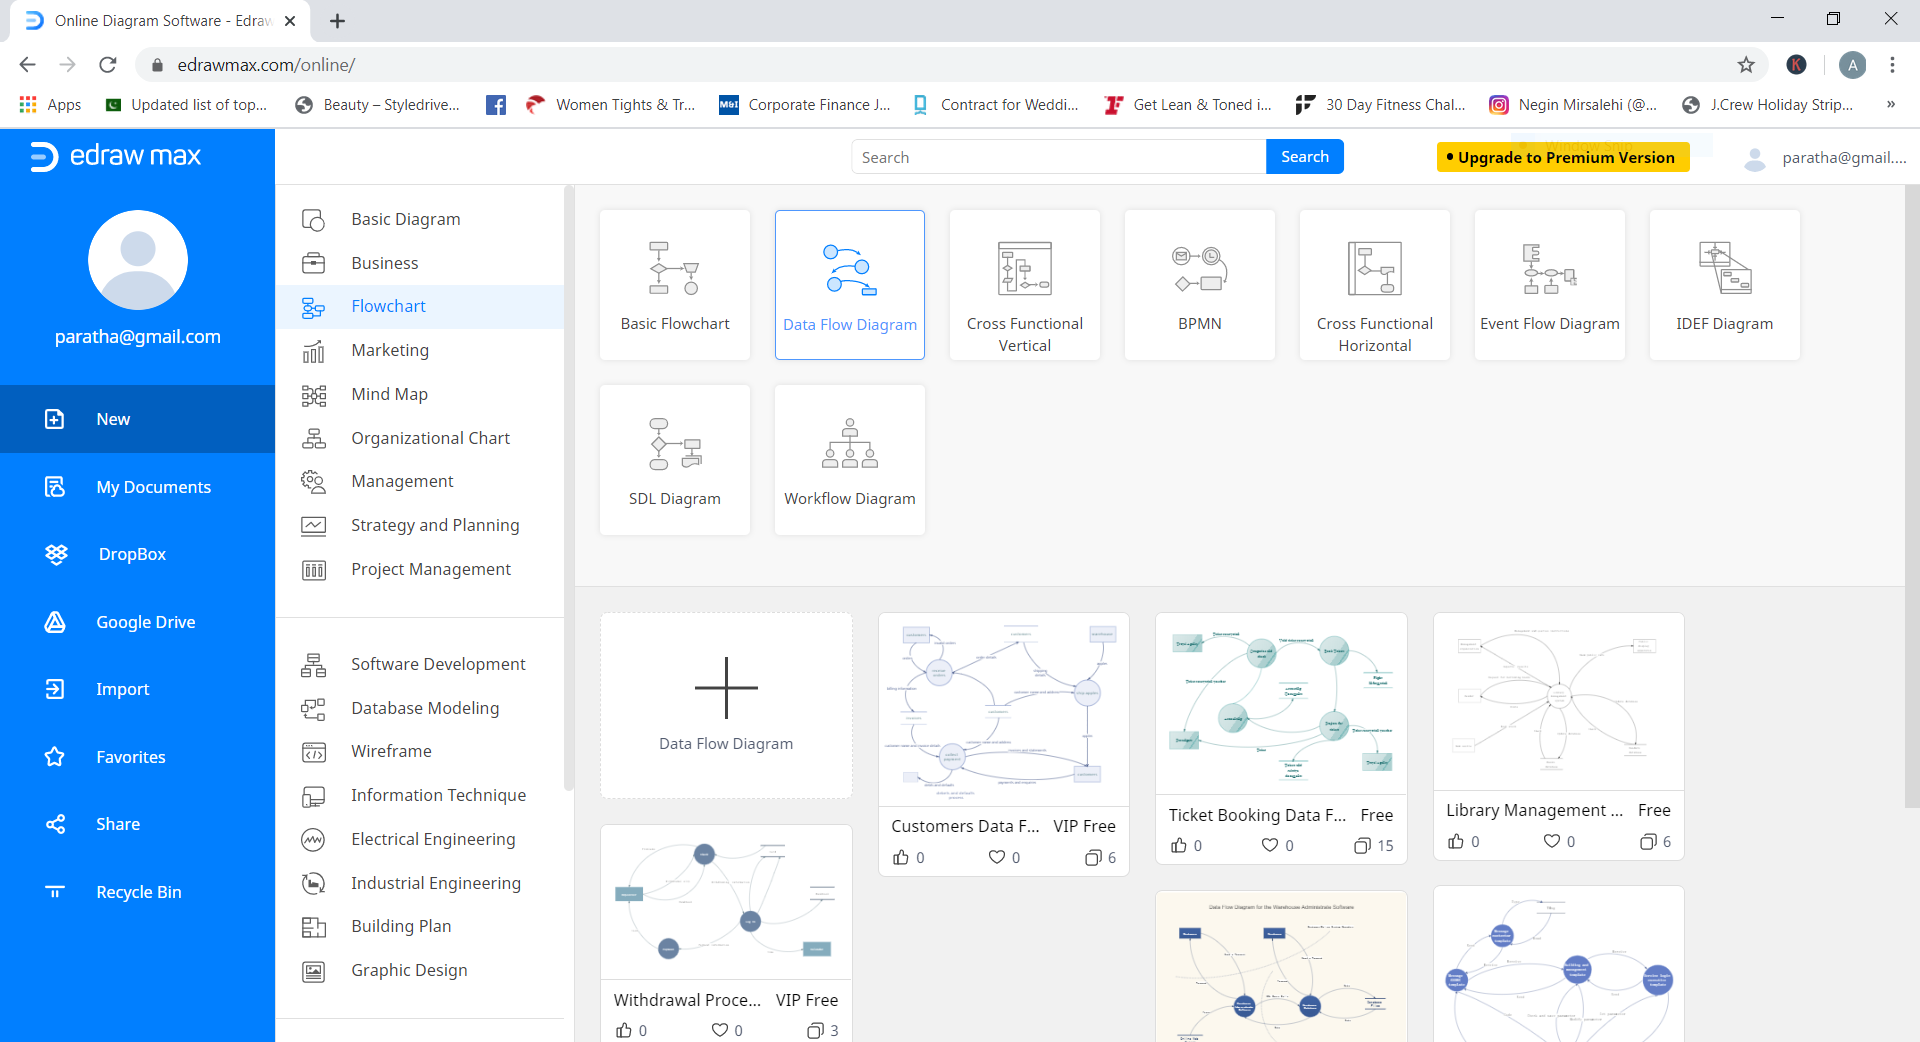
Step 2: Go to the left navigation menu, tap on “New,” and click on “Flowchart.” Then, tap on “Data Flow Diagram,” as shown below.
Step 3: You can create a DFD both with a pre-built template and from scratch. The choice is yours. Using a built-in DFD template saves you a lot of time. If you choose to create it from scratch, open the blank sheet and select the desired symbols you need to make a data flow diagram.
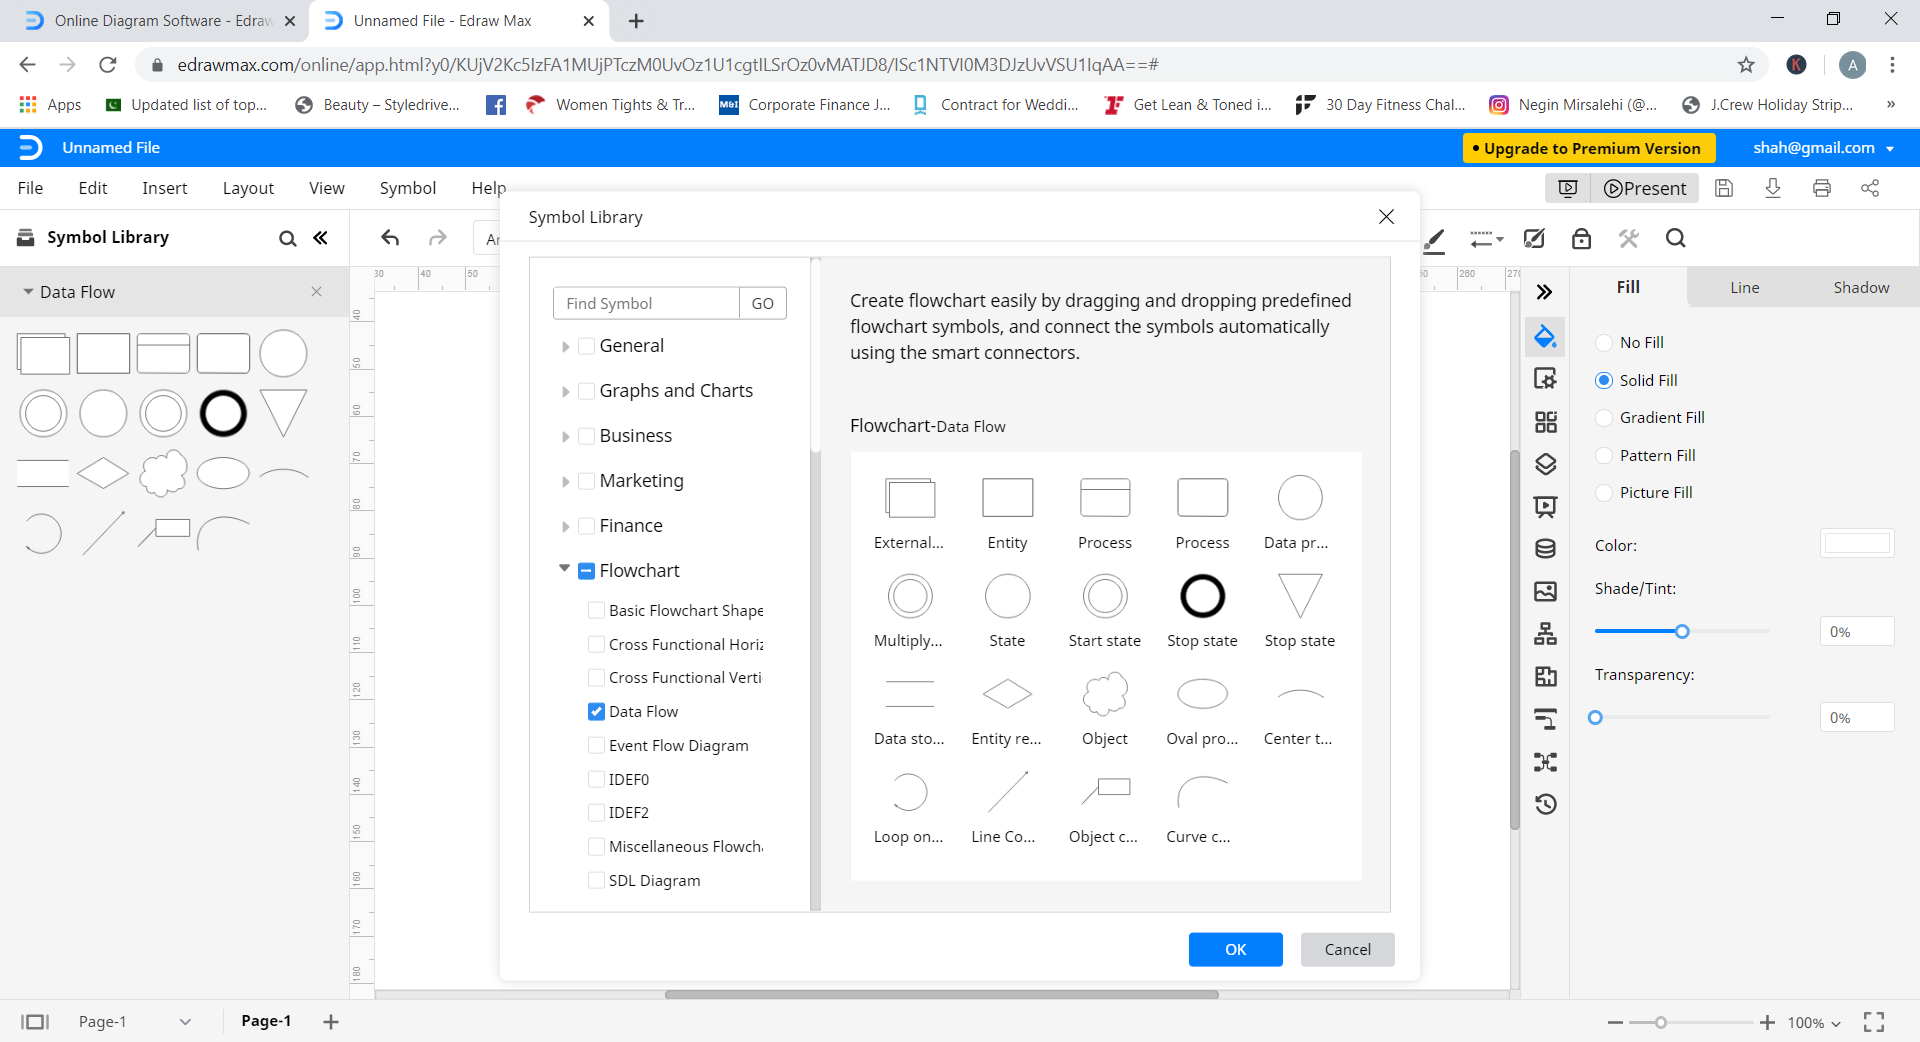
Hit the icon on the left and adjacent to the “Symbol Library.” Click on “Flowchart” and choose “Data Flow,” as shown below. Now, pick up the symbols you are looking for. Once done, tap on the “OK” button.
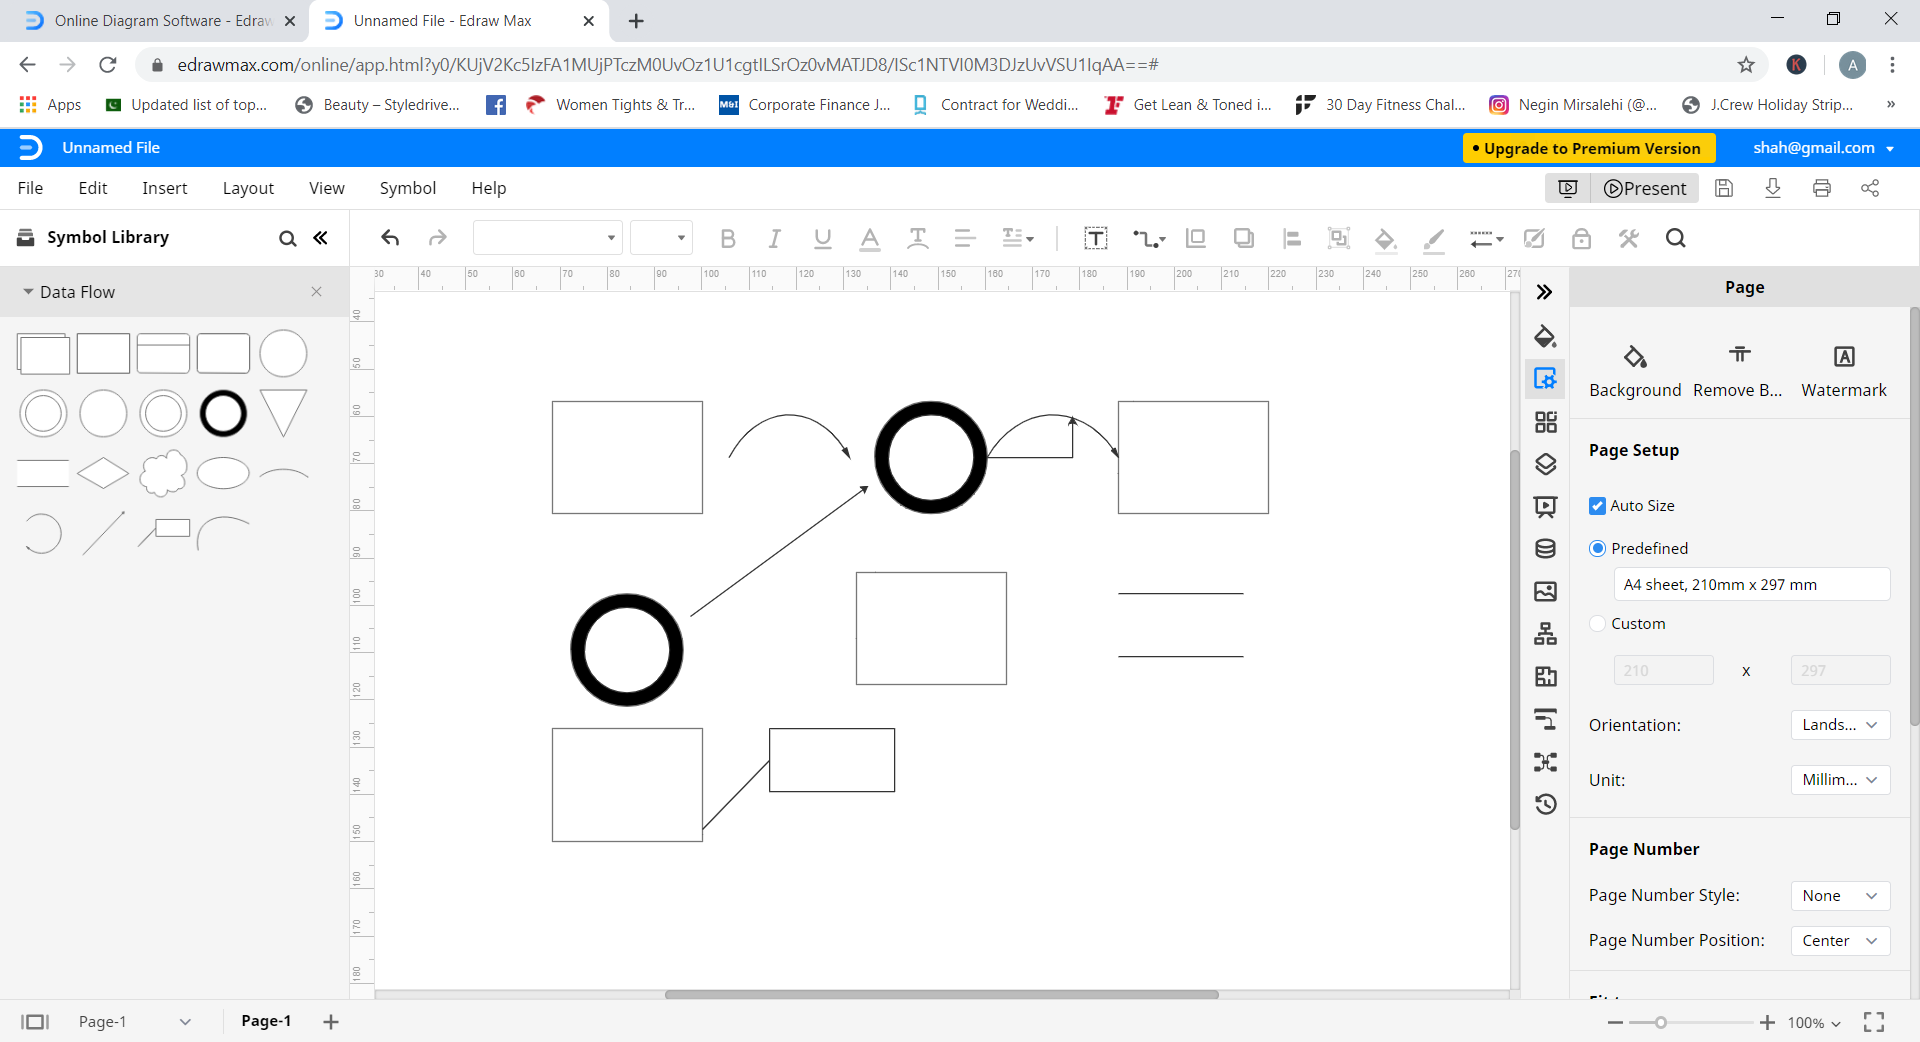
Step 4: Now, put the selected symbols on the drawing canvas and connect them to each other with connection lines to present the flow of data.
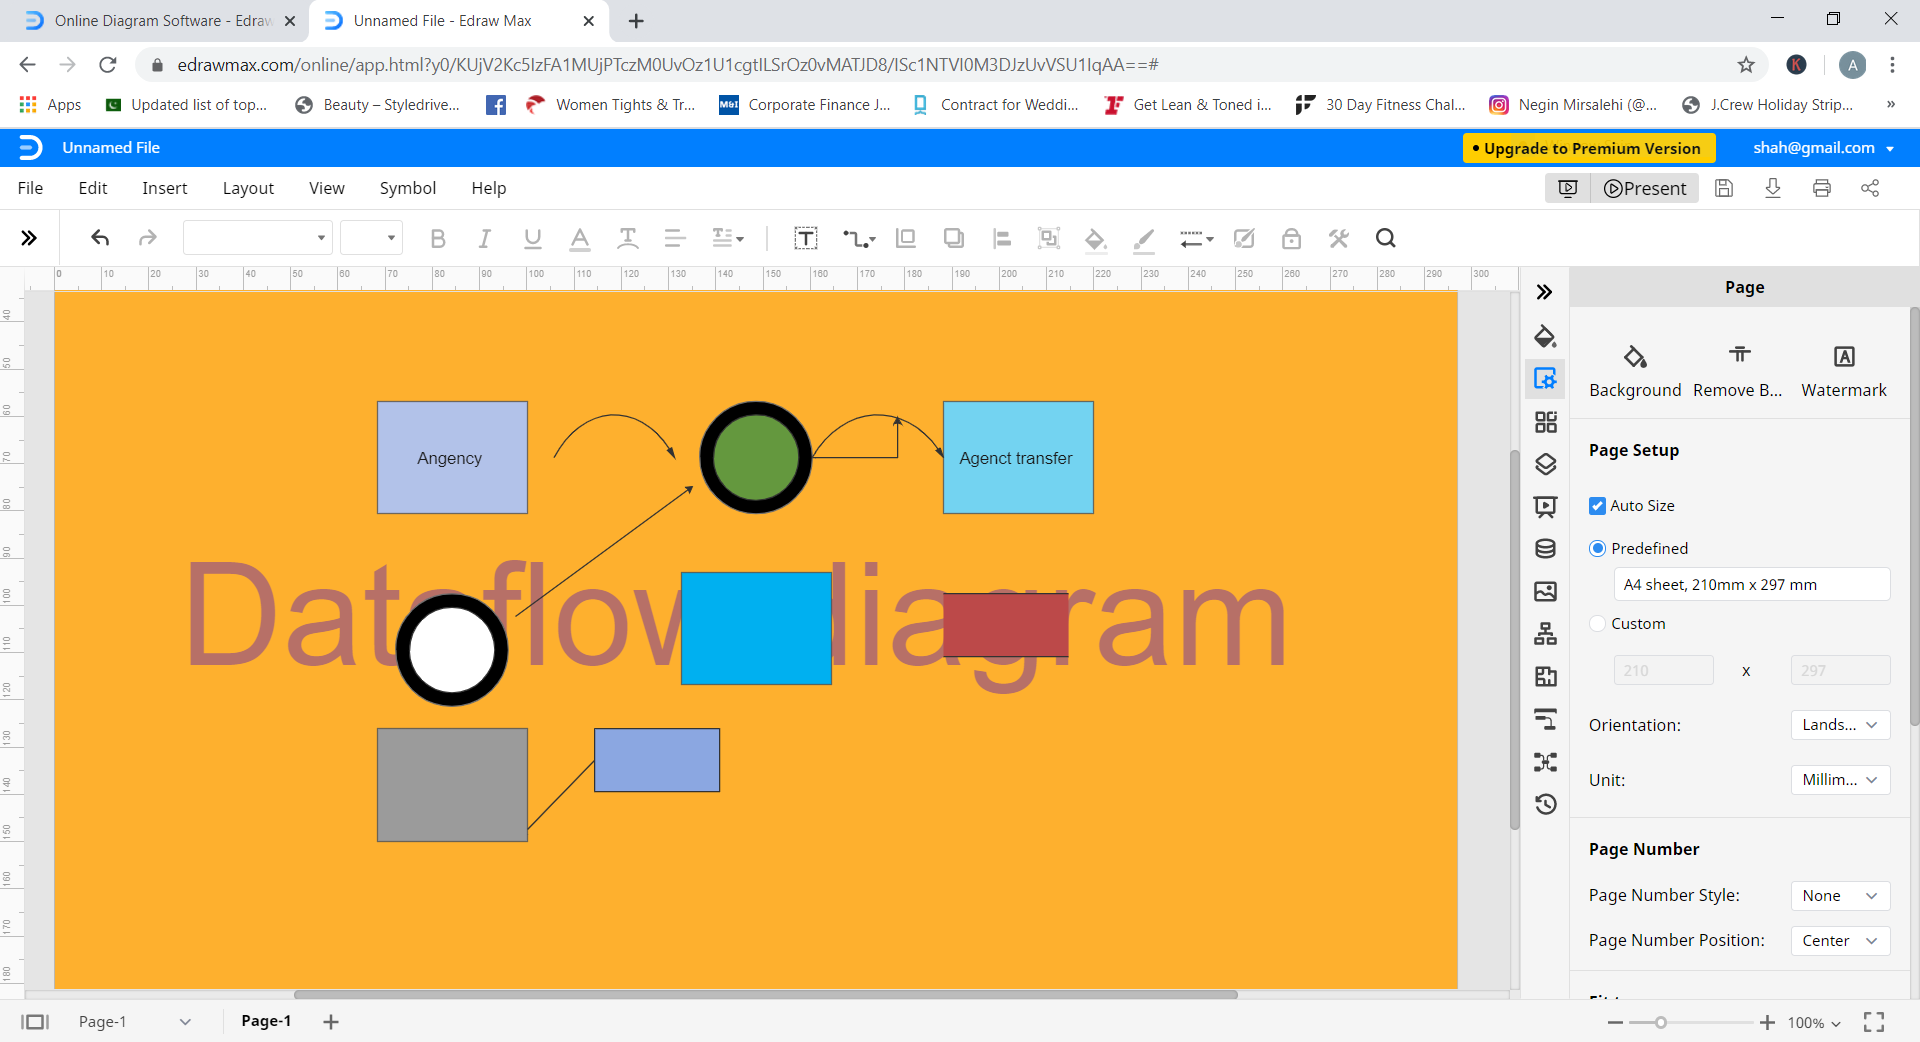
Step 5: You can now customize or format your DFD until you are satisfied with the final output.
Step 6: Once the final data flow diagram is ready, you can save and export it in different formats. For this, hit the “File” option, tap on “Export,” and choose the appropriate format.
Have you followed the above steps carefully? Congratulations! Your data flow diagram is ready.
8. Frequently Asked Questions (FAQs)
Q: How many processes should a DFD have?
A: The recommended number of processes in a single data flow diagram should be between six and nine. One DFD must have at least three processes.
Q: Should a process be connected to other processes in a data flow diagram?
A: Yes, a process should always be connected to another process in a DFD. In fact, all processes in a data flow diagram should be linked to other processes or data stores.
Q: What does a black hole mean in DFD?
A: A situation where a process has input flows with no output flows is called a “black hole” in a data flow diagram. Highlighting such situations is not a difficult task.
Q: What should be the ideal length of a flowchart?
A: Well, an ideal flowchart should be no longer than one page. Therefore, keep it concise and to the point to avoid complications. In case you have more details to put in your flowchart, you can divide it into multiple small charts and link them with each other. Doing this improves clarity too.
Q: Can I cross lines when creating a flowchart?
A: It is better to avoid crossing lines as much as you can, as it improves clarity and helps you better understand the workflow or process. However, if you can’t avoid it, you can cross lines. A number of diagramming tools introduce a small crossover bump when lines in a flowchart cross each other. It shows that one line is jumping over another. But when you use Microsoft tools to create your flowchart, you will see that they do not introduce any crossover bump.
9. Summing Up
You are now well familiar with the difference between flowchart and data flow diagram, as the discussion above has presented a couple of examples to help you understand this idea in a better way.
Are you in search of a trustworthy tool to create a flowchart or a data flow diagram? Wondershare EdrawMax will be your worthy partner for sure. You can use it online and for Windows, Mac, or Linux operating systems at the same time. With millions of active users, EdrawMax has also got some big clients (Deloitte, Amazon, Toyota, and others) that have been using its services for many years.