How to Create a Column Chart in Excel
1. How to Create a Column Chart in Excel
A column chart is a graphical representation of a graph shown in vertical bars. The column chart format helps study large volumes of categorical data in pictorial representation. Professionals mostly use the charts for presentations and meetings held for organizational purposes.
You smoothly create a column chart in Excel with any amount and category of data. It requires very few simple steps. Learn how to create the column chart in Excel with the help of the below-stated steps.
Step 1: Launch the Application and Enter Required Data in the Excel
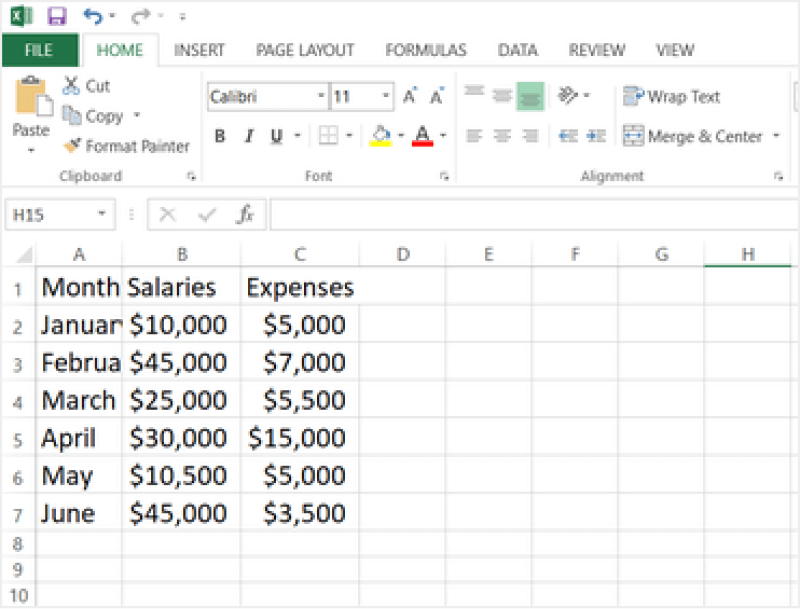
Open MS Excel to launch the application, and enter the required data in the Excel sheet.
Step 2: Insert Column Chart
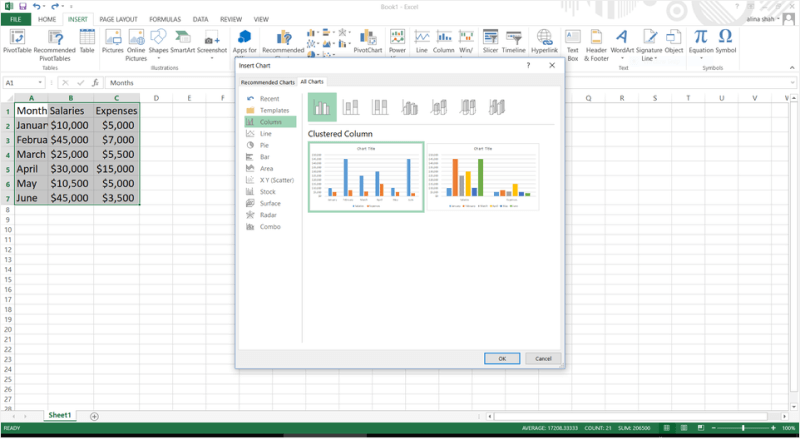
First, select the data to insert the chart. After that, go to the Insert tab, Charts section, and click the Insert Column Chart option. Select the option of vertical graphs there.
Step 3: Selecting the Desired Column Chart
Click on the drop-down arrow, and select the type of column chart you want. On choosing the More Column Charts option, a pop-up window will surface. Click the Column option in the pane, and choose the chart type. The selected column type will appear on the Excel sheet.
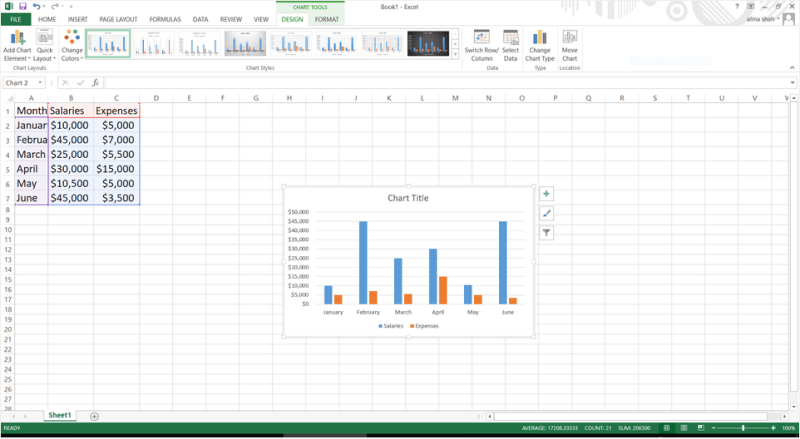
Step 4: Customize the Chart
Adjust the size, format text, add images, change colors, and customize the column chart. On altering the data, your chart will get adjusted automatically.
Step 5: Save Your File
To save the file, click on the File tab, click the Save option and enter the details, such as file location and file name. Save your Excel sheet by clicking the Save button.
A column chart can be of any type, for example, Stacked Column Chart, Clustered Column, 3-D Column, and others. But, the primary purpose of these is similar, creating a simple graphical representation of large amounts of data.
1.1 The Advantages of creating a Column Chart in Excel
A Column Chart is used to visualize any data by a rectangle, with the rectangle's height being proportional to the values. There are certain advantages of creating a column chart in Excel, like:
- Excel spreadsheets are the go-to tool for collecting and organizing data. Information can easily be placed in a neat column then sorted by the provided information type.
- With Excel, you can easily streamline all of your calculations.
- If you are using Excel to create a Column Chart, you can easily share it with your office colleagues.
1.2 The Disadvantages of creating a Column Chart in Excel
A Column Chart is basically a graph showing vertical bars representing the data. If you have opted to use MS Excel to create a Column Chart, you must have found several limitations. Some of the disadvantages of creating a column chart in Excel are:
- The primary disadvantage of creating a Column Chart in Excel is the lack of security for your files.
- To master Excel's syntax will take some time and dedication.
- Only the user's information for analysis is included in these Column Charts.
1.3 Tips for Creating a Column Chart in Excel
If you are creating a column chart in Excel to analyze and visually illustrate the data, certain tips should come in handy. For instance:
- Always choose the latest version of Excel to ensure you get the best features.
- Select if you want to create a 2-D, 3-D, or Cylindrical shaped Column beforehand.
- Ensure that the Column is selected under Chart type.
2. How to Make a Column Chart Online Easier
There is a tool EdrawMax Online that shorten your time to create a column chart online. Also, it contains substantial column chart templates in product and template community that you can use immediately and create chart without efforts.
On EdrawMax Online, you can find thousands of readily available templates and design components to create all kinds of diagrams. The best part is that EdrawMax Online can also be accessed online, letting you work seamlessly on any platform. With simple drag and drop options, you can also create visually appealing column charts via EdrawMax Online in the following way:
Step 1: Sign In EdrawMax Online
First of all, you need to log in to your EdrawMax Online account. If you haven't used EdrawMax Online before, you can sign up for a free account with your email address. Then you can use EdrawMax for free.

Step 2: Open Column Chart
Go to General tab, and find Graphs and Charts to select Column Chart. You can use a blank page to create your chart or use a free online template by Edraw. We will use a blank page to create a column chart from scratch.

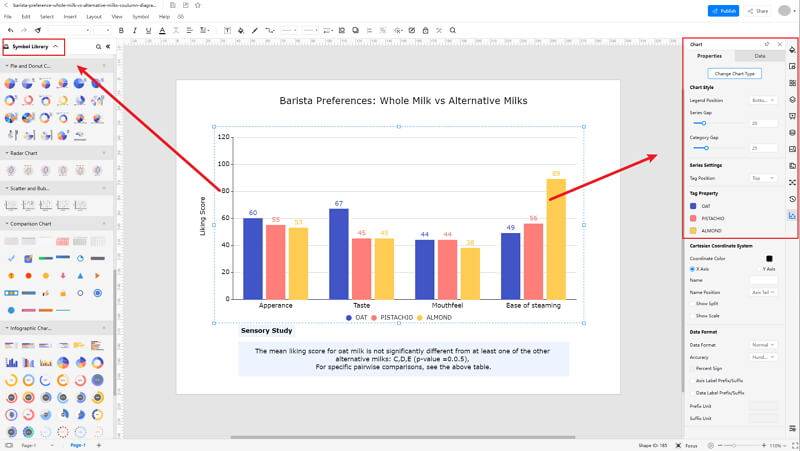
Step 3: Select the Chart Symbols
Now go to Insert Tab and click on Charts. The Insert a Chart window will appear on your screen. Scroll down to Scatter Chart and select the second option, i.e., Bubble Chart. Now press OK to insert a bubble chart. A bubble chart will be added on your Edraw page.
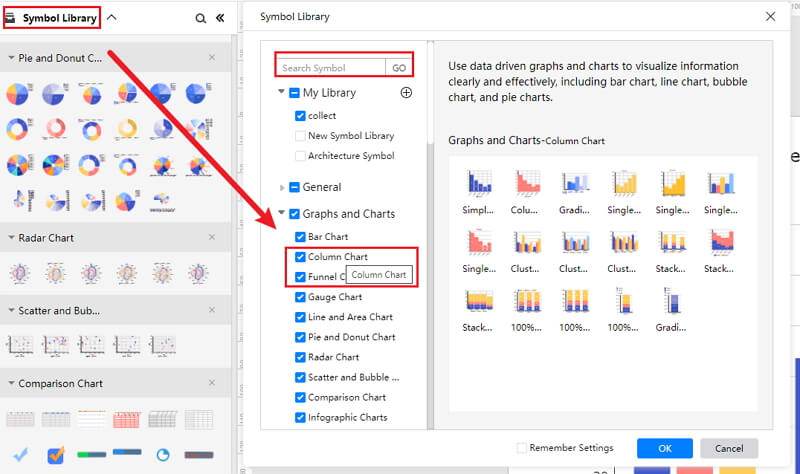
Click the Symbol Library option on the top left side of the editor window. Next, a dialogue box will open. From the dialogue box, go to the Chart menu. A pop-up menu for chart symbol categories will appear. Or you can search the bubble from the Symbol Library. Then, select this option, it will appear on the left side toolbar.
Also, you can choose to insert your data from your end, and the chart will be made automatically.
Step 4: Add More Details to Complete Chart
Once the symbols are imported to the editor window, you can drag and drop the six symbols in the editor to create your column chart using them. To edit the symbol, click in the boxes and enter your content. Likewise, you can make the boxes more attractive by using the Fill, Line, and Shadow options.
Customize your column chart excel with the help of different editing and formatting tools present in Edraw. You can change the shape, size, color, alignment, and all other details according to your preference. Many editing options are available in the navigation pane on the right side of the screen, including layers, style, theme, image, setup, property, and more. You can also use the Insert Tab and the Home tab to add watermark, pictures, QR code, etc.
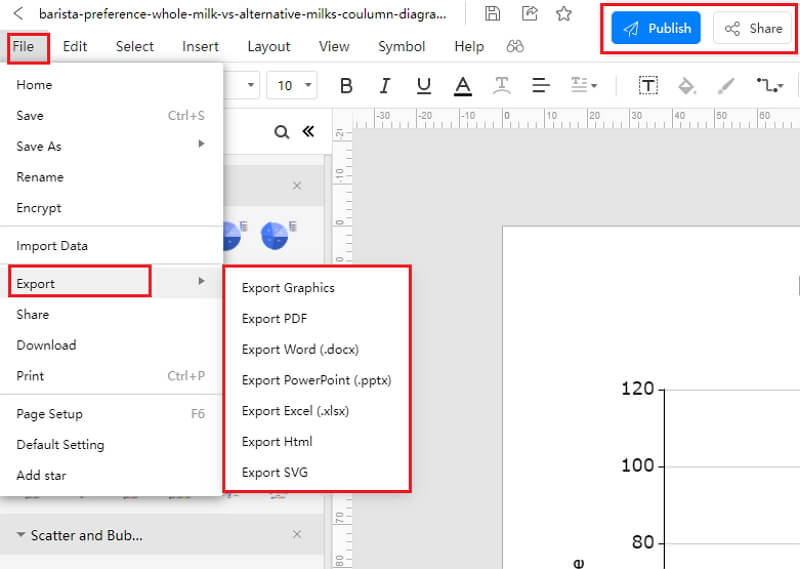
Step 5: Export Column Chart as Excel
Click on File in the top left corner, from the drop-down menu select Export. From the Export menu, select Export to Excel (.exl), and your Edraw column chart will be saved as a Excel file to your computer.
If you are still wondering how to make a bar chart in EdrawMax Online, you can check this column chart guide for reference.
2.1 The Advantages of Making Column Chart in EdrawMax Online
Compared with PowerPoint, there are many advantages that making column charts in EdrawMax Online:
- EdrawMax Online supports to make column charts online, and will be automatically saved, which means you could make charts in any where at any time.
- EdrawMax Online has a powerful Template Community, that you can find inspirations from thousands of templates made by Edraw users.
- EdrawMax Online supports to export and import multiple file formats, which ensures that you can make continue your work from other platform to EdrawMax Online, or you can export your column chart from EdrawMax Online, and attached to other files.
- Or even you can showoff your column charts with others by using Presentation Mode.
2.2 The Disadvantages of Making Column Chart in EdrawMax Online
Even though there are some advantages of using EdrawMax Online as the tool to create your column chart, certain limitations affect the overall quality of the project. For instance:
- EdrawMax Online contains limited column chart related symbols, but you can create your symbols and save them for the use of next time. However, it is good for you to make your own bar graph symbols, you can create symbols from EdrawMax, or you can import the symbols you like and save into your symbol libraries for later use.
2.3 Tips for Making Column Chart in EdrawMax Online
Creating column charts in EdrawMax Online could be easier thing than making in PowerPoint, since there are resources and powerful export function.
- Choose a built-in template from Template Community to start quickly.
- Use powerful toolbars on the right and left sides of canvas to make your column charts more stunning.
- Export your column charts in mulitple formats to meet your needs, or share to your social media, email, and print it out.
3. Excel Column Chart Templates
The followings are the column charts Excel templates, you can refer to them, or even use them immediately with ease.
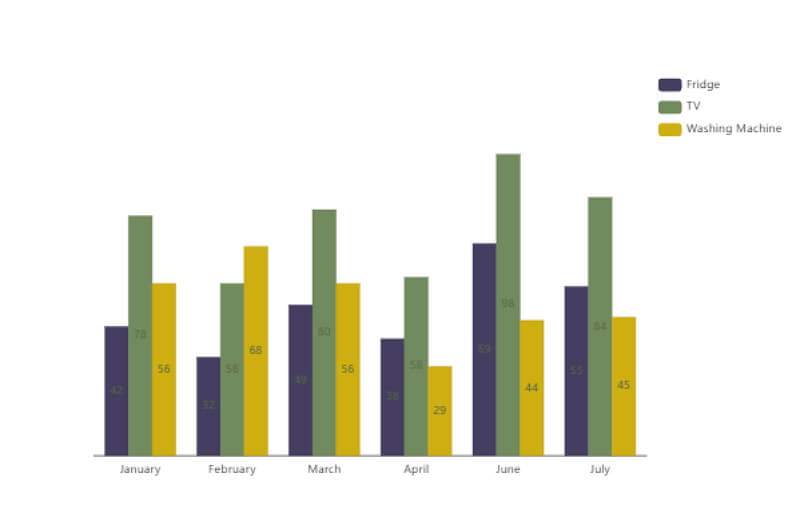
Clustered Column Chart
A Column Chart is a data visualization where each category is visually illustrated by a cylinder, as you can see in the following sales column chart, where we have shown a clustered column chart to showcase product units. Such column charts will help understand which of the home appliances are performing better than the other charts.
Source:EdrawMax Online
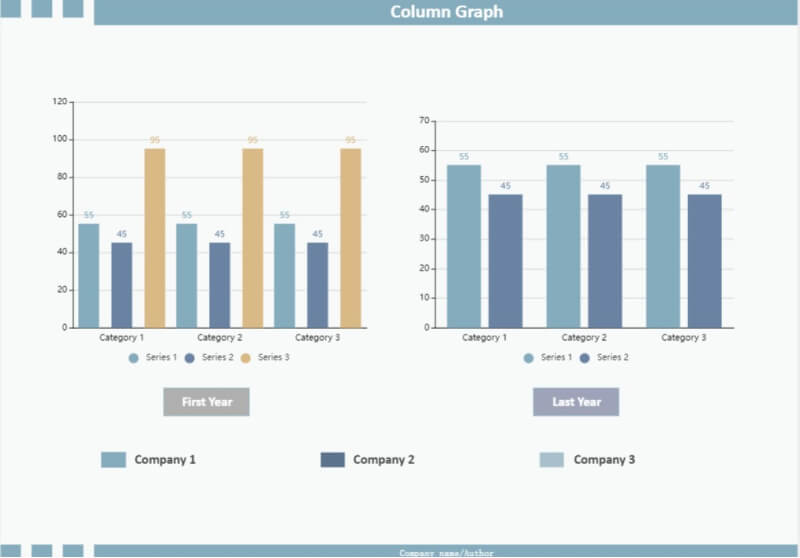
Stacked Column Chart
A Column Chart is a great way to compare statistical findings of two categories in two different years. As you can see in the column chart template below, we have taken three different entities of three companies and have compared them over two consecutive years.
As we can see in the column chart, these sorts of graphs are a great way of understanding your product's competitor, which product of yours is working in your favor, and how much your company has evolved in the last year.
Source:EdrawMax Online
Column Chart Excel
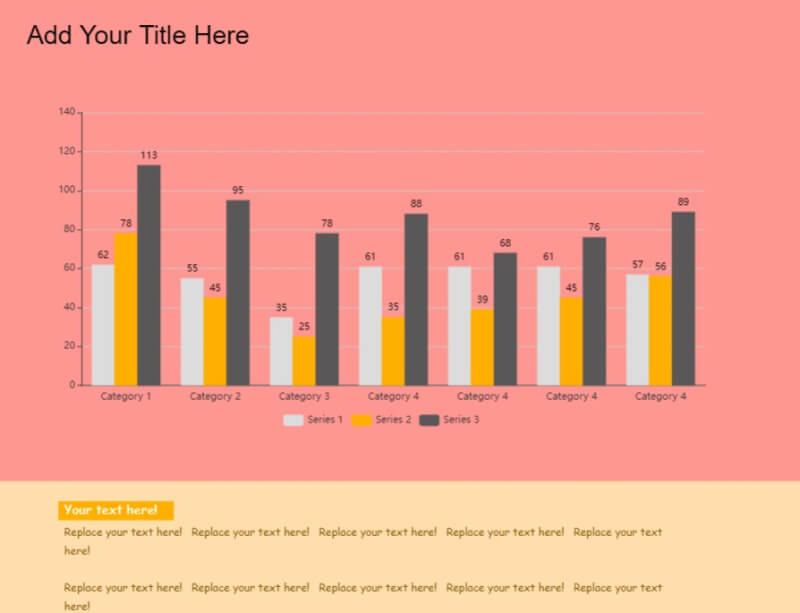
The following clustered column chart is created to compare multiple categories, each with several sub-categories. In the following column chart, we see how you can group three columns under a single category. As you can see here, such column charts are extremely helpful for statistical comparison of data.
Source: EdrawMax Online
4. Free Online Column Chart Maker
EdrawMax Online is a free online chart maker. Simply go to the Graphs and Charts section at EdrawMax Online, and you will find several column chart templates readily available for you. If you want to create a column chart from scratch, you can manually enter the data in the table or upload the CSV file right from your system, and the system will instantly convert the data into beautiful column charts.
- There are thousands of design elements in EdrawMax Online that can help you create 280+ different types of diagrams.
- You can also browse its extensive range of templates in Template Community and can readily customize them as per your requirements.
- EdrawMax Online is a free cross-platform tool that you can access on any browser and use without any prior designing experience.
- There are dedicated features to customize your diagrams and export them in numerous formats like PNG, PDF, TIFF, SVG, and more.
In addition to this, the files created in EdrawMax Online are highly encrypted and are robust. With EdrawMax Online, you do not have to worry about losing your files, as everything that you design will be instantly stored in your personalized cloud space.
5. Key Takeaways
The primary function of Excel is to create spreadsheets for small to large enterprises. It does create column charts, but several restrictions will make you look for another tool. Unlike Excel, EdrawMax Online is fully-equipped with the right designing tools that ensure you do not have to go and find different tools to create different types of chart diagrams. With EdrawMax Online, you can also easily create Horizontal Bar Graphs, Grouped Bar Graphs, Infographic Bar Chart templates, and more.
At the same time, unlike Excel, which lacks templates or is dependent upon third-party tools, EdrawMax Online has a vast template community. This template community is created by our 25 million registered professional users. So there will never come a day when you do not find a template you are looking for!


