FlowChart vs. Process Map: Understanding the Difference & How to Draw Them?
Along with helping you understand the difference between a process map and a flow chart, this article assists you in drawing these diagrams using an incredible tool.
Exploring a large amount of data to understand the business process and standards, without a doubt, is a super challenging task. This is where visual content comes in handy. When it comes to presenting a business process in an easily understandable way, flowcharts play a crucial role. These charts have become an important part of almost all businesses operating across the globe.
Flowcharts and process maps are closely related to each other, which is why millions of people often search for the debate on a process map vs. flowchart. Are you looking for the same? If yes, reading through the below discussion will help you understand what a process map and flowchart are.
1. What Is a Process Map?
A tool designed to provide you with a visual representation of different actions, inputs, and outputs of a process is commonly called a process map. These actions are outlined in a clear and sequential manner to provide a better understanding.
 below.
 A process map lends you a helping hand in a couple of ways. It enables you to understand any process in an easy way and assists you in identifying where improvements are required. It breaks down a process into multiple steps and helps teams improve their communication abilities.
Apart from that, you can use a process map to document your processes to standardize your workflows. Moreover, it enables you to plan your upcoming projects and organize them in a better way. Furthermore, you can visualize every stage of your process to make sure you have the right resources to achieve the desired goal.
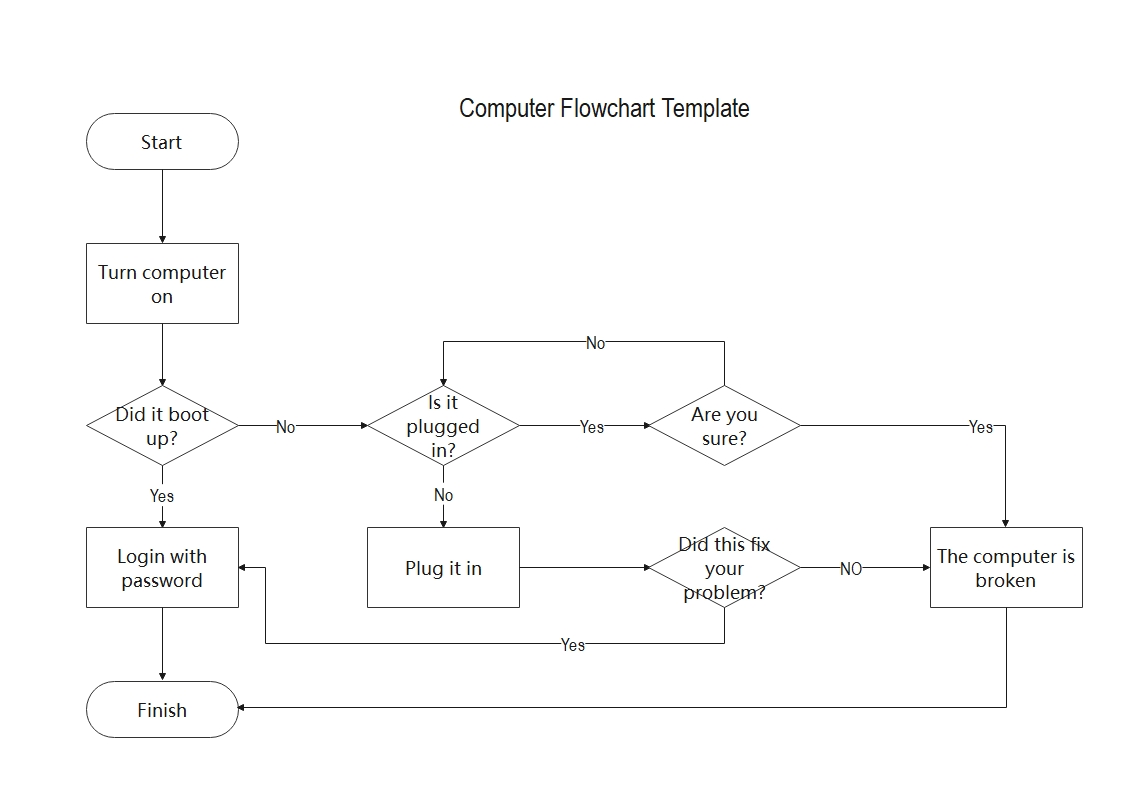
2. What Is a Flowchart?
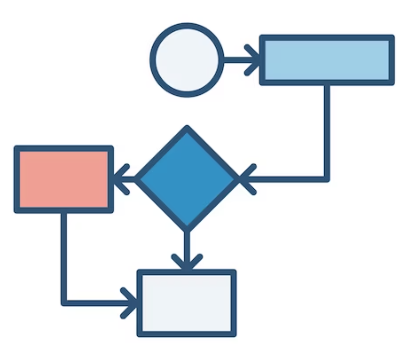
A diagram consisting of different shapes or boxes linked with arrows is known as a flowchart. Every box or shape carries a specific text to show a particular step involved in a workflow. Usually, a flowchart follows a top-down approach, which means the process starts from the top and ends at the end. But following this approach is not necessary for all flowcharts.
A flowchart mainly focuses on maintaining a sequential order when presenting a step-by-step workflow. The best thing about using a flowchart is that you can clearly visualize every step of the process. In simple words, this diagram makes it very easy for you to understand complex processes. In addition, highlighting the mistakes and fixing them on time is made easier with the use of visual components in flowcharts.
Flowcharts use different symbols (diamond, oval, rectangle, etc.) to show the type of step and arrow to present the flow of the process. These diagrams are equally beneficial for both technical and non-technical professionals.
Now that you are familiar with what a flowchart and a process map are. Let’s now get into the details of the differences between them.
3. Process Map vs. Flowchart: How Are They Different from Each Other?
There is a common perception that the terms “process map” and “flowchart” can interchangeably be used. But it is not the reality. Though they share a number of common characteristics, they have some notable differences at the same time.
As far as flowcharts are concerned, they break down the complex process into different steps to make it easily understandable. On the other hand, you can get much more details with a process map. Moreover, a process map also comes with a timeline, which means you can get an idea of the time required to complete every step and the whole process.
You can use process maps and flowcharts for the same target audience, except when you need a detailed outline. In simple words, if you want to present a complete timeline to define the timeframe for every step of the process, there is nothing better than using a process map. A flowchart will not do well in this case, as it does not contain any timeline.
4. Examples of Flowcharts Created in Wondershare EdrawMax
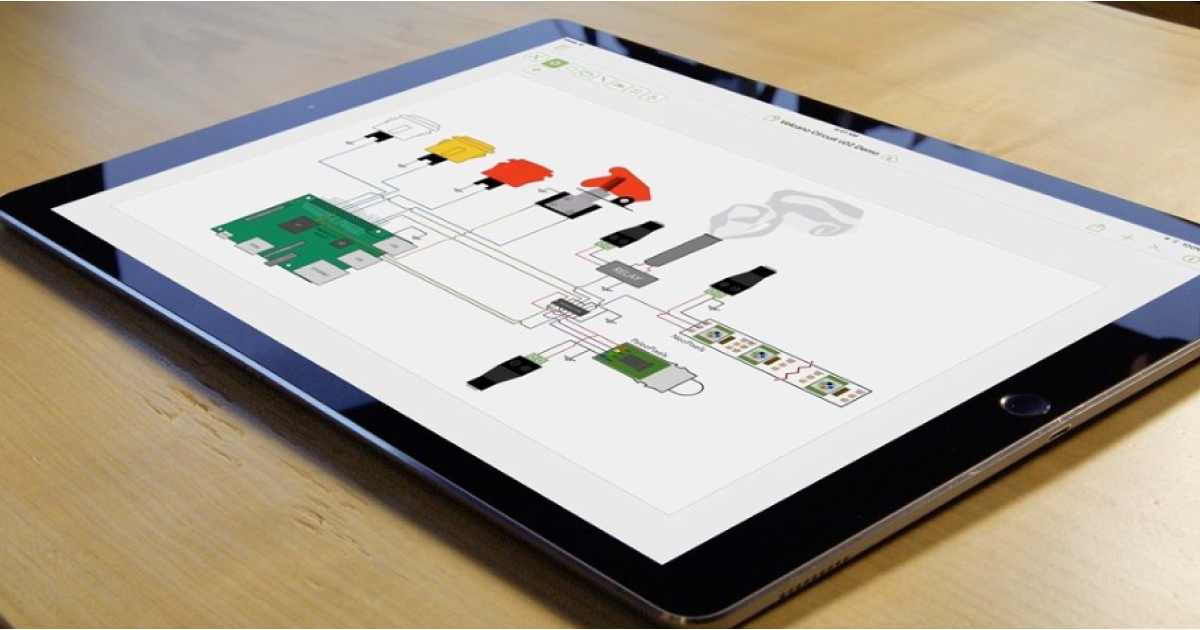
Wondershare EdrawMax is an excellent tool for creating unique, engaging, and effective flowcharts. Three different flowcharts created with this utility are listed and explained below.
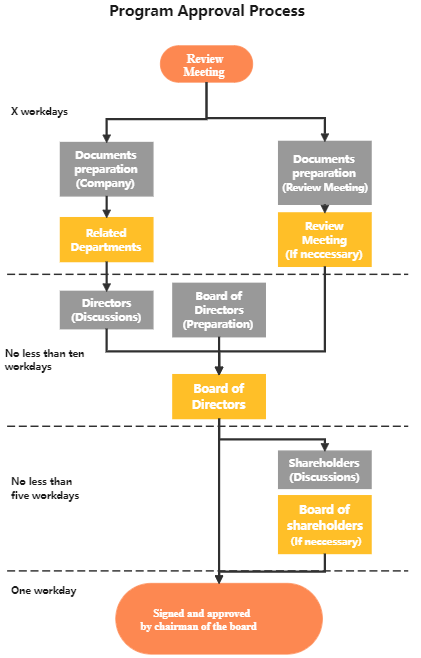
1. Engineering Flowchart
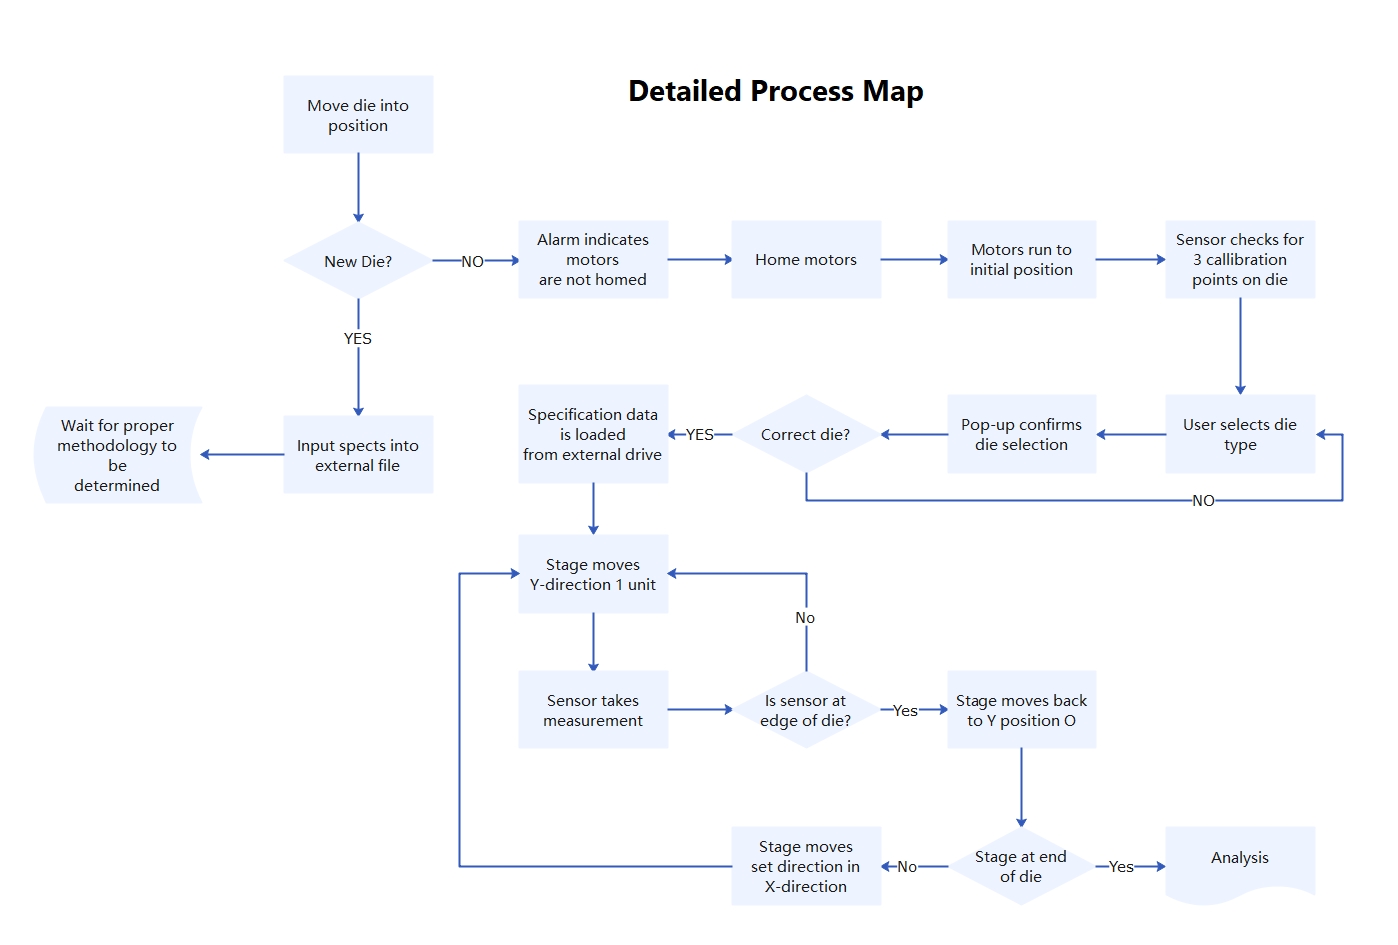
As the name depicts, a flowchart that presents various steps of an engineering process in a sequential order is called an engineering flowchart. It also carries the decisions required to carry out the whole process successfully. Arrows are used to indicate the direction of the workflow.
This chart helps stakeholders understand the logical flow of the engineering process. An engineering flowchart created in EdrawMax is presented below. It starts with a “Review Meeting” and ends when the chairman of the board signs and approves the process.
 below.
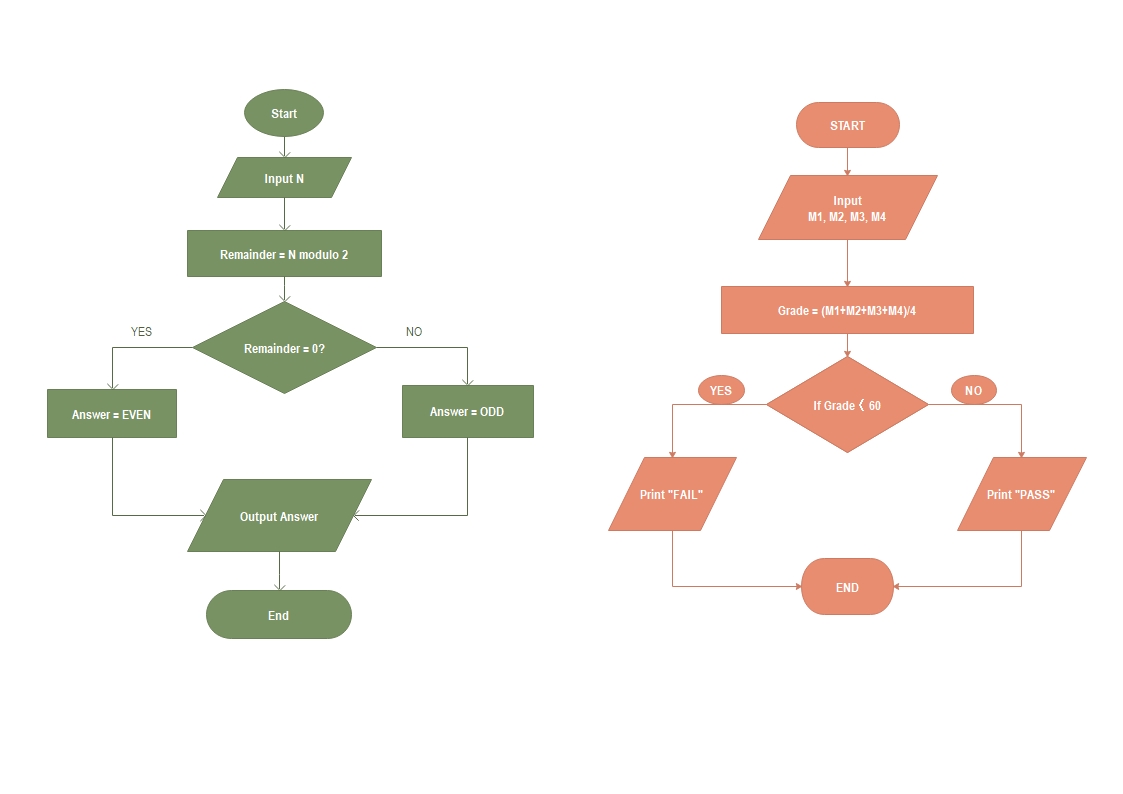
 2. Algorithm Flowchart
A flow chart depicting the step-by-step process of an algorithm is named an algorithm flowchart. Generally speaking, flowcharts and algorithms are two different tools. You can use both of them to create a new program. This chart is specifically beneficial for computer programming, as it presents a graphical representation of every step involved in a computer program, making it easy for everyone to understand the complete program. An algorithm flowchart made in Wondershare EdrawMax is presented below.
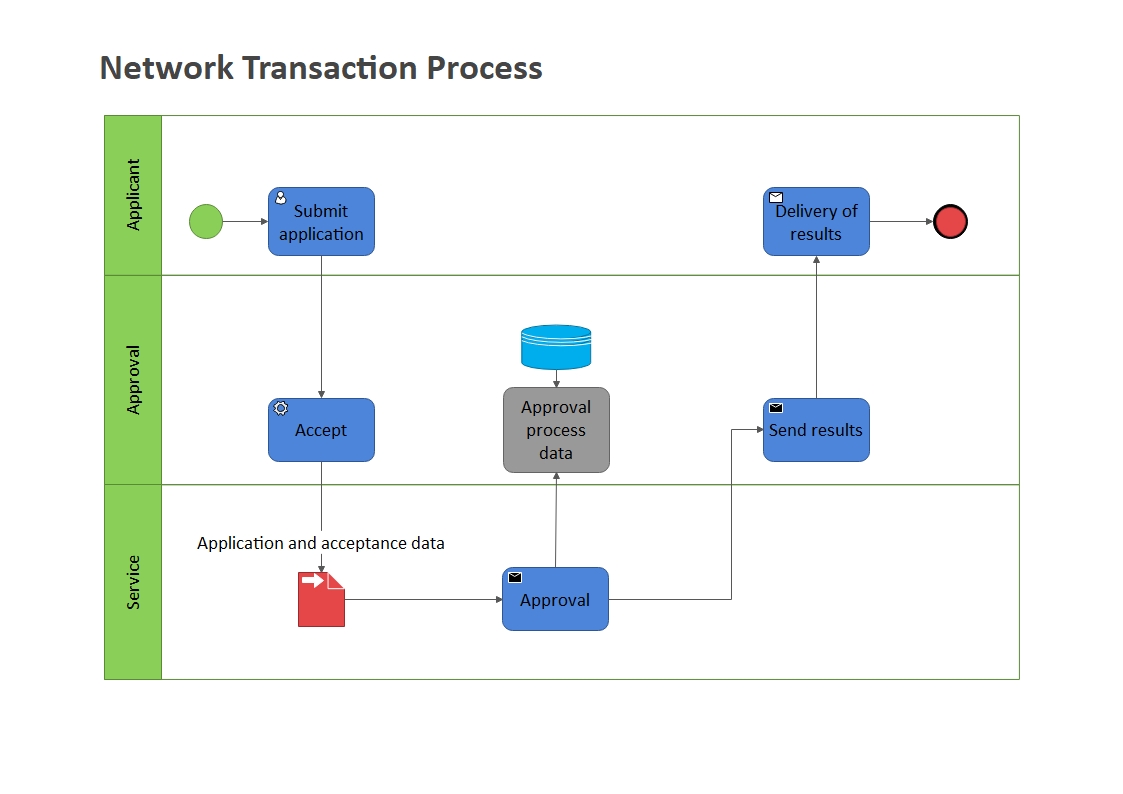
3. IT Network Flowchart
This chart serves Information Technology-based businesses. IT teams can use an IT network flowchart to optimize a network system or create a new software program. In addition, this diagram helps IT teams maintain smooth and effective communication throughout the task. Moreover, it indicates the flow of data and the nodes where data gets processed or stored. An IT network flowchart created in Wondershare EdrawMax is displayed below.
5. Examples of Process Maps Made Using Wondershare EdrawMax
It is time to go through a few examples of process maps created in EdrawMax to provide you with a clear picture of this idea.
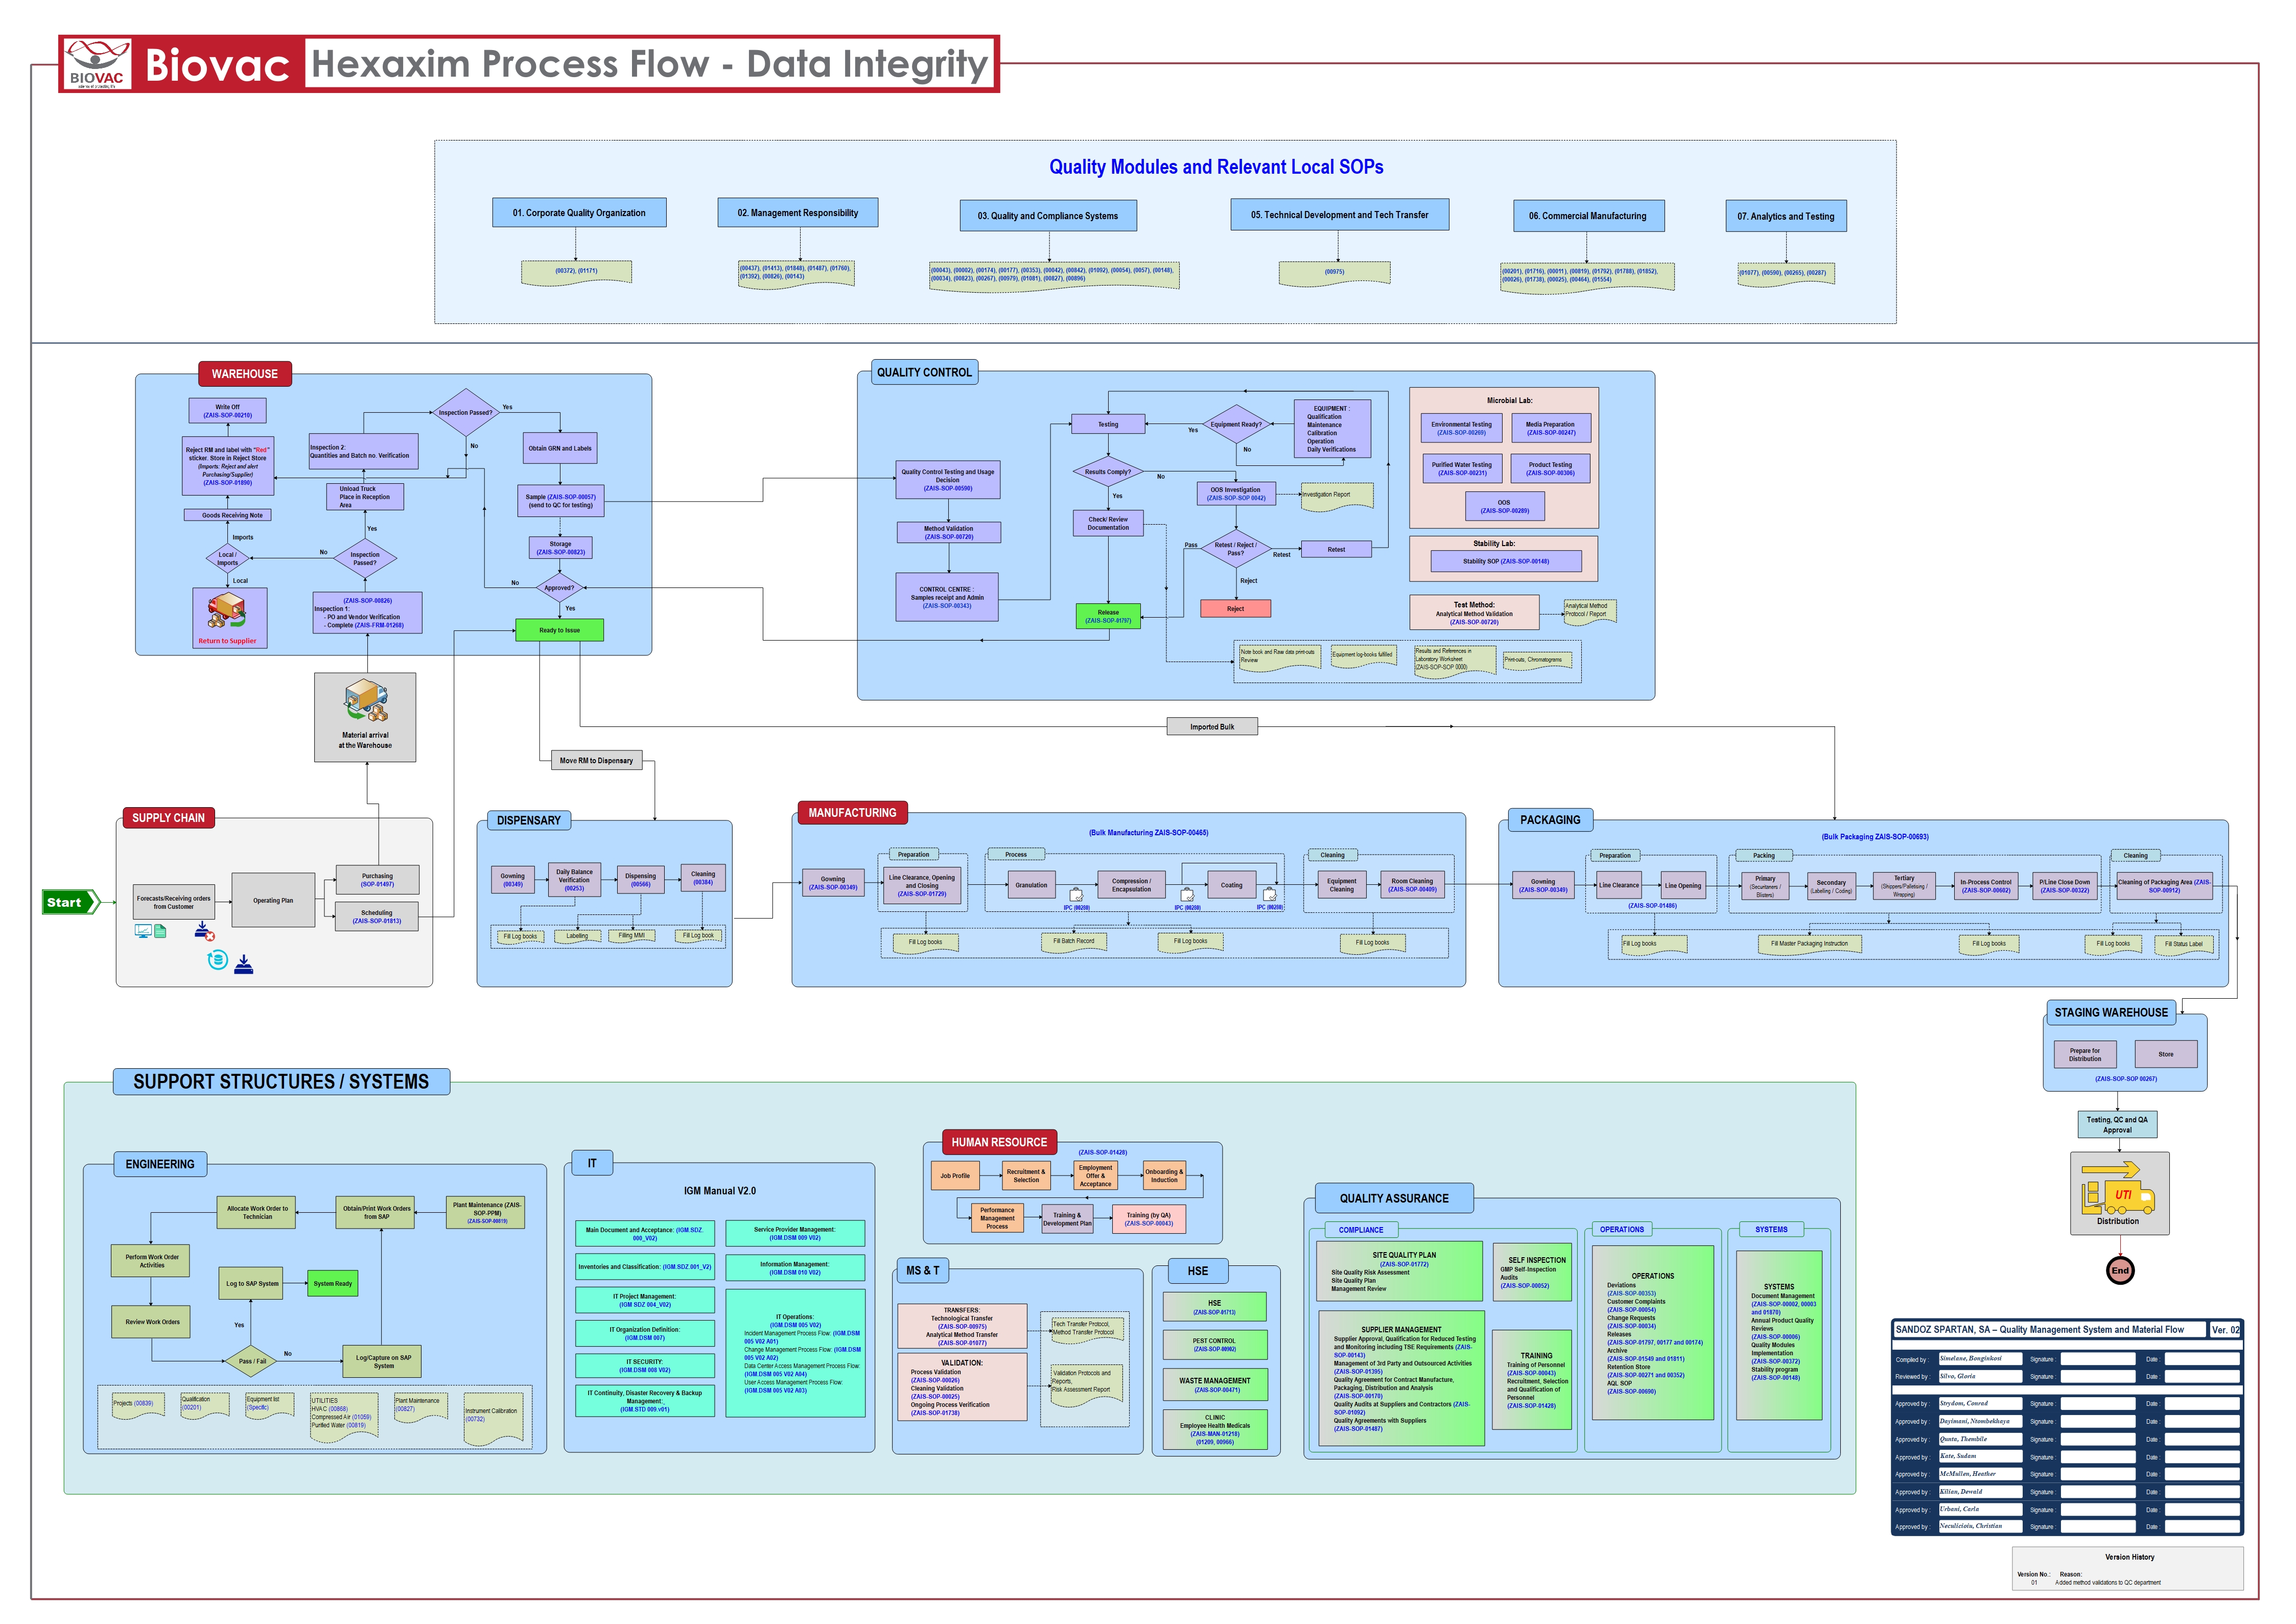
1. Product Process Map
Process maps are a crucial part of the manufacturing industry. As far as a product process map is concerned, it presents the sequence of steps or events required to manufacture a particular product. With this diagram, you can understand and visualize every stage of the manufacturing process clearly.
As an example, a product process map created in Wondershare EdrawMax is shown below. It consists of all departments that are associated with the manufacturing process directly or indirectly. These departments include supply chain, warehouse, quality control, packaging, and human resources.
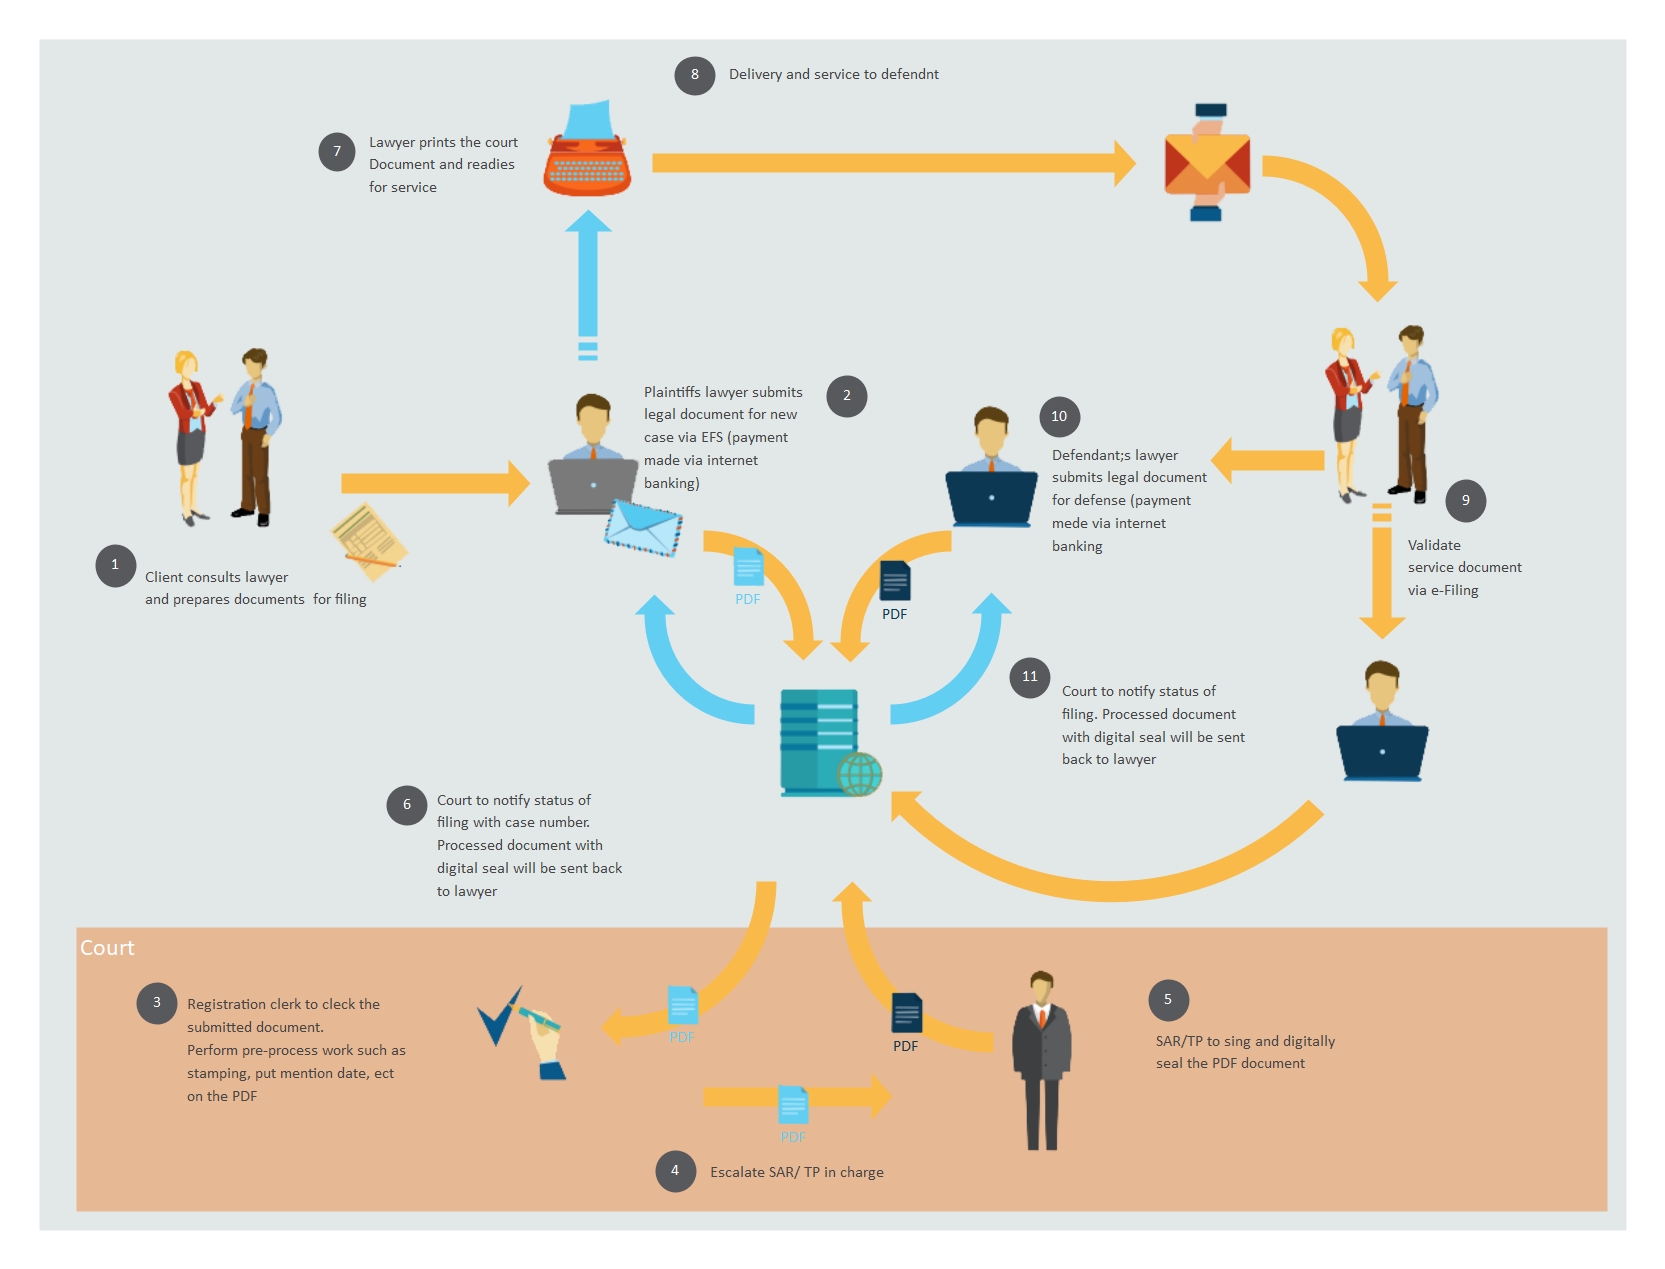
2. Sales Process Map
Multiple teams or different members of a single team are usually involved in the client acquisition process. A sales process map works on bringing them together to enhance productivity and efficiency.
In addition, a sales process map is designed to give teams a clear picture of how every task will progress and how you can monitor the revenue generated. This map may have more than one sales methodology. Moreover, it tells the sales teams what to do when customers say “no.” An example of a sales process map drawn in Wondershare EdrawMax is given below.
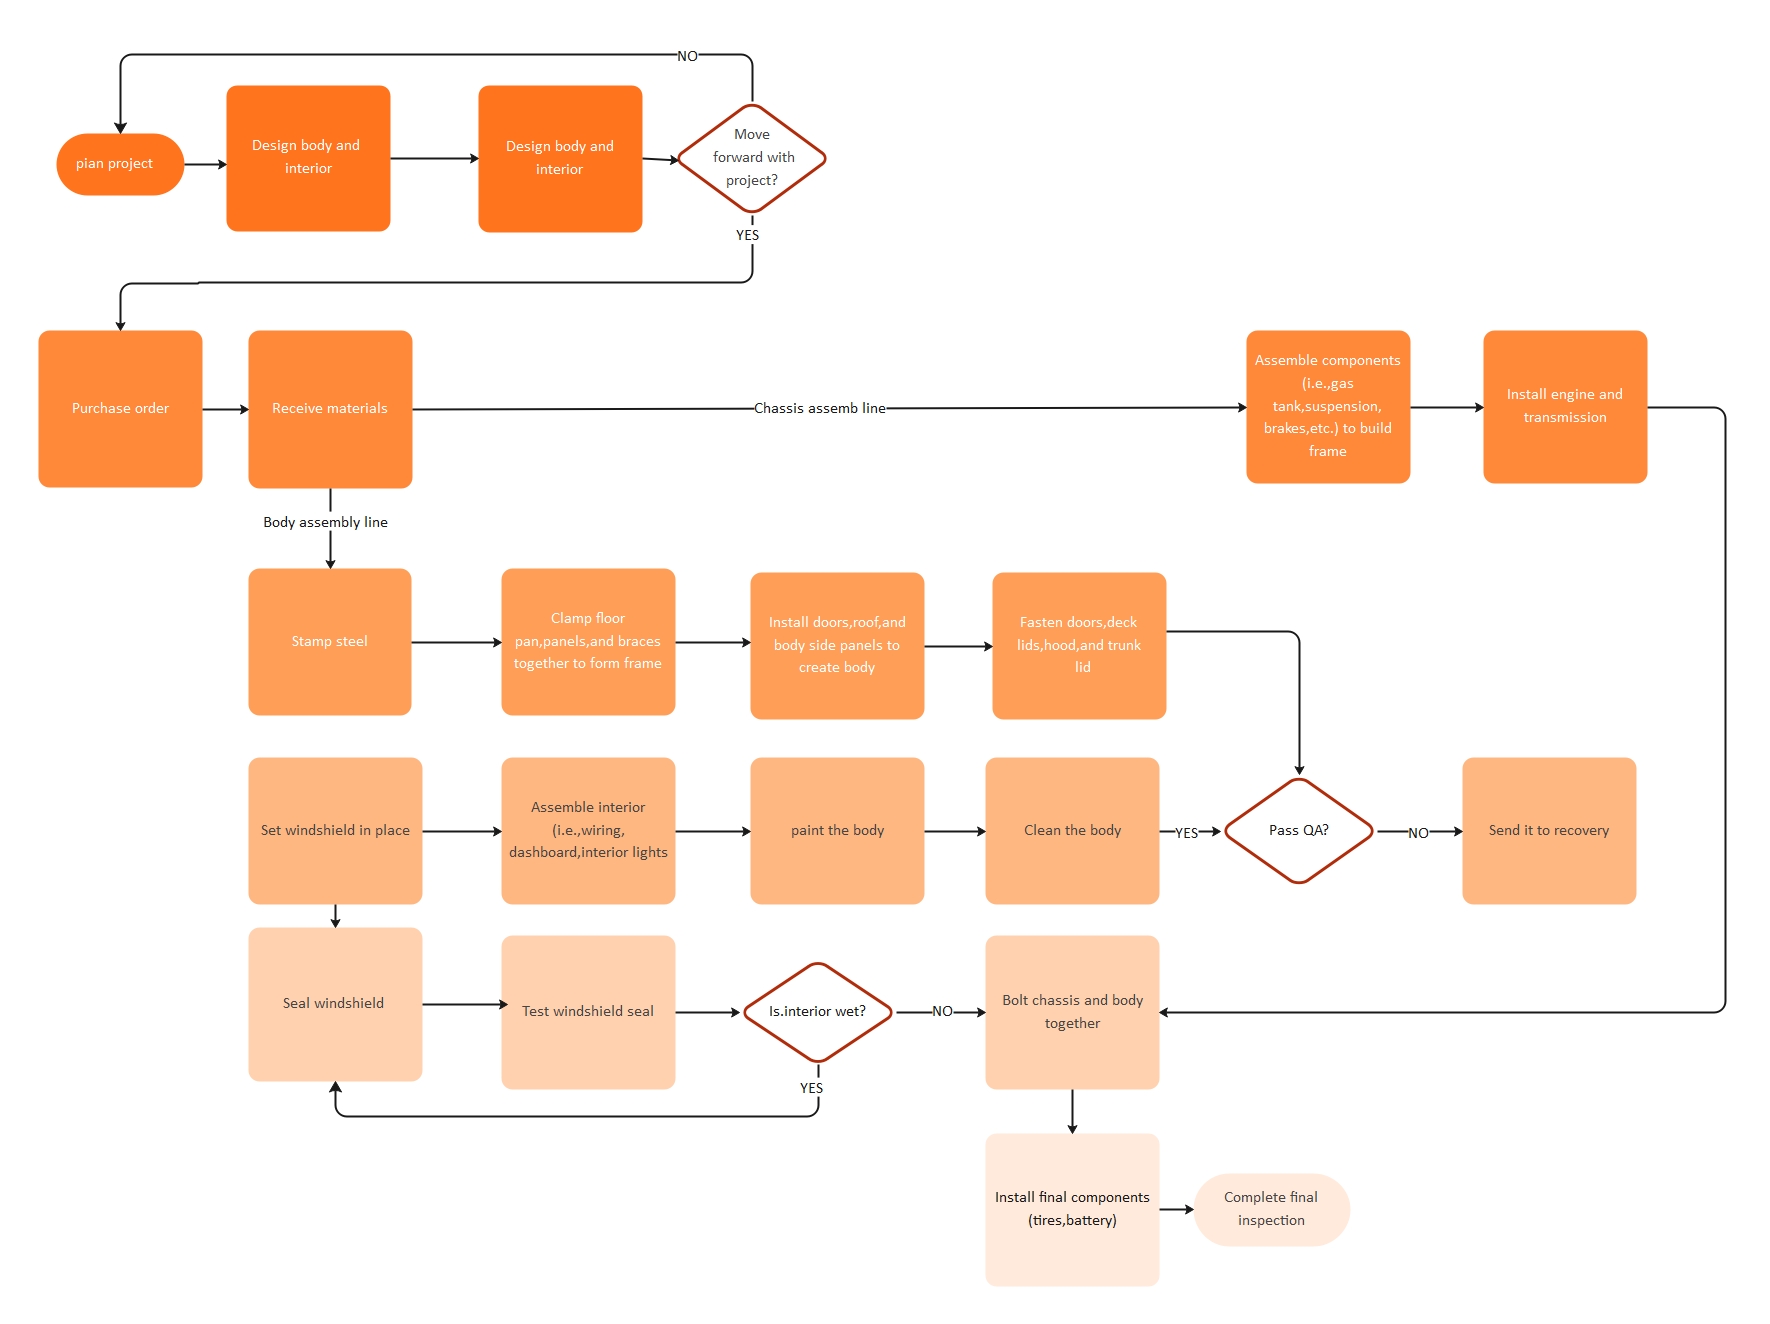
3. Manufacturing Process Map
A planning and management diagram that visually presents the complete workflow is known as a manufacturing process map. This map shows granular-level tasks that should be completed to fulfill the manufacturing tasks of the company.
Being a crucial part of the manufacturing industry, this map breaks down the complete process into different moveable parts to make it simple for everyone to determine the areas where improvement is needed.
Furthermore, this diagram also makes sure that every moveable part is working smoothly. An example of a manufacturing process map created in Wondershare EdrawMax is shown below.
6. How to Create a Flowchart Using Wondershare EdrawMax?
EdrawMax makes it super simple for you to draw a flowchart for your company or business. All you need to do is to go to the official website of EdrawMax Online, log into your account, and follow the steps given below. Don’t worry if you don’t have an account, as you can connect this utility to your Google account. Or you can try EdrawMax desktop here.
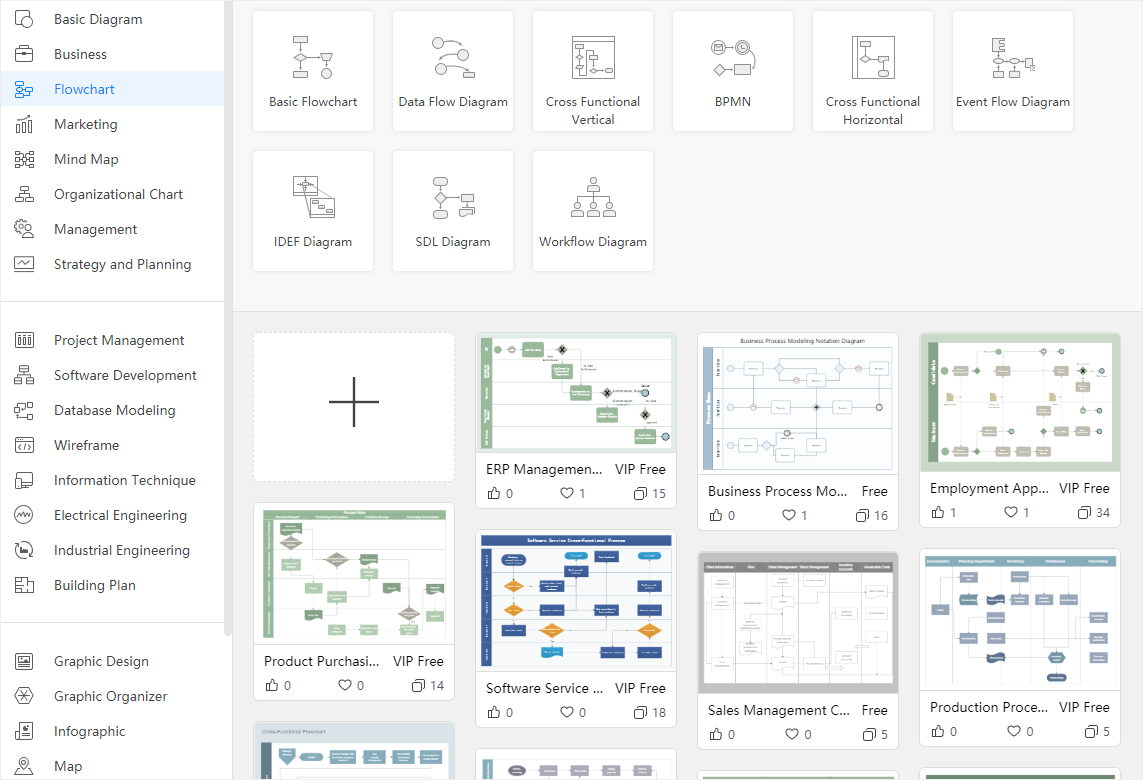
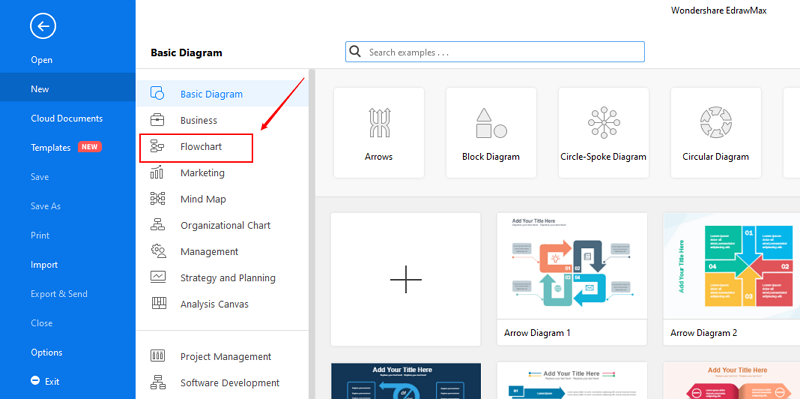
Step 1: This tool allows you to create a flowchart either from scratch or by using a built-in template. So, the choice is yours. If you are in a hurry and want to make the chart quickly, tap on “Flowchart” from the left menu. Now, choose the desired template from the list that appeared on your screen.
Note: If you want to create a flowchart from scratch, hit the “+” button and put each detail by yourself to match your needs.
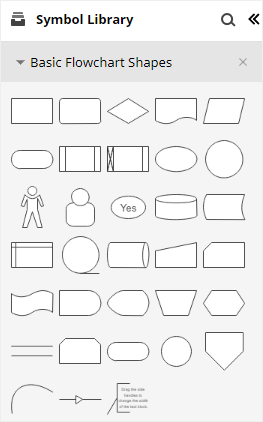
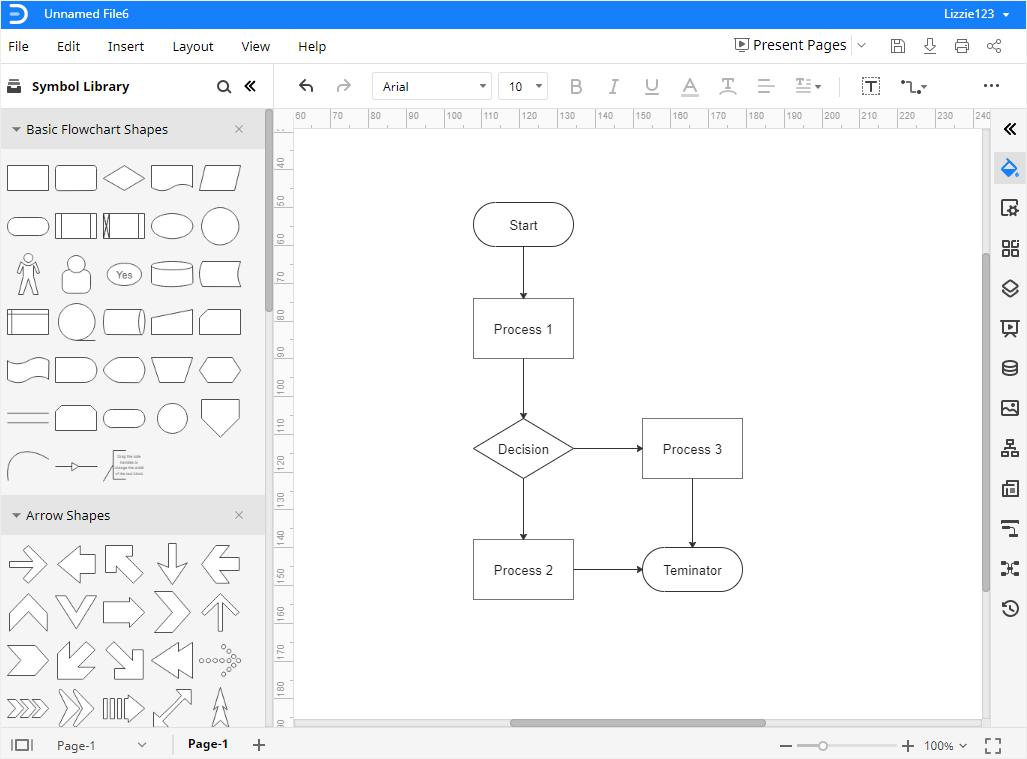
Step 2: If you have chosen a pre-built template, you can introduce the changes you want. If you are creating it from scratch, go to the “Symbol Library.” There, you will find various shapes under “Basic Flowchart Shapes.” Select the ones you think you need for your flowchart, and drop them on the drawing canvas.
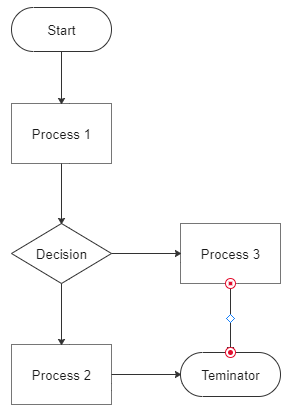
Step 3: It is time to add start and end shapes to your diagram. For this, choose “Start/Terminator” and place them on the drawing canvas. Now, add more symbols if you need them.
Step 4: This step is about connecting shapes with each other. This is where connectors play their part. Hit the “Connector” button and choose the connector you are looking for. Connectors get attached to the connection points automatically when you bring them closer to the shapes.
Step 5: Once you add all shapes and symbols and connect them with the right connectors, you can customize the diagram using various color schemes, advanced text, and font sizes.
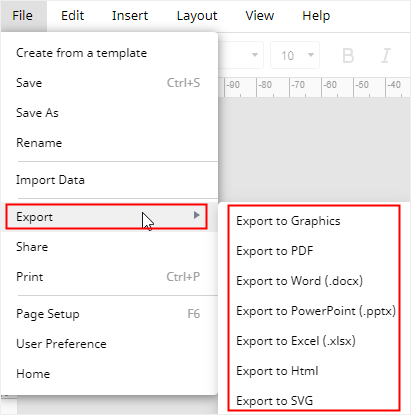
Step 6: As soon as your flowchart is ready in EdrawMax, go to the “File” menu. Now, select “Export” and choose any file format (a list is shown in the image below) you want.
Note: If you get attracted to desktop-based applications to draw different diagrams like flowcharts, worry not, as the desktop version of Wondershare EdrawMax is also easily accessible. You can download it from here. It is super compatible with Windows, Linux, and Mac OS.
7. How to Create a Process Map Using Wondershare EdrawMax?
Launch EdrawMax Online or download the desktop version and follow the steps below.
Step 1: Go to the left panel, tap on the “New” option, and click on “Flowchart.” Choose a template, make some changes you need, and go ahead. Otherwise, click the “+” button to create your process map from scratch.
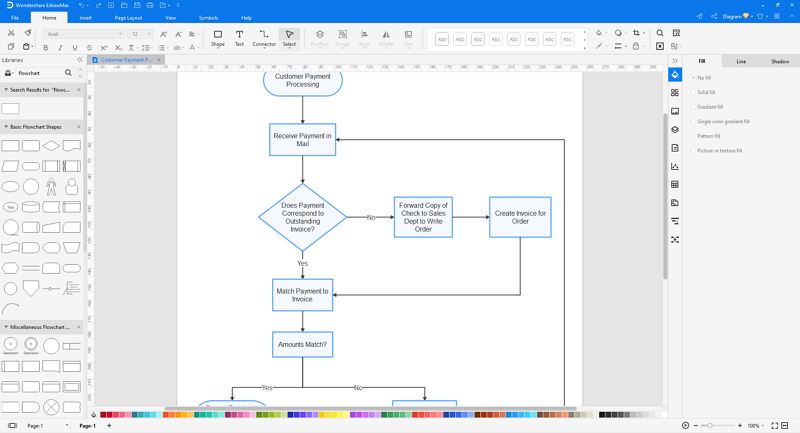
Step 2: Suppose you have selected a built-in flowchart template. It will look like the image presented below. Now, you can introduce changes to the text or layout.
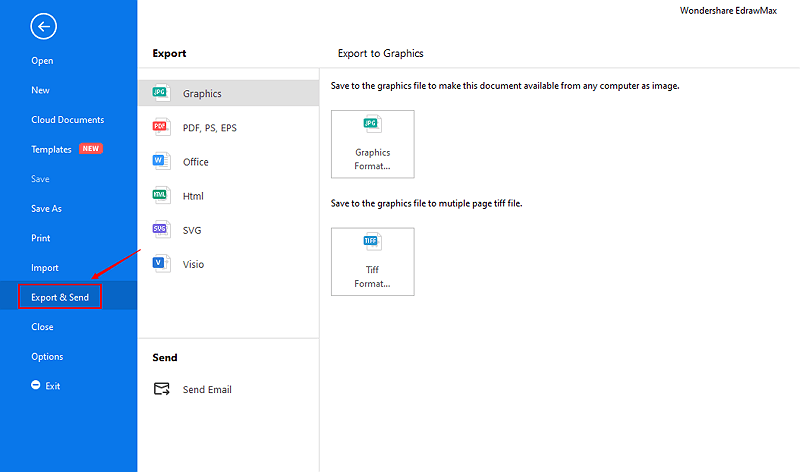
Step 3: Once you are done with creating your process map in EdrawMax, the next step is to export your final diagram. For this, go to the “File” menu from the top bar, and click on “Export & Send.” Select the format you want to export your final file in. HTML, PDF, Visio, SVG, and Graphics are the top export formats available in Wondershare EdrawMax, as shown below.
Step 4: Along with creating a process map, EdrawMax also allows you to share it in your social circle. If you want to share your map with others, tap on the “share” option, as shown below. You can share the process map either on different social media platforms directly or copy the link and share it anywhere you want.
Note: If you are looking for a step-by-step visual guide to making a process map in EdrawMax, you don’t want to miss this video.
8. Frequently Asked Questions (FAQs)
Q: How can I trust EdrawMax when drawing flowcharts, process maps, or other diagrams?
A: Well, you get enterprise-level security with EdrawMax, which protects your data with advanced security standards. This is why global giants like Toyota, Puma, Facebook, Deloitte, and Amazon trust this utility for drawing various diagrams for their businesses. Apart from that, EdrawMax has a happy family of more than 25 million active users. All these factors contribute to gaining your trust.
Q: Can a flowchart have multiple endpoints?
A: Mostly, flowcharts consist of a single starting point and one endpoint. However, they can have multiple endpoints, as different processes may end up with different decisions. Therefore, you can expect a flowchart to have more than one endpoint.
Q: What are the top challenges associated with process mapping?
A: Inconsistency, creating too many complications, depending on the wrong resources, lack of analysis, and poor process scoping are the few biggest challenges of process mapping. Similarly, the use of ineffective tools also leads to bad outcomes.
9. Final Words
You are now well familiar with the major differences between a flow chart vs. process map. Thousands of people worldwide use both terms interchangeably; however, it is not the right approach. A process map refers to inputs, outputs, and various actions required to complete a process. In comparison, a flowchart is a combination of different shapes connected with each other presenting a step-by-step workflow. Read the above discussion for more details on process map vs. flowchart.
Are you looking for a reliable tool to draw your process map or a flowchart within minutes? Searching for a utility you can trust when it comes to your privacy? If yes, trying Wondershare EdrawMax will be worth it for sure. It is accessible both online and offline (desktop app). With an all-in-one diagramming facility and advanced security protocols, EdrawMax has won the trust of over 25 million people worldwide and the world’s leading organizations like Facebook and Amazon.