Apple Bcg Matrix Analysis
 Want to Create Forces Analysis?
EdrawMax is able to create free forces analysis for software development teams with ease. Give it a try!
The BCG Matrix, created by the Boston Consulting Group in the 1970s, is a business model based on the life cycle of products. It is divided into four types: Stars, Cash Cows, Dogs, and Question Marks. The Stars is the quadrant where there is high growth and high share, the Cash Cow quadrant has low growth and high market share, the Dogs quadrant has low growth and low market share, and the last quadrant is the Question mark which is high market growth but low market shares. So, let us see the Apple BCG matrix analysis to understand its dynamic.
1. Background of Apple
Apple is a premium computer manufacturing company founded by Steve Jobs, Steve Wozniak, and Ronald Wayne in 1976. They incorporated the company in 1977 as Apple Computer, Inc. In the later years, Apple's computers became an immense success, and it also launched 357 retail stores in ten countries and developed online stores. Apple Inc is now among the biggest trading companies in the market, overtopping the Exxon Company by $60 billion.


2. Apple BCG Matrix Analysis
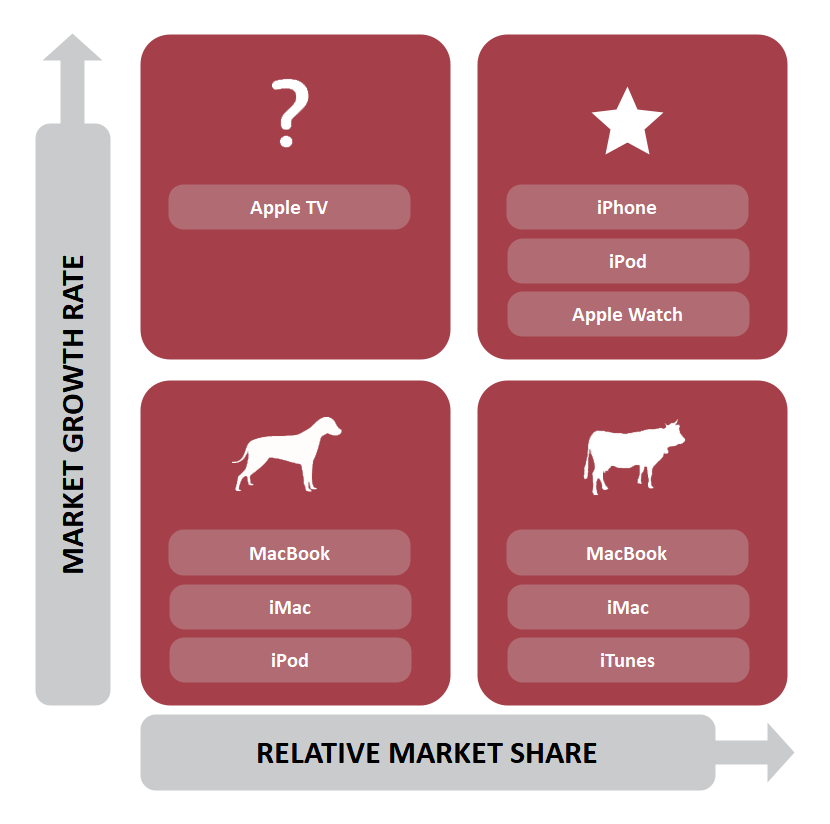
BCG Matrix of Apple analyzes its products to classify them as low growth products, high selling products, high growth products, and high selling but low growth products. We will call them Dogs, Stars, Cash Cows, and the Question Mark in the BCG market.
Before starting the analysis, let us figure out the two dimensions and what they mean.
 below.
  below.
 2.1. Market growth rate
The market growth rate is the Y-axis of the BCG matrix. It defines the rate at which a market is growing, which can be determined from industry reports. The formula to calculate the Market growth rate is
Market Growth Rate = Total sales in current year / Total sales in the previous year
So, if the industry is growing at 20% and your product is growing at 10%, we are lagging by 10%. This is a more relevant measure in slow-growth markets than high-growth segments.
2.2. Relative Market Share
Relative market share is on the X-axis of the BCG matrix. Market share is generally written as a percentage and to have a high market share. It is defined either in revenue terms or unit volume terms. The formula goes like this;
Market share = ( Company's Total sales / Total Industry Sales) * 100
So, after this basic understanding, let us go ahead and define the BCG matrix of Apple Inc. and analyze its products' standing.
2.3. Dogs
Dogs are products having high growth potential, but they are not working because of the slow market growth. It makes these products a source of loss for the company; therefore, it does not provide more investment for these products. In the Apple BCG matrix analysis, its iPods are considered dogs because they have lost their attraction due to high competition and low customer demand.
2.4. Stars
The star of a company is the products with a high market share like cash cows, but their industry also has the potential for further expansion.
>In the Apple BCG market, the iPhones are the stars of the company as we can see that it breaks the previous sales record with every new launch. Apple iPhones have a high stature because of their unique design and advanced technology. Also, the iPhone enjoys a loyal customer base that makes it beat all the competition in the booming mobile phone market.
2.5. Cash Cows
Two products are the cash cow products in the Apple BCG matrix. These are Apple iTunes and Apple MacBook, and iMacs. Over the years, these products have retained their market share and have increased cash flows for the company. Apple has a strong, loyal customer base that prefers Apple products exclusively.
2.6. Question Mark
Apple is now launching Apple Smart TVs, which has the potential of becoming the question mark in the BCG matrix of Apple. This product makes a little money but is still far from its true potential, and it can become a star if Apple can fix a few ecosystem issues.
The second product that is among the question mark products is the smartphone which is still in the growth phase.
3. Limitations of BCG Matrix
The biggest limitation of any BCG matrix, including the BCG matrix of Apple, is that it is too simplistic. It only considers two dimensions to conclude. However, there are many other factors as well. For example, the position and competitiveness of products also vary with brand equity, financial support, product line, retailer relationships, logistics, customer loyalty, etc. We can also observe that market share is good in a low-growth market, but it is less effective in high-growth segments because the market dynamics are more complex.
The BCG matrix was originally developed for large businesses with multiple business units in their portfolio. So, the same matrix cannot become a suitable strategic analysis and planning tool for individual products. Also, the market definition for different companies and among different products may vary. For example, in the Apple BCG matrix analysis, we know if Apple considers all handheld gadgets as its market or only smartphones.
4. Bonus: More Analysis Diagrams of Apple
Having explored Apple's BCG Matrix, look at Apple's organization chart, PESTLE, value chain, and VRIO analysis. These models can help you understand further how Apple competes and succeed in the global marketplace.
Wondershare EdrawMax Templates Community offers a variety of templates for these frameworks. It's easy to create professional-looking diagrams. You can edit, customize, and export these templates to share with your team or stakeholders. Here's a brief overview of each framework:
Apple Organizational Chart
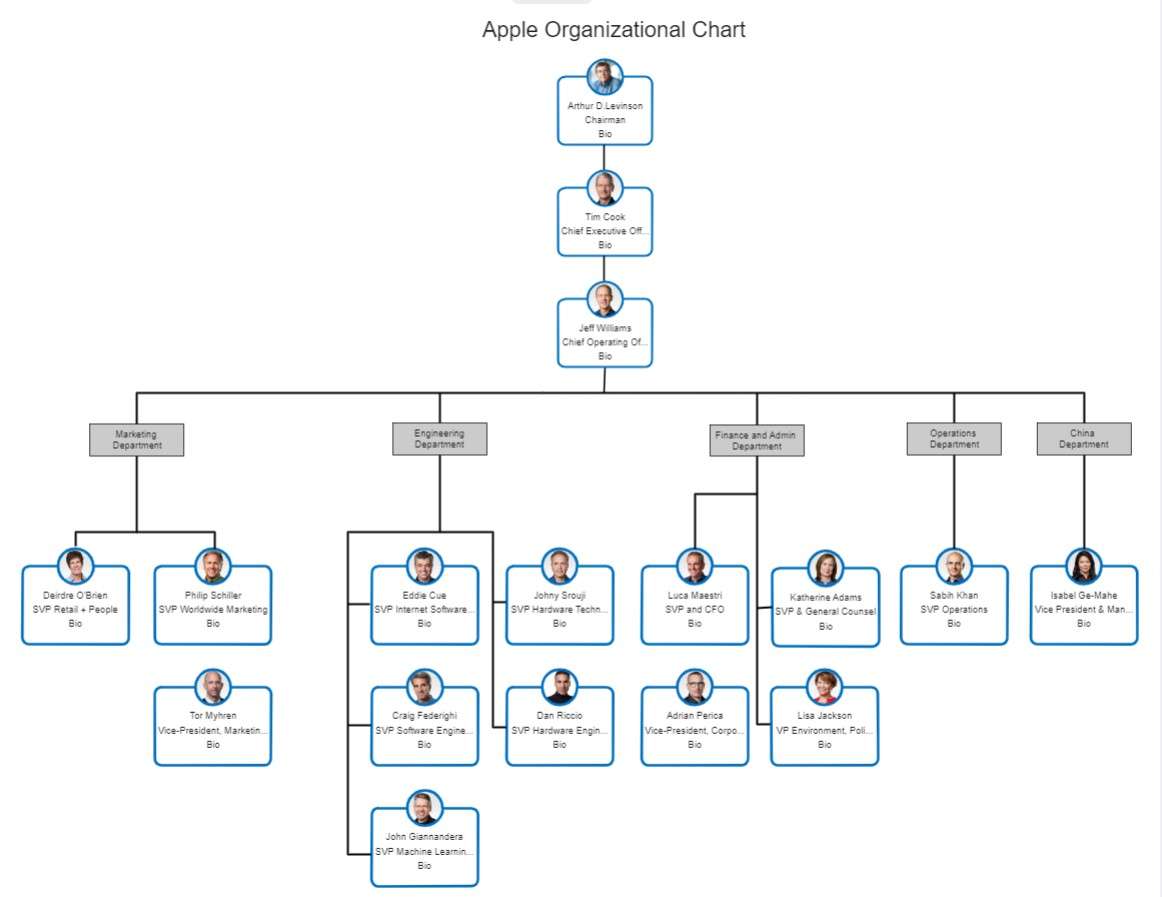
Apple is a company known for its innovative products and services. But many people don't realize that success is also due to its collaborative culture. The Apple organizational chart reflects this commitment to collaboration.
At the top of the chart are the Chairman and Tim Cook, Apple's CEO. He leads a team of senior executives who each oversee a different area of the business. These executives are responsible for their teams of talented employees.
Together, Tim Cook and his team work to create and bring to market some of the most innovative products and services. From the engineers who design the iPhone to the marketers who promote it, everyone at Apple plays a vital role in the company's success.Apple PESTLE Analysis
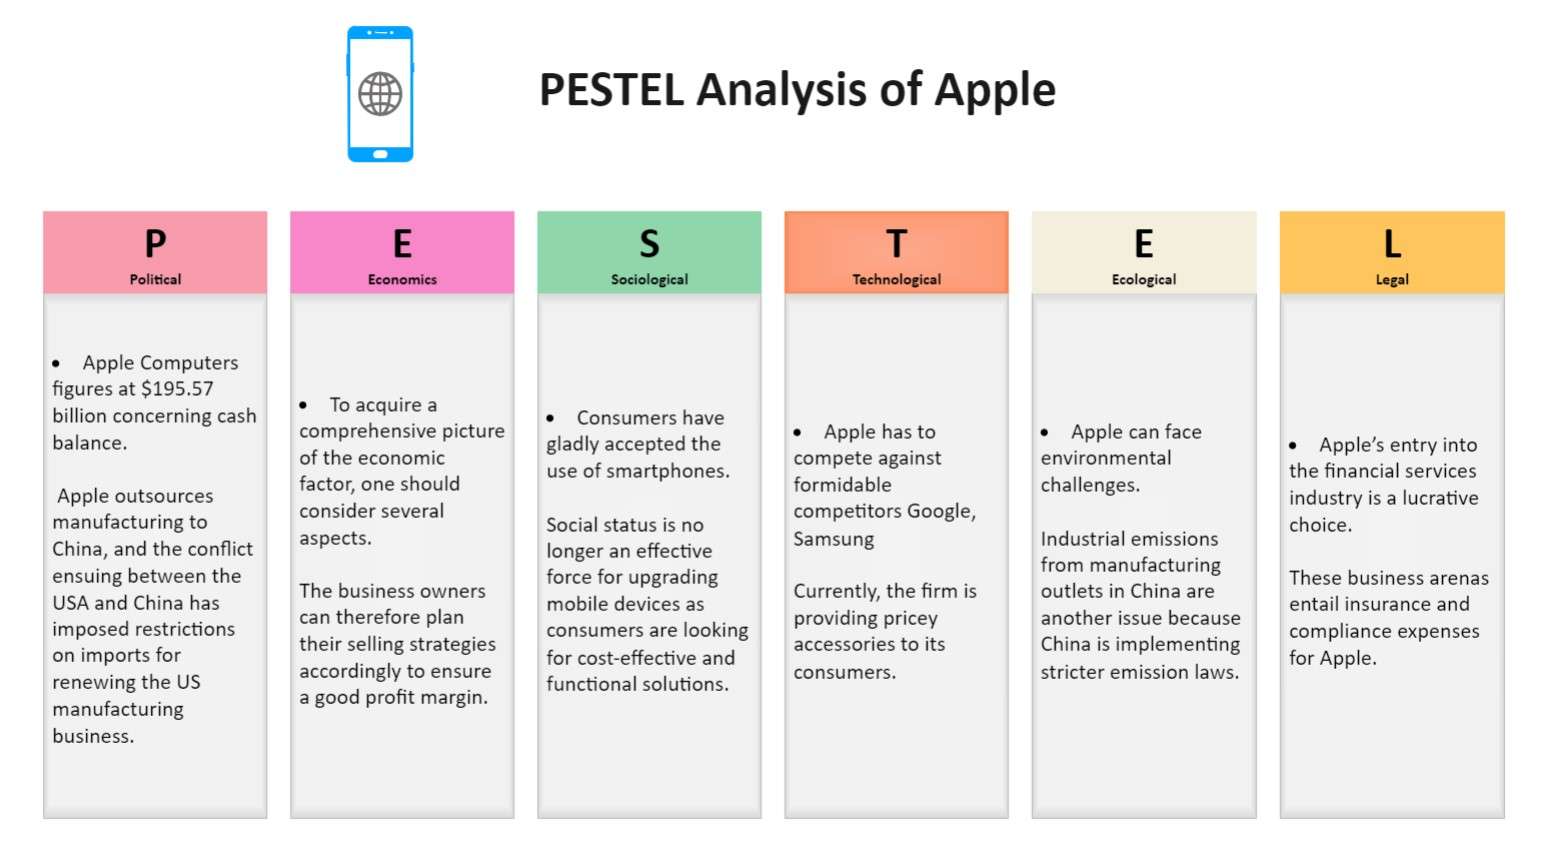
Apple is a big tech company, but things outside its control can affect its business. The PESTEL analysis, a valuable strategic framework, offers insight into these factors. PESTEL stands for political, economic, social, technological, environmental, and legal factors. These factors can affect Apple's supply chain, profitability, and product demand.
Political factors, like government rules and trade policies, are one. The global economy is another; a recession may reduce consumer spending on electronics.
Social media changes how people consume content. Environmental worries push Apple to go green. The rise of AI offers new chances and challenges. Legal factors, like intellectual property and consumer protection laws, also matter.
Apple Value Chain Analysis

At each stage, Apple strives to create value for its customers. The value chain has two categories: the primary and support activities. The primary activities involve creating, delivering, and selling Apple's products and services. These are essential for adding value and creating a competitive advantage.
Then, the support activities enable Apple to carry out its primary activities. They provide the necessary infrastructure and resources for the company to operate efficiently. All these activities work together to create the value that Apple's customers are willing to pay for.
Apple VRIO Framework Analysis
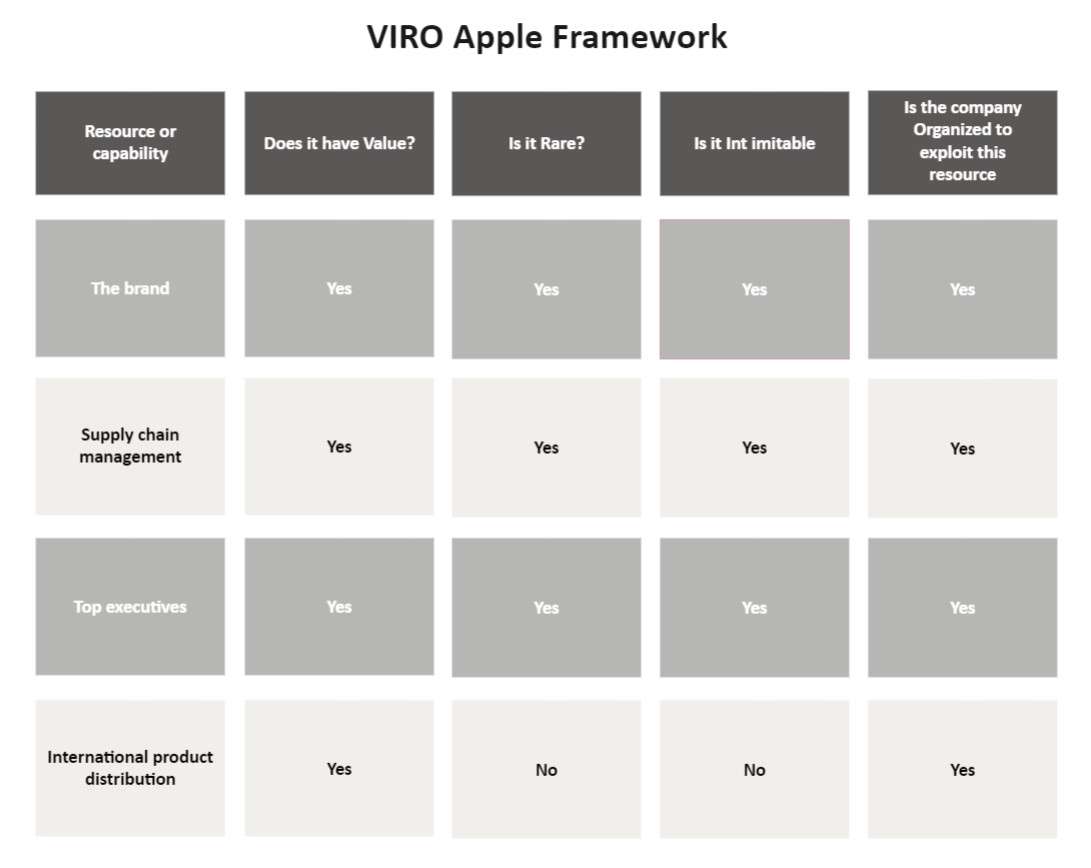
VRIO is a framework for identifying and evaluating a company's core competencies. These are the internal resources and capabilities that give it a competitive advantage. Apple's brand is valuable and rare, and it's difficult for competitors to imitate. Its supply chain management is also top-notch, giving it a significant advantage. Also, Apple has a strong team of top executives and a global product distribution network.
So, how does Apple organize itself to exploit these resources and capabilities? Apple has a culture of innovation and collaboration. It helps it develop new products and services that meet the needs of its customers. It also has a strong focus on quality and customer satisfaction.
5. Key Takeaways
Apple Inc. is a leading player in the computers and smartphones market with a diverse portfolio. Its products range from iPad, iPhones, iMac, Macbook, MacOS, etc. We can classify its products as dogs, stars, cash cows, and question marks in the Apple BCG matrix analysis with this diverse portfolio.
You can draw a perfect BCG with attractive graphics using EdrawMax drawing software. The business diagram templates available at templates community also give you a quick start with professionally designed, fully customizable samples. The comprehensive library of symbols and clipart is also a great help, with easy-to-use layout and drag and drop features.