Analysis on BCG Matrix in Marketing

1. Introduction
The Boston Consulting Group, aka BCG matrix, is a product portfolio matrix that helps with long-term strategic planning. It supports a business to analyze its growth opportunities by reviewing its portfolio of products and deciding which products need and deserve investment, where to discontinue putting in cash, and which products can be developed into revenue generators. The BCG matrix in marketing analyzes the products to put them into four categories: dogs, stars, cash cows, and question marks.
2. BCG Matrix in Marketing
BCG matrix in marketing analyzes the business according to the marketing mix framework containing 4Ps, i.e., Product, Price, Place, and Promotion. Several marketing strategies, including product innovation, pricing approach, promotion planning, etc., need both human and financial investment, and the classification using BCG marketing is a big help.
BCG's marketing strategy helps the brand/company position itself competitively in the market and achieve its business goals & objectives.
3. Four Categories in the Bcg Matrix Marketing
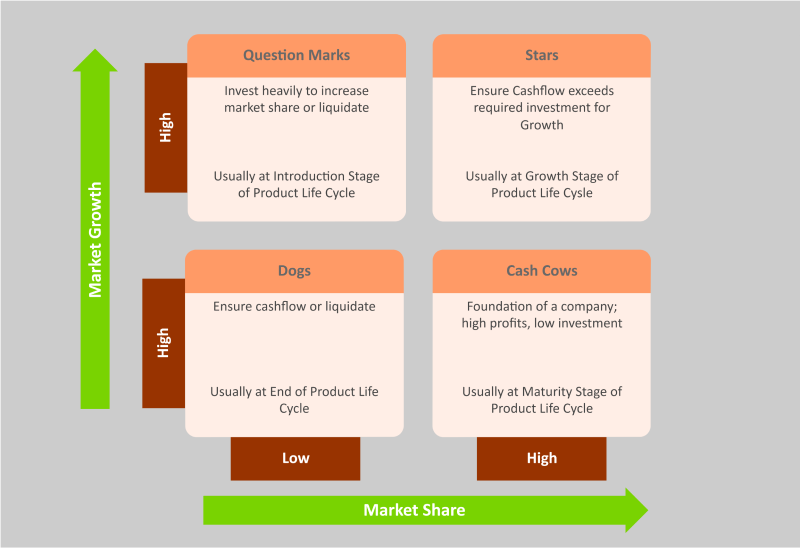
We can use the BCG matrix in marketing to see how a business can make investments in various marketing channels. The portfolio may be different, but the general strategy is the same. It is to milk the cash cows for revenue, not invest in dogs, make investment options for stars, and closely observe question marks to predict their potential.
Now, let us see the four categories in the BCG matrix marketing.
- Dogs: Products with low growth or market share
- Question marks: Products in high growth markets but with low market share
- Stars: Products in high-growth markets and high market share
- Cash cows: Products in low growth markets but with high market share
3.1. Dogs
The Products in the dogs' quadrant operate in slow-growth markets and have a low market share. These products can sometimes sustain themselves but cannot support other company units to provide cash flows. These products are not worthy of future investments because the growth potential in the market is not attractive. These products are also called cash traps because sometimes they eat up the revenues from cash cows without substantial ROI. Companies generally diversify away from these products unless they complement their well-performing products.
3.2. Stars
Star products are products with a high market share in a fast-growing market. These products bring in substantial ROI and have the potential to become a cash cow to generate revenue for the company. In the BCG matrix in marketing, as the industry grows, the products either become cows or dogs. These product classifications help companies make decisions for portfolio management and investments for future growth.
Stars are usually revenue generators and also cash users. They are operating in high-growth markets and also have a high market share. Therefore, companies invest in these products to grow them into cash cows.
3.3. Cash Cows
Cash cow products operate in slow-growing industries because they have mature markets and have high market share. They are well-established, easy to produce, and constantly demand, making them very profitable. Every company needs cash cows to maintain a reliable source of income.
These cash cow products are milked to produce cash. This revenue is later used in running the company operation, investing in star products to produce high ROI. Products in the cash cows quadrant are leaders in the marketplace, and cash cows do not need significant investment to maintain their position. Cash cows generate high cash flows used to finance stars and question marks.
3.4. Question Marks
Question products are somehow a gray area products. They have a low market share and require support in investment and resources, and they have the potential to either become stars or dogs. So, the investments in these products must be released with caution and based on strong analysis and predictions.
Question marks products are the most managerially intensive products because they require support in terms of extensive investment and resources to increase their market share. These investments are channeled from the cash cow products.

4. Limitations of BCG Matrix in Marketing
BCG is a very simple planning tool to assess the position of different brands and products in the market to see where to invest more finances and where they need to be careful and withhold investments because of no or fewer chances of growth. However, this over simplicity also makes its use limited because many other factors in the market may affect the products like geographical demographics, brand power, competition in the market, etc.
Also, the BCG matrix was originally developed for different manufacturing and production units owned by one business group. Using this BCG matrix in marketing can get complex and sometimes out of context. Another limitation of the BCG matrix is that it crosses out the gray areas like if a market is growing at a slow pace, but in some time it can gain momentum, how would we show it in the BCG matrix?
In conclusion, we can say that BCG alone is not the best planning tool, so we need supporting business analysis tools and diagrams for better decision-making.
5. Key Takeaways
BCG matrix in marketing is a business planning tool to support decision-making for the companies. This decision-making involves investment options and the growth potential of their products based on market share and growth predictions. So, in the marketing mix, this matrix can show which products are performing better, what kind of promotions they need, where to channel marketing resources, etc.
A comprehensive drawing software such as EdrawMax is an excellent choice for drawing BCG matrices with the support of exclusive symbols, clipart, and great tools and layout options. The templates library in EdrawMax is well-stocked to give you a quick start with professionally designed samples for business planning and analysis diagrams, including the BCG matrix. Find more business diagram templates.
6. References
-
Reading the BCG Growth-Share Matrix. (n.d.). Investopedia. Available at: https://www.investopedia.com/terms/b/bcg.asp (Accessed March 14, 2022).