What is A Graphic Organizer with Examples
Create a Graphic Organizer Online Free Free Download Free Download Free Download Free DownloadVisual representation makes understanding any concept or idea easier than plain text. A graphic organizer helps you illustrate ideas and facts using diagrams and symbols. It is also a great visual tool that helps students and writers picture their thoughts before writing essays and reports. You can learn about graphic organizers' various types and uses from here. Check out its examples and learn how to use a graphic organizer easily.
What is a Graphic Organizer?
A graphic organizer visually represents ideas, concepts, and relationships between various components. Concept maps and knowledge maps all are types of graphic organizers. You can use any chart or diagram as a graphic organizer to compare facts and depict a story. There are no specific rules to create a graphic organizer, and you can use it as a concept mapping tool to draw conclusions and picture your thoughts on any matter. Find more graphic organizer examples.
Just like any other kind of visual tool, graphic organizers also have their advantages and limitations. Lets’ quickly have a look at why you should consider using them right here.
Pros
- They can easily draw a relationship (similarities or differences) between two or more components in a simpler manner.
- With the help of grids and charts, we can also organize our data instead of leaving it cluttered. Subsequently, data can be formed into meaningful information this way.
- Most of these graphic organizer diagrams are self-explanatory and saves a lot of time while presenting.
- They encourage self-learning and would help us solve a problem on our own.
- With diagrams like a storyboard, we can make education so much interesting for kids and even help students with learning disabilities.
Cons
- There is a lack of standards for graphic organizers and thus visuals drawn by an individual might not be properly understood by someone else.
- Too many times, a crucial piece of information is left or wrongly represented in these diagrams.
- A few diagrams are a bit unorganized and need to be refined.


Types of Graphic Organizers
A graphic organizer helps you illustrate ideas and facts to make them easier to understand for the reader. You can visually use a graphic organizer to represent any type of data and concept. There are various types of graphic organizers that you can use based on the kind of data you want to classify. Before you create a graphic organizer, look at the diagrams given below to get a better insight into which diagram type is best for you.
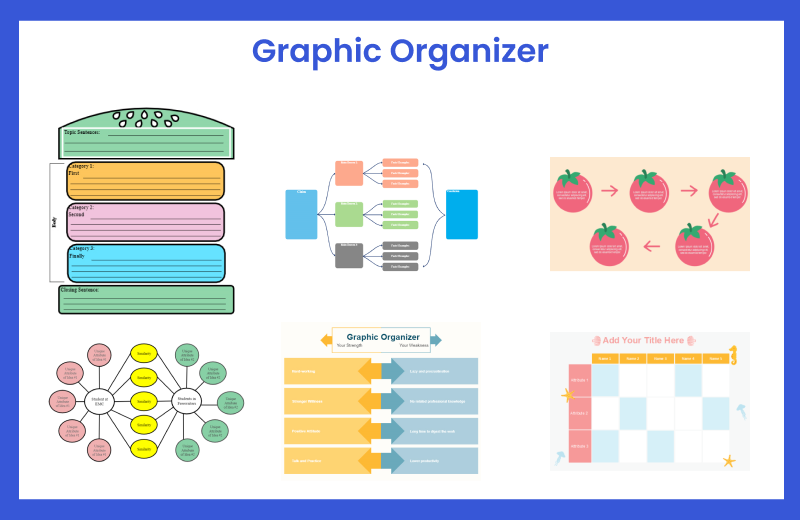
To start with, let’s have a look at the simplest kind of graphic organizer. In this, we create a grid that has certain columns and rows. Mostly, it is used to represent facts or compare several things together.
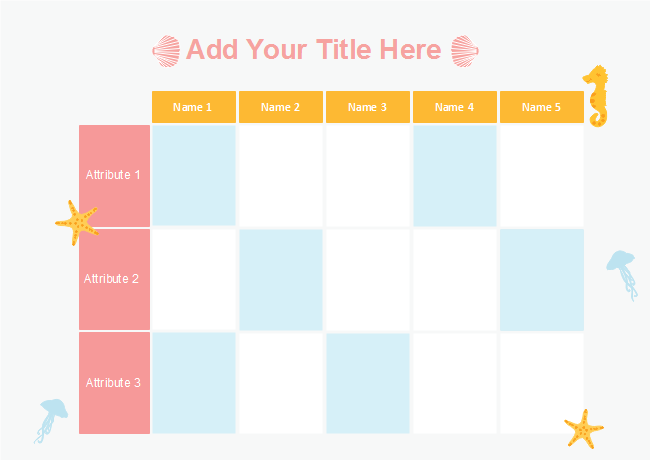
How to use
- Decide on a topic and write its name at the top of the grid matrix.
- Give headers for each column and row in the matrix.
- Organize data by comparing rows and columns.
These diagrams are also extremely simple to make and helps us break down a concept into sub-levels. You can take any topic as a root and list its sub-systems, parts, etc. by dividing it into different components. You can traverse it via a top-down or a bottom-up approach.
How to use
- To classify members and groups perfectly, start by picking the suitable classification diagram type.
- If all the elements come from the same data group, use a classification tree. Use Venn diagrams to compare data instead of a tree.
- Give the topic name and use lines to draw relationships.
- Follow the hierarchy and don’t intersect lines.
If you want to depict a series of events in a simpler manner, then use a sequence diagram. It follows a chronological order in which one thing leads to another. They are mostly used to draw historic events or explain how a task has to be achieved. These diagrams are further divided as chain, ladder, or cycle. Find more sequence chart examples.
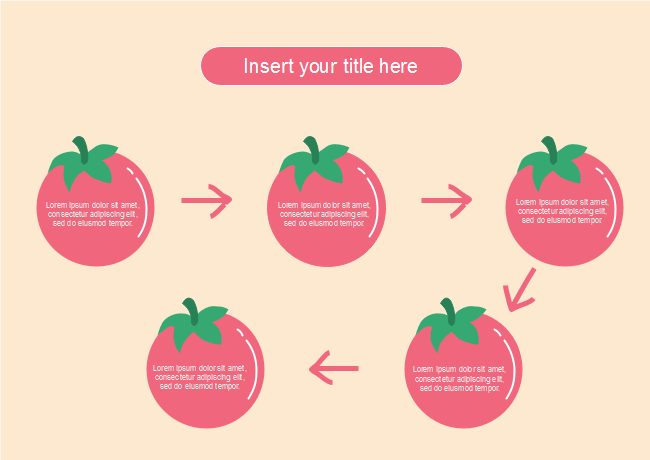
How to use
- A sequence diagram strictly follows the order of activities, so the first thing to keep in mind is to follow the hierarchy.
- Give details about each process and act as the sequence diagram is commonly used to explain how each method works.
- Use rectangles to represent objects and stick figures to represent actors.
- Draw the objects at the top and depict the process flow under each object.
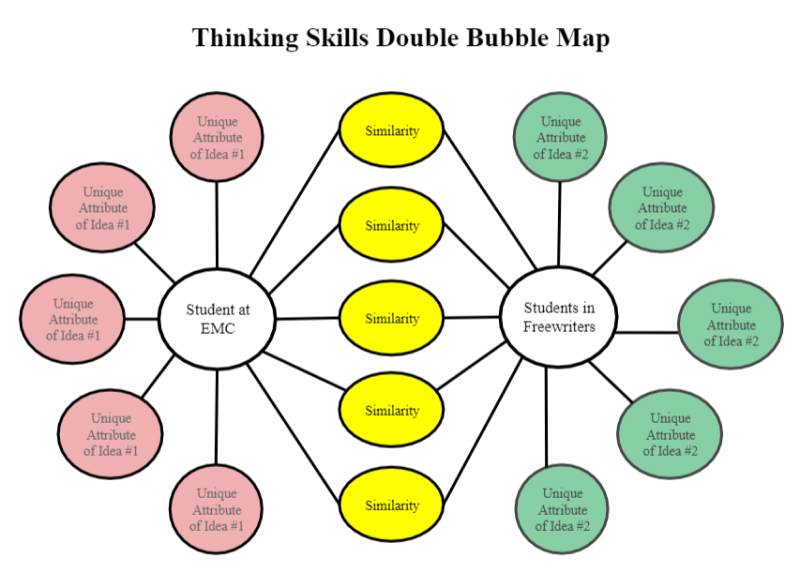
Originated from graph theory, Venn Diagrams are also extensively used in our everyday documentation. In this, two or more components are compared with each other. Apart from listing their differences, we also note down their similarities. That is why, they are also known as compare and contrast organizers. Find more Venn diagram examples.
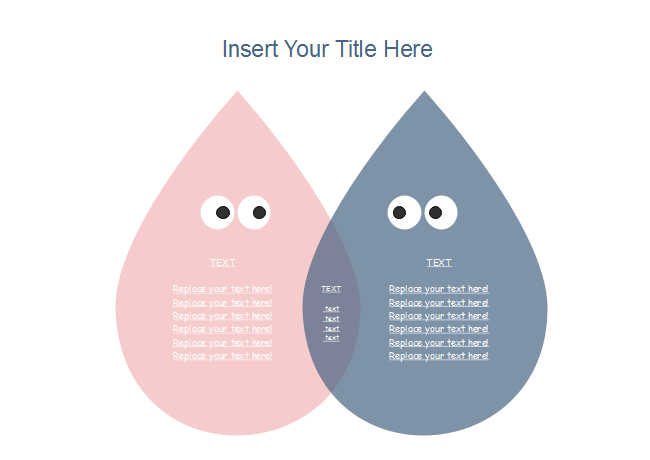
How to use
- Compare two or more data sets using partially intersecting circles.
- Each circle represents a different data set.
- The area of intersection contains similar elements of both groups.
- Have a further understand of Venn diagram symbols.
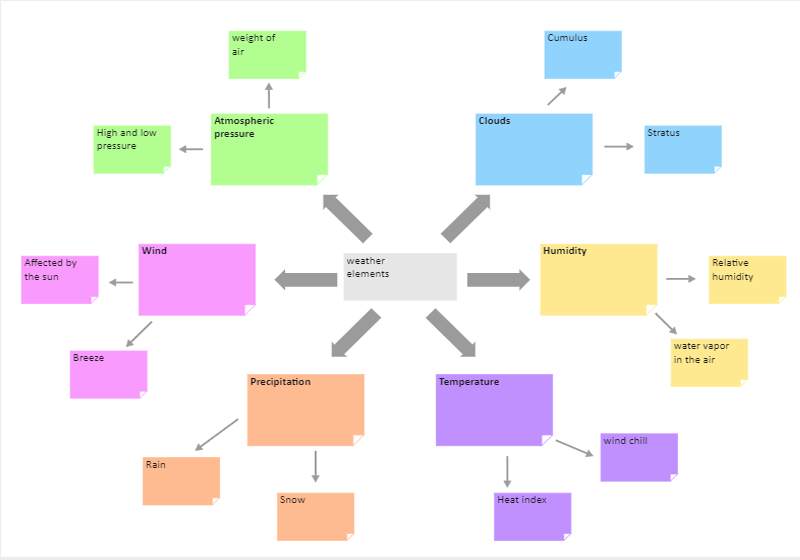
As the name suggests, these diagrams look similar to a spider web. It has a major concept listed right at the center and numerous branches. Although, they resemble a mind map, they are more focused on a single entity and its classification. Find more spider map examples.
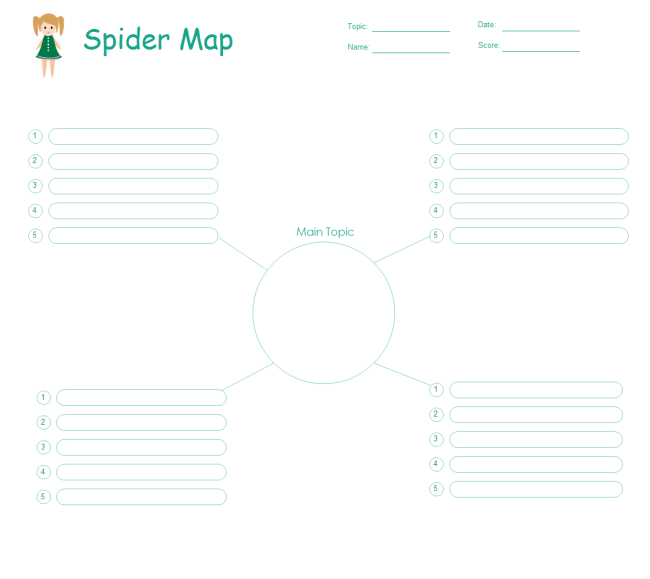
How to use
- Use any shape at the center of the diagram to represent the central idea or the main data set in the spider map.
- Use lines to create branches coming out from the center in each direction to represent subgroups and elements.
- Expand the spider map by connecting elements with other elements.
These are one of the most engaging and visually appealing graphic organizer types out there. It is mostly focused on the process and represents the information in the form of a story. That is, it has a proper beginning, middle, and an end that the learners can observe. When it comes to storyboard – the sky is the limit as there are no strict rules. Find more story elements graphic organizer examples .
How to use
- Create a list of illustrations as a part of your story or script.
- Place each illustration in an order based on your story and leave a few empty lines under each one.
- Write the details and try to explain the illustrations in a few words.
KWL stands for Know, What to Learn, and Learned. Needless to say, the entire graphic organizer is based on these three components. Firstly, we discuss what we already know. Later, the objective of the lesson is listed, which leads to problem discussion. In the end, a conclusion is drawn on what is learned.
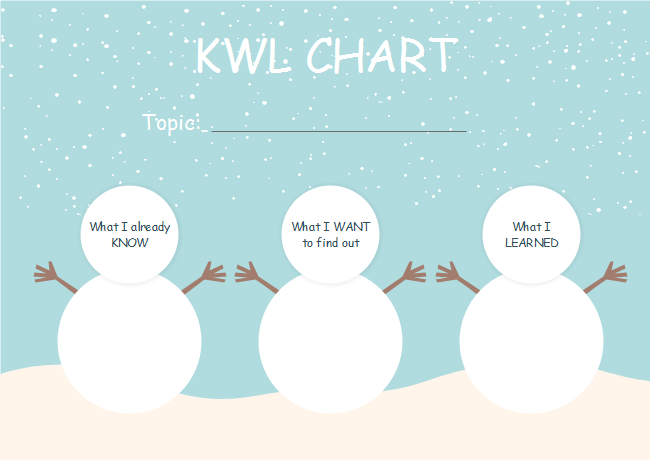
How to use
- Add the topic name at the top and divide the chart into three columns.
- Label each column K, W, L.
- In the K column, write what you already know; in the W column, write what you wonder, and in the L column, write what you learned.
A narrative writing graphic organizer is a diagram that helps students understand a plot or story's idea and concepts. Characters, story setting, plot, each of these elements are typically separated into different groups to make students easily understand the details of the story to figure out the problems and solutions in it. A story map is the most commonly used narrative writing tool. Find more examples of graphic organizer for writing.
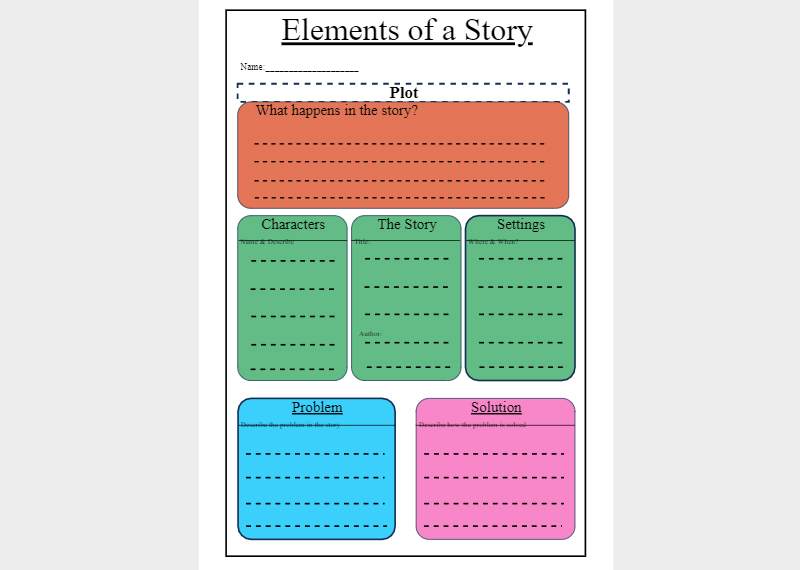
How to use
- Classify each element of the story.
- Start by writing the topic name and the main plot of the story.
- Introduce characters and the settings.
- Define the problems and give details for their solution.
We use a hamburger writing graphic organizer to represent ideas in a cohesive paragraph. It illustrates the ideas and concepts in a sequence similar to a hamburger. The topic sentence and the closing sentence represent the outside of a hamburger. The body gives details about the elements and categories to prove facts and adequately explain the concept.
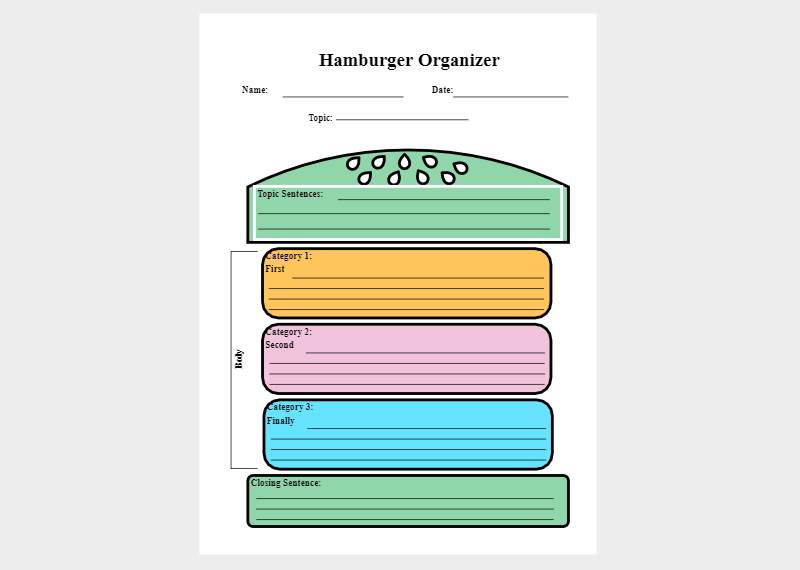
How to use
- Write a topic sentence after giving the topic name.
- Give details about the elements and ideas of the topic inside the body of a hamburger.
- Use the closing sentence to draw a conclusion based on its elements.
As the name suggests, you can use a persuasion map to illustrate the facts and credibility of a persuasive debate or topic. Students use this graphic organizer to explain, give the general idea for their thesis, and represent each fact and proof they know about their research. Using three reasons to prove an argument is the most commonly used format of a persuasion map. Find more persuasion map examples.
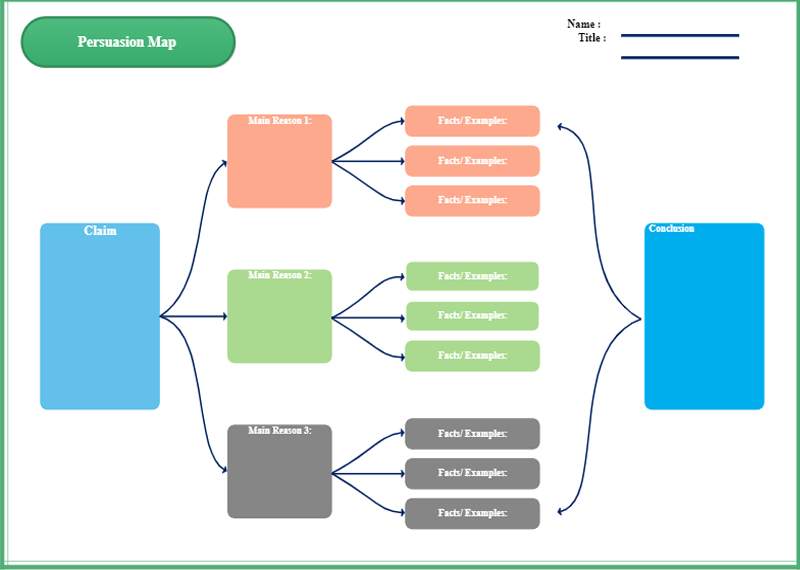
How to use
- Describe your claim in the first section.
- Give three main reasons for your claim and connect links with the first section.
- Give three facts for each reason in the same way.
- Write a conclusion to close the argument.
We use a problem and solution graphic organizer to find the most efficient solution for the given problem. It depicts the whole process by providing multiple possible solutions for a problem. Each solution comes with its pros and cons, and you can easily compare which one works the best based on the situation. Find more problem and solution graphic organizer examples.
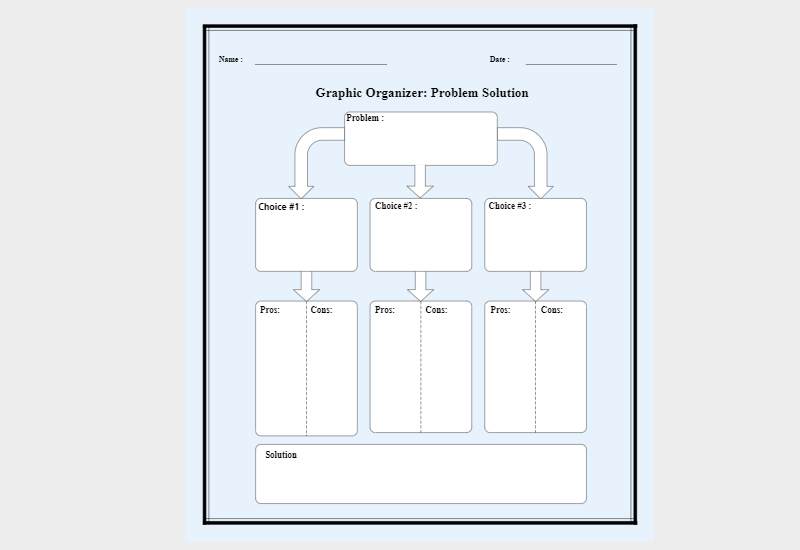
How to use
- Describe the problem at the top.
- Link three possible solution paths to the given problem.
- Branch pros and cons for each of the given paths.
- Write the solution which you think is the best.
We use a T chart to separate the given data or concept into two categories. It is a simple graphic organizer where we use a T-shaped chart and divide information into two groups based on specific attributes, measures, or classification. It is commonly used to compare two data sets or find the pros and cons of the data set.
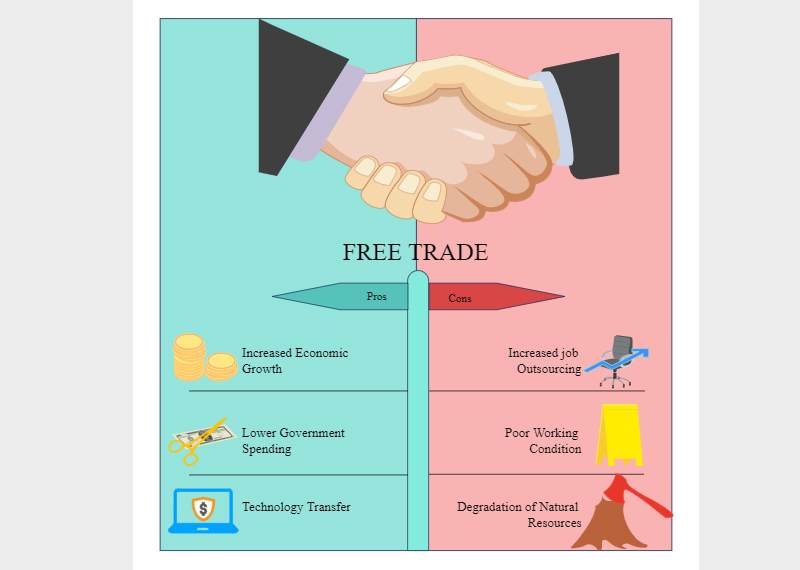
How to use
- Name the topic and draw a T-shaped chart.
- Give headers at the left and right sides of the chart.
- You have to separate information based on the group classification.
- Use a similar hierarchy on both sides.
With a timeline graphic organizer, you can depict events or activities in a sequence based on their specific dates. Dates can be days from the same month or months from the same year. You can also make a yearly timeline to represent significant events like graduation, marriage, birthdays. Find more blank timeline templates.
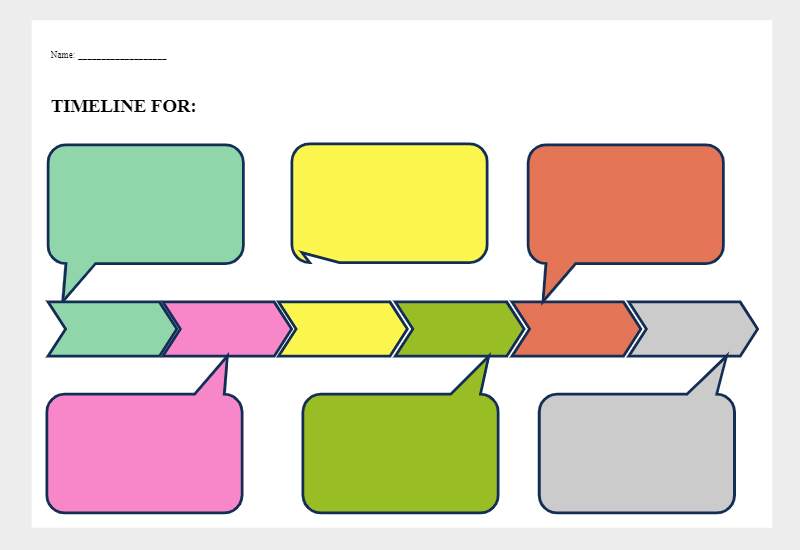
How to use
- Make sure to follow the date sequence.
- Write all the dates that are part of your timeline.
- Label each specific date with the event name and give details to make it easier to remember.
Most teachers use a vocabulary graphic organizer to teach vocabulary to their students by helping them understand the meaning and use of a problematic vocabulary in reading. Its format is quite simple as students write the words they don't know about at one side, find their definition from the book, write it next to it, and even add a picture to understand it better.
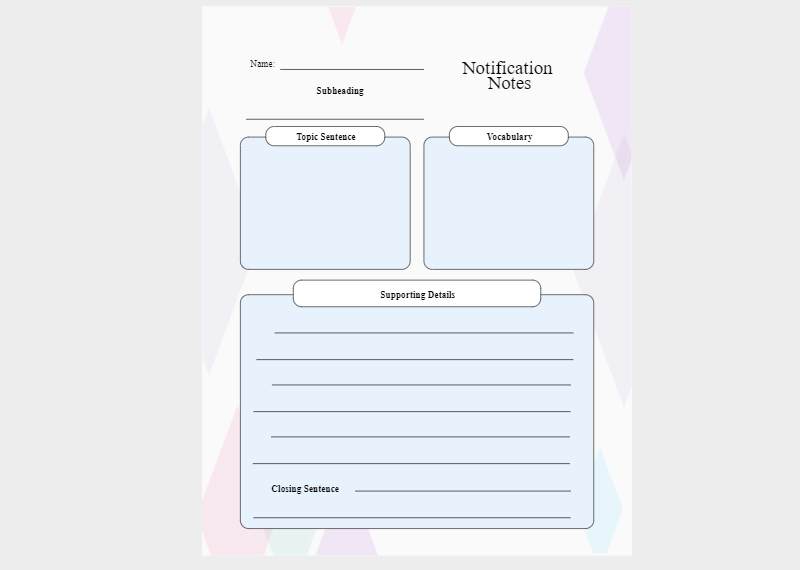
How to use
- Start by adding the word you don’t understand.
- Look up its definition and write in one section.
- Give its synonyms and antonyms.
- Add a picture to give a reference for the word.
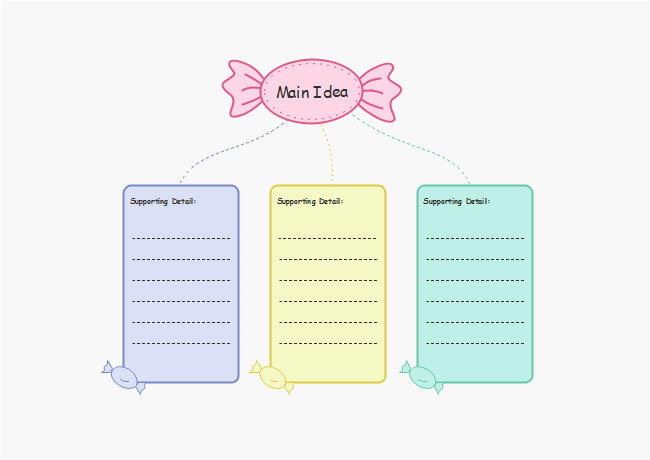
If you are looking for a graphic organizer for brainstorming activities, then a leading idea web is the best pick for you. It depicts the main idea as the central point of the web, and each detail or other idea related to it branches outward in various directions. It is also beneficial when it comes to event planning and essay writing.
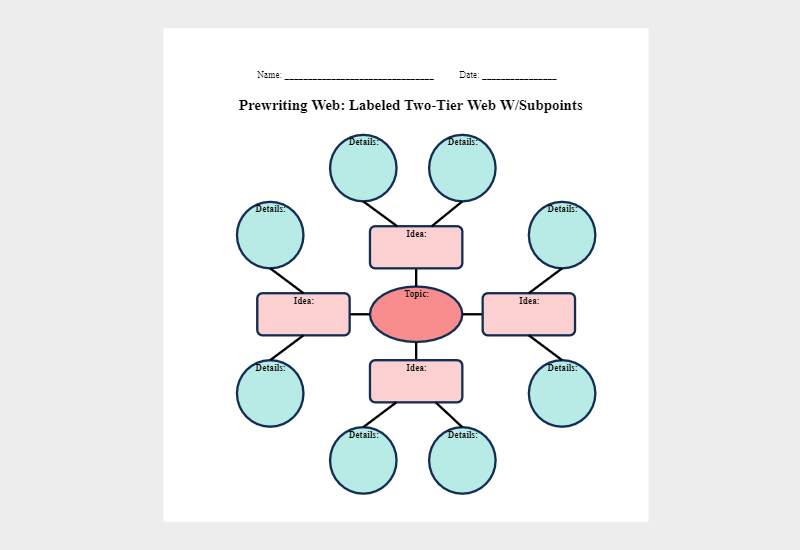
How to use
- Write the main idea at the center of the diagram.
- Give three or more sub-ideas to explain the main idea in parts.
- Give various details for the main idea as branches stretch out from the center.
Whether it is for problem-solving or essay writing, both of these require brainstorming and creating a strategy before finding the ideal solution or writing a perfect essay. A brainstorming graphic organizer depicts the main idea or the problem as sub-topics and then gives details about each sub-topic to explain the point better.
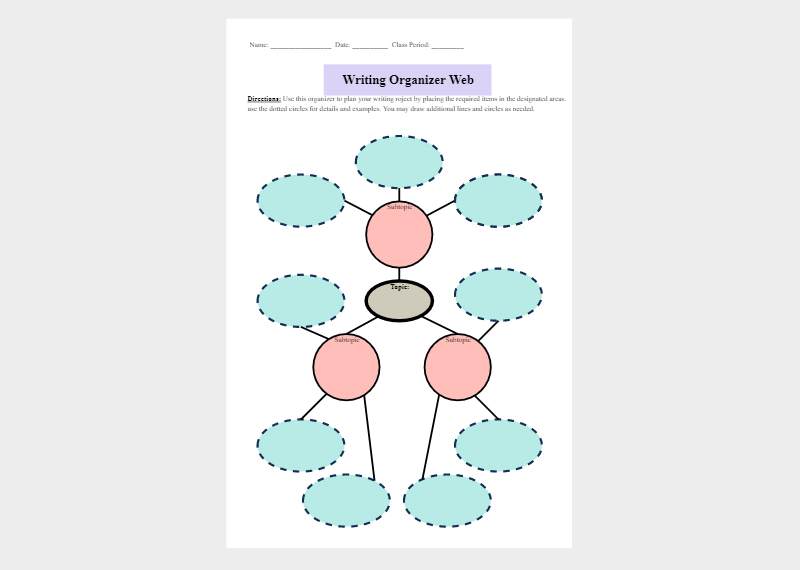
How to use
- Give the topic name and write it at the center.
- Branch three sub-topics out of the main idea.
- Give details to explain each sub-topic.
- Use it to plan essay writing and figure out your tasks.
A bubble map graphic organizer is similar to a central idea web. It places the concept, event, or item that you want to describe at the center and branch out bubbles to give details about the characteristics and properties of the given entity. Unlike a main idea web, you have to explain the topic without adding sub-branches to each sub-topic.
How to use
- Take the main idea and place it in the middle.
- Connect various bubbles with the main idea, each describing a different quality.
- Use descriptive words to explain each quality in the same bubble.
Using a concept map to depict the relationship between various ideas and concepts is far easier than explaining it using plain text. Students use it as a visual tool to quickly understand complex concepts. Engineers use it to plan the process flow and activities of a system, and it is also helpful in marketing to brainstorm a new business strategy.
How to use
- Depict the significant idea in a chart and briefly explain it.
- Divide the idea into various categories.
- Draw the connection between ideas using lines to explain the central concept better.
Use a lotus diagram to explain each part of the given idea or topic thoroughly. A lotus diagram is a visual representation of primary and secondary elements of a concept using boxes. The main idea is always written in the central box while each sub-concept and its components branch outwards until every concept is separately explained.
How to use
- Create a table-like diagram and add lots of columns and rows to make big boxes.
- Write the main idea in the most centered box.
- Try to explain it using sub-concepts and keep going until you conclude.
A cause-and-effect graphic organizer is a great helping tool for students as it makes it easier for them to understand the cause of specific activities and their effects. With it, students can quickly get the general idea of a story or concept by examining the cause and effect of various events in the story. Find more fishbone examples.
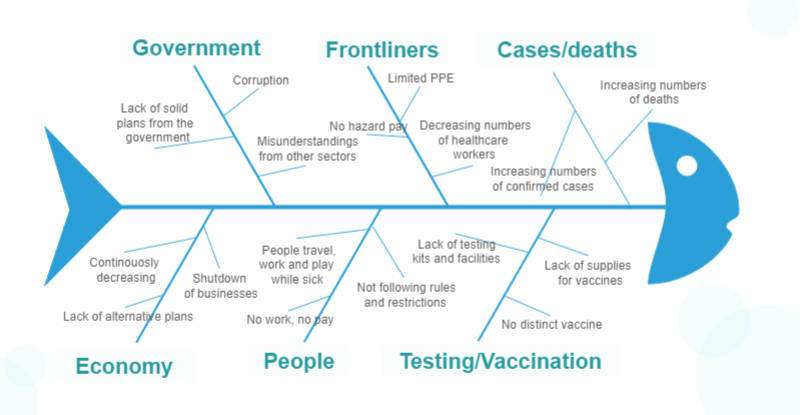
How to use
- You can create a simple graphic organizer to illustrate the relationship between cause and effect.
- Describe the cause on one side and its effect on the opposite side.
What are Graphic Organizers used for?
After learning what a graphic organizer is, you can easily see that they have such a universal application. Ideally, people use them for these three applications.
It is a known fact that visual aids like a graphic organizer are extremely beneficial for learning. As we solve a problem by giving it a pictorial representation, it makes it easier for us to grasp the concept. That is why mind maps are mostly used these days as a learning tool. Not only it encourages self learning, but the logic behind the problem is understood and retained in the mind.
Needless to say, with so many graphic organizer examples, it is now easier than ever to teach a concept. We can draw the sequence diagram to teach how a process works or simply compare two entities using a Venn diagram. These illustrations work as an ideal visual aid for educators to impart knowledge to their students and also to discuss any topic in detail.
If you are a professional who wants to come up with visually appealing documents, then a graphic organizer diagram would fit the bill. They are used by all kinds of professionals to explain a problem, work on a project, explain a strategy, and do so much more.
Learn From Graphic Organizer Examples
Even though by now you know what a graphic organizer is, you need to learn from some examples so that you can create one on your own. Here are not one, but three different graphic organizer examples to explain the same.
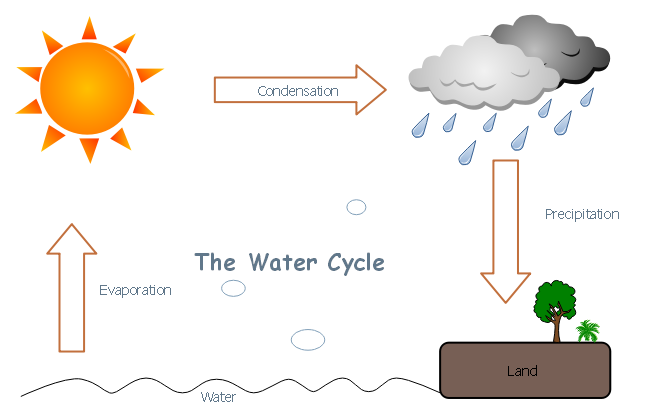
This is one of those concepts that we all have learned in school. Now, with these graphic organizer examples, you can easily teach others the same concept. By using different vectors, we have explained how water is evaporated from the ground by the sun. Later, it is condensed to form the clouds. In the end, it comes back to the land via precipitation (rain).
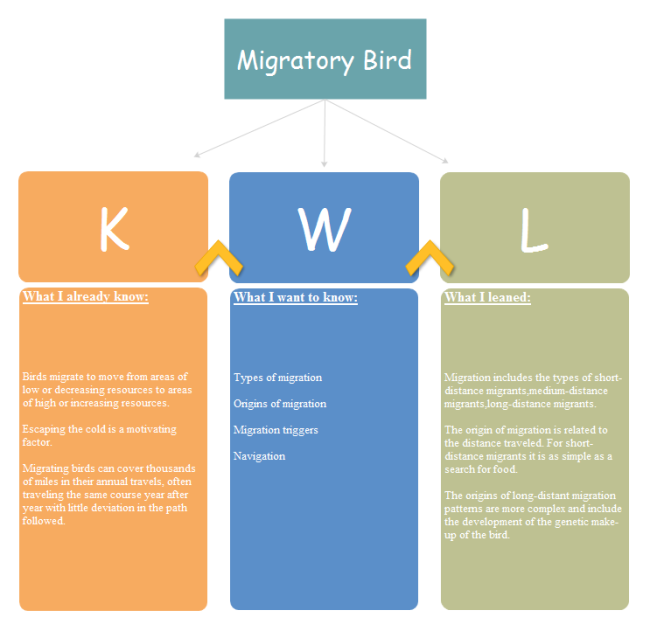
As you know, a KWL chart has three major components. Firstly, we have listed some basic things about migratory birds that we already know. In the beginning of the lecture, you can list the things you are about to cover. In the end, you can quickly note down what is learned in the lecture.
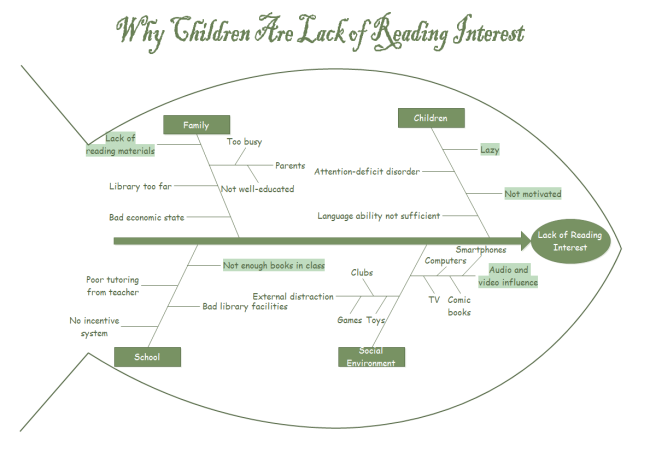
In this Fishbone diagram, we have discussed why kids lose their reading interest. The Fishbone diagram has been divided into different sets of causes like family, social environment, school, etc. For instance, if we explore school, it can further have causes like bad instructors, no books, poor library, etc.
How to Design a Graphic Organizer with EdrawMax?
Now you know what a graphic organizer is, its types, and have even seen some examples, you are well equipped to make one. Here’s how you can come up with your own graphic organizer in less time. Here you can find detailed steps of how to make a graphic organizer.
Step 1: Identify a problem
Firstly, you need to know what topic you are going to discuss. For instance, if you are a teacher who wants to educate your students about the Roman Empire, then the Roman Empire history could be a topic.
Step 2: Pick a diagram
Once you have a topic, select the type of diagram you wish to make and try to collect the needed information. If the topic is Roman Empire History, then you can create a timeline (sequence diagram).
Step 3: Use EdrawMax
Lastly, install and launch EdrawMax on your computer to start working on your next graphic organizer. The tool has a wide range of professionally designed and readily available vectors as well as pre-made templates. You can simply select any template and copy the available vectors.
These vectors can be changed as per your preferences. You can add your own content, change the overall appearance of the diagram, and even export it in different formats.
Graphic Organizer Maker
From the examples given above, you now understand that there are various formats of a graphic organizer. If you want to create one, you will need the best graphic organizer maker EdrawMax Online. It comes with a comprehensive template community where you can find any graphic organizer template. It also gives you lots of customization tools and editing options that will make your job effortless. You can save a lot of time with EdrawMax as you don't have to start making the graphic organizer from scratch.


